SlideShare a Scribd company logo
1
1.1 INTRODUCTION
Customer satisfaction can be experienced in a wide range of circumstances
and linked with both products and solutions. It is a highly personal
assessment is greatly influenced by individual expectations. Some
definitions are based on the observations that customer satisfaction or
dissatisfaction results from either the confirmation or disconfirmation of
individual expectations regarding a service or product. A customer may be
satisfied with a product or an attribute or any of these.
It is in this light, this project is done on the topic „Customer Satisfaction at
Navaratnan Hypermarket Chalakudy‟. Marketers of goods and services are
increasingly implementing service quality and customer satisfaction
surveys to measure business performance and some are even utilizing
results from these surveys to determine employee incentives and appeals.
The objectives of the survey is to assess the satisfaction level of various
customers and to know about the general perception and expectation of
customers and the extent to which they have been met and to identify the
weakness of organization.
Service quality is the degree of which the performance of service providers
matches customer expectations. Service is very important in today‟s context
as it is the key for attracting new customers and retaining of existing ones.
Bad service experienced forces customers to switch the brand or the service
provided in search for the one who provides them with satisfaction.
Services often come with satisfaction. Services often come with product but
it‟s purely only service.
There are four characteristics of services: Intangibility, Inseparability,
Variability and Perishability. The four aspects require special treatment as
regards the cognitive nature of foreign customers.
2
A customer satisfaction survey can provide management with a variability
input on both short term and long term decision making. Here is a
„customer satisfaction survey at Navaratna Hypermarket Chalakudy‟ which
gives an idea about the perception and expectation of different customers.
1.2 REVIEW OF LITERATURE
1. Clarke (2001) said, “a business that focuses exclusively on customer
satisfaction runs the risk of becoming an undifferentiated brand
whose customers believe only that it meets the minimum
performance criteria for the category. Long-term customer retention
in competitive markets requires the supplier to go beyond mere basic
satisfaction and to look for ways of establishing ties of loyalty that
will help ward off competitor attack”.
2. William (2003) – “customers are satisfied when their judgment of
the service they have received equals or exceeds what they
expected”. This can be expressed as customer satisfaction =
perception = expectations. This approach summarizes that a
customer might experience various degree of satisfactions. If the
product performances fall short of expectations, the customer is
dissatisfied.
3. According to Crompton and Mackay (1989) – “satisfaction is a
psychological outcome emerging from an experience”, where the
key concepts of an individual customer are concepts of expectations
and perceptions that form the degree of customer satisfaction
experienced.
4. Kotler (1996) – customer satisfaction is determined by „how well the
product meets the customer expectations for that product‟.
5. Eugene W. Anderson – a set of relevant category characteristic is
used to further understand variation in both the levels of these
variables and their relationship. Quality, expectation, satisfaction,
3
and satisfaction‟s effect on repurchase likelihood is lower – when
competition, differentiation, involvement or experience is high and
when switching costs, difficulty of standardization or ease of
evaluation quality is low.
6. Bowen and Chen (2001) – “the result of our study supported the
contention that there is a positive correlation between loyal
customers and profitability”.
1.3 STATEMENT OF THE PROBLEM
Every organization is trying to be at top position through providing better
services to the customers. The company must know the customers‟ needs
and wants and adequate step are to taken. Customer satisfaction is an
important factor that helps the organization to be at top position. Without
satisfying consumers no firms can exist in the market for long term. The
study is focused on customer satisfaction, through this study the company
will be able to know whether their customers are satisfied or not. So the
problem of study is “Are the customers of navaratna hypermarket satisfied
with their services provided.”
1.4 NEED AND SIGNIFICANCE OF THE STUDY
 This study will help the company to understand the preference of
customers to prefer this shop.
 Company can update their existing strategies, product qualities and
service provided as per customer‟s expectation.
 Company can reduce the cost incurred on marketing research for
understanding market trends and changing environment.
4
1.5 OBECTIVES OF THE STUDY
Following are the objectives of the study.
 To assess the satisfaction level of various customers.
 To study the general perception and expectation of customer and the
extent to which the same have been met
 To find out the factors affecting customer satisfaction.
1.6 RESEARCH METHODOLOGY
1. RESEARCH DESIGN
In this study research design is Descriptive and exploratory in nature.
2. SAMPLE DESIGN
The sampling technique used in the study in convenience sampling.
3. SAMPLE SIZE
Customers of Chalakudy Navaratna Hypermarket were selected for the
study. The sample size is limited to 50.
4. DATA FOR THE STUDY
The data collection pertaining to this study involves both primary and
secondary methods. The primary data was collected using a structured
questionnaire. The secondary data were collected from internet,
organization and from magazines.
TOOLS FOR ANALYSIS
The collected data analyzed with the help of relevant statistical tools such
as percentage analysis, charts and graphs.
5
1.7 LIMITATIONS OF THE STUDY
1. Time limit was the first constraint.
2. Co-operation from customers were limited.
3. Sample size was limited to 50.
6
2. COMPANY PROFILE
2.1 HISTORY
A hypermarket store by anatomy, Navaratna offers 365 Days of Ultimate
International Shopping Experience and a wide range of home and personal
products to choose from, all under a single roof. On April 10, 2010 we set
sail on an incredible journey with the inauguration of our first showroom at
Ashtamichira, Thrissur. Fast forward to 2016, we now have showrooms at
Mala (from July, 2011), Chalakkudy (from May, 2012), Annamanada (from
August, 2014), Moonupeedika (from May, 2015) and Kodungalloor (from
December, 2015). Through unparalleled customer dedication and support
we have chartered our path to excellence, and our legacy is for everyone to
see. We strive to fulfill each and every need of our beloved customers and
cater to them premium quality products from over a wide variety of
categories including home utility products like food, groceries and related
commodities, toiletries, kitchenware, bed and bath linen; personal products
in beauty and healthcare, ready-mades, garments, footwear, baby products,
fitness products and a lot more in the most competitive and affordable
prices.
7
2.2 ORGANISATIONAL CHART
2.3 CUSTOMER SERVICES AND FACILITIES
 Internationally competitive showrooms with state of the art facilities
specifically designed to address each individual‟s needs and priorities.
 Products of reputed national and international brands and bountiful
stocks of the said products.
 Seasonal and festival offers, discounts and free gifts to make your
special occasions truly special.
 Sales personnel with technical expertise and penchant for making your
shopping experience at Navaratna as worthwhile and encouraging as
possible.
Director
Manager
A/C Manager
Accountant
Supervisor
Computer operators
Workers
8
 After sales service of the highest quality and promptness in action and
response in case of any complaints from the customer‟s side.
2.4 OBJECTIVES
Vision is to serve as many people as possible and in the process are
planning on spreading our wings further into the sky. The ethics of
Navaratna are ingrained in each and every member of our family and we
have pledged to provide selfless service to our customers in every way
possible and once again have placed your happiness and satisfaction
above everything else.
 To provide quality products to customers at reasonable prices.
 To create employment opportunities for a large number of people.
 To provide an International Shopping Experience and a wide range
of home and personal products to choose from, all under a single
roof
2.5 COMPANY DETAILS
CIN U74999KL2016PTC046288
Company Name
NAVARATNA HYPERMARKET PRIVATE
LIMITED
Company Status Active
RoC RoC-Ernakulam
Registration Number 46288
Company Category Company limited by Shares
Company Sub
Category
Non-govt company
Class of Company Private
9
2.6 LOCATION
CHALAKKUDY
Navaratna Hypermarket, 25/771B,C,D,E,F,GKavungal Complex, KSRTC
Road,Chalakudy, Thrissur – 680307
2.7 COMPANY BRANCHES
CHALAKKUDY
Navaratna Hypermarket,
25/771B, C,D,E,F,GKavungal Complex,
KSRTC Road,Chalakudy,
Thrissur - 680307,
Mob : +91 8086800185,
Ph : 0480 2708500
ANNAMANADA
Navaratna Hypermarket,
Land Mark Auditorium Building,
Near KSRTC Bus stand,
Annamanada P.O,
Thrissur -680741,
Mob : +91 8086800153,
Ph :0480 2772277
MOONUPEEDIKA
10
Navaratna Hypermarket,
EKS Shopping Complex,
Moonnupeedika, Kaipamangalam P.O,
Thrissur -680686,
Mob : +91 8943345179,
Ph :0480 2847284
KODUNGALLUR
Navaratna Hypermarket,
Mughal Foundation Mall,
North Nada Kodungallur P.O,
Kodungallur,
PIN: 680664,
Mob : +91 8943345339,
Ph : 0480 2800180
MALA
Navaratna Hypermarket
XII/785E3 Mala GramaPanchayath
Smart Centre, Mala P.O
Near Private Bus Stand, Thrissur – 680732
Mob: +91 8086800196
Ph: 0480 2895335
ASHTAMICHIRA
Navaratna Hypermarket,
Ashtamichira P.O
Thrissur -680731
Mob : +91 8943345162
Ph : 0480 28972
11
3. THEORATICAL FRAMEWORK
3.1 WHO IS A CUSTOMER?
A customer is an individual or business that purchases the goods or services
produced by a business.
3.2 AN INTRODUCTION TO CUSTOMER SATISFACTION
 Customer satisfaction
Customer satisfaction is the measure of how the needs and responses are
collaborated and delivered to excel customer expectation. It can only be
attained if the customer has an overall good relationship with the supplier.
In today‟s competitive business marketplace, customer satisfaction is an
important performance exponent and basic differentiator of business
strategies. Hence, the more is customer satisfaction; more is the business
and the bonding with customer.Customer satisfaction is a part of
customer‟s experience that exposes a supplier‟s behavior on customer‟s
expectation. It also depends on how efficiently it is managed and how
promptly services are provided. This satisfaction could be related to various
business aspects like marketing, product manufacturing, engineering,
quality of products and services, responses customer‟s problems and
queries, completion of project, post delivery services, complaint
management etc.
Customer satisfaction is the overall essence of the impression about the
supplier by the customers. This impression which a customer makes
regarding supplier is the sum total of all the process he goes through, right
from communicating supplier before doing any marketing to post delivery
options and services and managing queries or complaints post-delivery.
During this process the customer comes across working environment of
12
various departments and the type of strategies involved in the organization.
This helps the customer to make strong opinion about the supplier which
finally results in satisfaction or dissatisfaction. Customer‟s perception on
supplier helps the customer choose among the supplier on basis of money
value and how well the delivered products suit all the requirements. The
supplier‟s services never diminishes after the delivery as customer seeks
high values post marketing services which could help them use and
customize the delivered product more efficiently. If he is satisfied with the
post marketing services then there are good chances for supplier to retain
the customers to enhance repeated purchases and make good business
profits.
 Few definitions of customer satisfaction
Kotler (1996) – customer satisfaction is determined by „how well the
product meets the customer expectations for that product‟.
Bowen and Chen (2001) – “the result of our study supported the contention
that there is a positive correlation between loyal customers and
profitability”.
According to Crompton and Mackay (1989) – “satisfaction is a
psychological outcome emerging from an experience”, where the key
concepts of an individual customer are concepts of expectations and
perceptions that form the degree of customer satisfaction experienced.
 Factors effecting customer satisfaction
Customer satisfaction is the overall impression of customer about the
supplier and the products and services delivered by the supplier. Following
are the important factors that could affect customer satisfaction:
 Department wise capability of the supplier.
13
 Technological and engineering or re-engineering aspects of products
and services.
 Type and quality of response provided by the supplier.
 Supplier‟s capability to commit on deadlines and how efficiently they
are met.
 Customer service provided by the supplier.
 Complaint management.
 Cost, quality, performance and efficiency of the product.
 Supplier‟s personal facets like etiquettes and friendliness.
 Supplier‟s ability to manage whole customer life cycle.
 Compatible and hassle free functions and operations.
Consumer preference: Consumer preference is a marketing term meaning
a consumer likes one thing over another. For instance, a trend may
indicate consumers prefer using debit cards over credit cards to pay for
goods.
All factors which determine the buying or consumer behaviour are broadly
classified into six. Psychological factors, Social factors, Cultural factors,
Personal factors, Economic factors and Environmental factors.
Psychological Factors
The following are the important psychological factors:
1) Consumer Needs and Motivation: All buying decisions start with need
recognition. People always seek to satisfy their needs. When need is not
satisfied it drives people to satisfy that need. Then the need becomes a
motive. Thus motive arises from needs and wants. The force that converts
needs into motives is called motivation.
14
2) Perception: It is the process of selecting, organizing and interpreting
information in order to givemeaning to the world or environment we live
in. the way the consumers display selective attention,Distortion or retention
motivates marketers to design the product, package, promotional themes
etc. The marketers should understand the consumer perception and convert
perception into a buying response.
3) Learning: Learning is the process of acquiring knowledge. Generally,
learning results in four ways-Listening, Reading, Observing and
experiencing. The importance of learning theory for marketers is that they
can create demand for a product by associating it with strong drives, using
motivating cues and providing positive reinforcement.
4) Belief and Attitude: A belief is a descriptive thought that a person holds
about something. Such thoughts
are based on learning, opinion or faith. For example, A consumer believes
that Maruti cars are less costly and fuel efficient. Attitude means a person‟s
feelings towards a particular object or situation.
Social Factors
The major social factors are as follows
Reference Group: consumer behaviour is influenced by various groups
within society known as reference groups. We have several reference
groups with whom an individual associate such as friends, relatives,
classmates, club memberships etc. In each groups there is an opinion leader
whose style is adopted by others. Marketers often identify such opinion
leaders and develop advertisement featuring them as endorsers.
WHY CUSTOMER SATISFACTION IS SO IMPORTANT?
Why is it that we can think of more examples of companies failing to
satisfy us rather than when we have been satisfied? There could be a
15
number of reasons for this. When we buy a product or service, we expect it
to be right. We don‟t jump up and down with glee saying “isn‟t it
wonderful, it actually worked”. This is what we paid our money for. Add to
this our world of ever exacting standards. We now have products available
to us that would astound our great grandparents and yet we quickly become
used to them. The bar is getting higher and higher. At the same time our
lives are ever more complicated with higher stress levels. Delighting
customers and achieving high customer satisfaction scores in this
environment is ever more difficult. And even if your customers are
completely satisfied with your product or service, significant chunks of
them could leave you and start doing business with your competition
A market trader has a continuous finger on the pulse of customer
satisfaction. Direct contact with customers indicates what he is doing right
or where he is going wrong. Such informal feedback is valuable in any
company but hard to formalize and are necessary to measure and track
customer satisfaction.
Developing a customer satisfaction programme is not just about carrying
out a customer service survey. Surveys provide the reading that shows
where attention is required but in many respects, this is the easy part. Very
often, major long lasting training of the staff, possibly involving cultural
change. The result should be financially beneficial with less customer
churn, higher market shares, premium prices, stronger brands and
reputation, and happier staff. However, there is a price to pay for these
improvements. Costs will be incurred in the market research survey. Time
will be spent working out an action plan. Training may well be required to
improve the customer service. The implication of customer satisfaction
surveys go far beyond the survey itself and will only be successful if fully
supported by the echelons of senior management.
16
There are six parts to any customer satisfaction programme:
1. Who should be interviewed?
2. What should be measured?
3. How should the interview be carried out?
4. How should satisfaction be measured?
5. What do the measurements mean?
6. How to use customer satisfaction surveys to greatest effect?
HOW SHOULD SATISFACTION BE MEASURED?
Customers express their satisfaction in many ways. When they are satisfied,
they mostly say nothing but return again and again to buy or use more.
When asked how they feel about a company or its products in open-ended
questioning they respond with anecdotes and may use terminology such as
delighted, extremely satisfied, very dissatisfied etc. Collecting the motleys
variety of adjectives together from open ended responses would be
problematical in a large survey. To overcome this problem market
researchers ask people to describe a company using verbal or numeric sales
with words that measure attitudes.
People are used to the concept of rating things with numerical scores and
these can work well in surveys. Once the respondent has been given the
anchors of the scale, they can readily give a number to express their level of
satisfaction. Typically, scales of 5, 7 or 10 are used where the lowest figure
indicates extreme dissatisfaction and the highest shows extreme
satisfaction. The stem of the scale is usually quite short since a scale of up
to 100 would prove too demanding for rating the dozens of specific issues
that are often on the questionnaire.
Measuring satisfaction is only half the story. It is also necessary to
determine customer‟s expectations or the importance they attach to the
different attributes, otherwise resources could be spent raising satisfaction
17
levels of things that do not matter. The measurement of expectations or
importance is more difficult than the measurement of satisfaction. Many
people do not know or cannot admit, even to themselves, what is important.
Customers do not spend their time rationalizing why they do things, their
views change and they may not be able to easily communicate or admit to
the complex issues in the buying argument.
The same Interval scales of words or numbers are often used to measure
importance- 5, 7 or 10 being very important and I being not at all important
and I being not at all important. However, most of the issues being
researched are of some importance for otherwise they would not be
considered in the study. As a result, the mean scores on importance may
show little differentiation between the vital issues such as knowledgeable
representatives and long opening hours. Ranking can indicate the
importance of a small list of up to six or seven factors but respondents
struggle to place things in rank order once the first four or five are out of
the way. It would not work four determining the importance of 30
attributes.
As a check against factors that are given a “stated importance” score,
researchers can statistically calculate (or “device”) the importance of the
same issues. Derived importance is calculated by correlating the
satisfaction levels of each attribute with the overall level of satisfaction.
Where there is a high link or correlation with an attribute, it can be inferred
that the attribute is driving customer satisfaction. Deriving the importance
of attributes can show the greater influence of softer issues such as the
friendliness of the staff or the power of the brand – things that people
somehow cannot rationalize or admit to in a “stated” answer.
18
DEVELOPING AN ACTION PLAN THAT RECTIFIES THE
WEAKNESSES AND BUILDS ON THE STRENGTHS
The purpose of customer satisfaction research is to improve customer
satisfaction and yet so often surveys sit collecting dust. Worse than that,
customers have generously given their time to assist in the customer service
survey believing that some positive action will take place. Their
expectations will have been raised. The process of collecting the data seems
easier than taking action to improve satisfaction levels.
In any customer satisfaction survey there will be quick fixes – actions that
can be taken today or tomorrow that will have immediate effect. These
could be quite information. In the longer term, cultural changes may well
be required to improve customer satisfaction, and that is more difficult.
A five-step process can be used to make these longer-term improvements.
5
step process
to make
longer -term
improvements
Spot The Gap
Challenge &
Redefine The
Segmentation
Challenge &
Redefine The
CVP
Create An
Action Plan
Measurement
&
Improvement
19
Step 1: Spot the gap
 Look at the customer satisfaction data to see where there are low
absolute scores and low scores relative to competition.
 Pay particular attention to those issues that are important to customers.
 Assumes the scores are correct unless there is irrefutable evidence to
the contrary and remember, perceptions are reality.
Step 2:Challenge and redefine the segmentation
 How do satisfaction scores vary across different types of customer?
 Are segments correctly defined in the light of the customer satisfaction
findings?
 How could a change in segmentation direct the offer more effectively
and so achieve higher levels of satisfaction?
Step 3: Challenge and redefine the customer value propositions.
 Are customer satisfactions scores low because the customer value
proposition (CVP) is not being communicated effectively to the
market?
 Are customer satisfactions scores low because the CVP is not being
effectively implemented?
 Is the CVP right for the segment? How could a change in CVP
achieve a higher customer satisfaction index (CSI)?
Step 4: Create an action plan
 Describe the problem.
 Think through the issues that need to be addressed and list them out.
 Identify the root cause of the problems.
 Identify any barriers that could stop the improvement taking place.
 Set measurable targets.
20
 Allocated resources (usually money and people)
 Assign people and time scales to the tasks.
 Measure and review progress
Step 5: Measure and review
 How has the customer satisfaction index (CSI) moved?
 Is the movement significant/real?
 Has the action recommended in the plan, taken place? Has it been
enough? Has it had enough time to work?
 Revisit the step – spot the gap, challenge the segmentation and CVP,
more action
When the survey results are available, they should be shared with the same
groups that were involved right at the beginning. Workshops are an
excellent environment for analyzing the survey findings and driving
through action planning. These are occasions when the survey data can be
made user friendly and explained so that it is moved from something that
has been collected and owned by the researcher to something that is
believed in and found useful by the people that will have to implement the
changes
As with all good action planning, the workshops should deliver mutually
agreed and achievable goals, assigned to people who can make things
happen, with dates for achievements and rewards for success. Training may
well be required to ensure that employees know how to handle customer
service issues and understand which tools to use in various situations.
Finally, there should be a constant review of the process as improving
customer satisfaction is a race that never ends.
21
Table 4.1 Shows the characteristics which influence the customer
to prefer this shop.
Category No. of respondents Percentage
Promotion 0 0
Price 4 8
Quality 37 74
Convenience 9 18
TOTAL 50 100
Diagram 4.1 Showing the characteristic which influence the
customer to prefer the shop.
Interpretation:
Above diagram shows that 74% of the respondent prefer the shop because of the
quality, 8% are influenced by price and the remaining 18% prefer the shop
because of their convenience.
0%
10%
20%
30%
40%
50%
60%
70%
80%
Promotion Price Quality Convenience
22
Table 4.2 Showing different kind of services provided by
Navaratna Hypermarket that attracted the customer the most.
Category No. of respondents Percentage
Services provided by
sales man 20 40
Parking Facility 10 20
Payment Modes 8 16
Product Selection 12 24
TOTAL 50 100
Diagram 4.2 Showing the services provided by Navaratna
Hypermarket for attracting customers.
Interpretation:
Above diagram shows that 40% of the respondents are attracted by service
provided by the salesman, 20% are influenced by parking facility, 16% are
attracted by payment modes and the remaining 24% are influenced by product
selection.
0%
5%
10%
15%
20%
25%
30%
35%
40%
45%
Services provided
by sales man
Parking Facility Payment Modes Product Selection
23
Table 4.3 Showing the advertisement media that influenced
customers to prefer the shop.
Diagram 4.3 Showing the advertisement media that influenced
customer to prefer the shop.
Interpretation:
Above diagram shows that 86% of the respondent are attracted by word of mouth,
6% are influenced through Newspapers and the 2% are influenced by each TV
and banners.
0%
10%
20%
30%
40%
50%
60%
70%
80%
90%
100%
TV Newspapers Banners Word of mouth
Category No. of respondents Percentage
TV 2 4
Newspapers 3 6
Banners 2 4
Word of mouth 43 86
TOTAL 50 100
24
Table 4.4 Showing frequency of consuming goods from the shop.
Category No. of respondents Percentage
Daily 3 6
Weekly 20 40
Monthly 26 52
Quarterly 1 2
TOTAL 50 100
Diagram 4.4 Showing the frequency of consuming goods from the
shop.
Interpretation:
Above diagram shows that 52% of respondent are coming to the shop monthly.
40% of respondents visit this shop monthly, 6% of respondents are coming to the
shop daily and the remaining 2% visit this shop quarterly.
0%
10%
20%
30%
40%
50%
60%
Daily Weekly Monthly Quaterly
25
Table 4.5 Showing the rating of customers towards the general
ambience, design and feel of the shop.
Category No. of respondents Percentage
Excellent 13 26
Very good 23 46
Average 13 26
Poor 1 2
TOTAL 50 100
Diagram 4.5 Showing the rating of customers towards the general
ambience, design and feel of the shop.
Interpretation:
From above diagram it is clear that 26% of respondents opinion about the general
ambience of the shop as excellent. 46% is of the opinion as very good and 26%
are of the opinion of average. The remaining respondents are of the opinion that
it‟s poor.
0%
5%
10%
15%
20%
25%
30%
35%
40%
45%
50%
Excellent Very good Average Poor
26
Table 4.6 Showing the rating of quality of product in Navaratna
Hypermarket.
Category No. of respondents Percentage
Excellent 11 22
Very good 28 56
Average 11 22
Poor 0 0
TOTAL 50 100
Diagram 4.6 Showing the rating of quality of product in Navaratna
Hypermarket.
Interpretation:
From the diagram it is clear that 22% of respondents rate the quality product as
excellent. 56% of respondents are of very good opinion and 22% tells that it is
average.
0%
10%
20%
30%
40%
50%
60%
Excellent Very good Average Poor
27
Table 4.7 Showing the rating of customers towards the hospitality
received in the shop.
Category No. of respondents Percentage
Excellent 6 12
Very good 25 50
Average 16 32
Poor 3 6
TOTAL 50 100
Diagram 4.7 Showing the rating of customers towards the
hospitality received in the shop.
Interpretation:
From the diagram it is clear that 12% of respondents rate the hospitality received
as excellent. 50% of respondents are of the opinion that it is good and 32% have
an average opinion. The remaining 6% of respondents are telling that it is poor.
0%
10%
20%
30%
40%
50%
60%
Excellent Very good Average Poor
28
Table 4.8 Shows the dissatisfaction experienced by the consumers
in the shop.
Category No. of respondents Percentage
High price 12 24
Expired products 2 4
Poor service 1 2
No dissatisfaction 35 70
TOTAL 50 100
Diagram 4.8 Shows the dissatisfaction experienced by the
consumer.
Interpretation:
Above diagram shows that 24% of consumers shows dissatisfaction due to high
priced product, 4% shows dissatisfaction because of expired products, 2% shows
dissatisfaction due to poor service and 70% are not dissatisfied.
0%
10%
20%
30%
40%
50%
60%
70%
80%
High price Expired products Poor service No dissatisfaction
29
Table 4.9 Shows the current strength of the outlet in market.
Category No. of respondents Percentage
Excellent 9 18
Very good 30 60
Average 11 22
Poor 0 0
TOTAL 50 100
Diagram 4.9 Shows the current strength of the outlet in the market.
Interpretation:
Above diagram shows that 18% of the respondents are of the opinion that the
current strength of the outlet in the market is excellent. 60% are of the opinion
that it is very good and 22% as average.
0%
10%
20%
30%
40%
50%
60%
70%
Excellent Very good Average Poor
30
Table 4.10 Shows the behavior of the sales people.
Category No. of respondents Percentage
Extremely satisfied 5 10
Satisfied 38 76
Dissatisfied 7 14
TOTAL 50 100
Diagram 4.10 Shows the behavior of the sales people.
Interpretation:
Above diagram shows that 76% respondents are satisfied with behavior of sales
people. 14% are dissatisfied with behavior of sales people, remaining 10% of
respondents are extremely satisfied.
0%
10%
20%
30%
40%
50%
60%
70%
80%
Extremely satisfied Satisfied Dissatisfied
31
Table 4.11 Showing the type of scheme affecting the buying
behavior of customers.
Category No. of respondents Percentage
Discount 19 38
Free Offers 11 22
Coupons 5 22
Others 15 30
TOTAL 50 100
Diagram 4.11 Showing the type of scheme affecting the buying
behavior of customers.
Interpretation:
Above diagram shows that 38% of the respondent buying behaviors are affected
by discounts, 22% are influenced by free offers and 10% are influenced by
coupons. The remaining 30% are influenced by others.
0%
5%
10%
15%
20%
25%
30%
35%
40%
Discount Free Offers Coupons Others
32
Table 4.12 Showing the opinion about varieties of offer provided
by the shop.
Category No. of respondents Percentage
Excellent 6 12
Very good 24 48
Average 16 32
Poor 4 8
TOTAL 50 100
Diagram 4.12 Showing the opinion about varieties of offers
provided by the shop.
Interpretation:
Above diagram shows 12% consumers rate the varieties of offers provided as
excellent, 48% as good, 32% as fair and 8% as poor.
0%
10%
20%
30%
40%
50%
60%
Excellent Good Fair Poor
33
Table 4.13 Shows the range of products available in the shop.
Category No. of respondents Percentage
Large range 19 38
Average range 30 60
Low range 1 2
TOTAL 50 100
Diagram 4.13 Shows the range of products available in the shop.
Interpretation:
Above diagram shows 38% of products are available in large range, 60% of
products are of average range and 2% are of low range.
0%
10%
20%
30%
40%
50%
60%
70%
Large range Average range Low range
34
Table 4.14 Shows the freebies provided to the customers.
Category No. of respondents Percentage
Always 15 30
Often 28 56
Never 7 14
TOTAL 50 100
Diagram 4.14 Shows the freebies being provided to the
customers.
Interpretation:
Above diagram shows 30% of customers always get freebies, 56% get freebies often
and 14% never get freebies.
0%
10%
20%
30%
40%
50%
60%
Always Often Never
35
Table 4.15 Shows the rating of services provided by the Navaratna
Hypermarket, coffee shop.
Diagram 4.15 Shows the rating of services provided in Navaratna
Hypermarket, coffee shop.
Interpretation:
Above diagram shows that 10% of customers rate the services provided by the
coffee shop as excellent, 62% as very good, 20% as average and 8% as poor.
0%
10%
20%
30%
40%
50%
60%
70%
Excellent Very good Average Poor
Category No. of respondents Percentage
Excellent 5 10
Very good 31 62
Average 10 20
Poor 4 8
TOTAL 50 100
36
4.1 FINDINGS
 74% of customers are influenced by quality of the products.
 40% of the customers were attracted by the services provided by
the salesmen.
 About 86% of the customers are of the opinion that they came to
the shop only by word of mouth.
 About 52% of the customers shop monthly from this hypermarket.
 From the survey it was found that about 46% of the customers feel
that the general ambience design and feel of the shop is very good.
 As per the survey it was clear that 56% of the customers feel that
they have met their requirements and expectations regarding
quality.
 About 50% of the customers feel that the hospitality received in
hypermarket is very good.
 The survey shows that 70% of the customers haven‟t experienced
any dissatisfaction.
 As per the survey 60% of the customers feel that the current
strength of this outlet in the market is very good.
 As per the survey we can understand that 76% of the customers are
satisfied with the behavior of the sales people.
 From the survey it was found that 38% of customers are
enlightened by discount scheme
 48% of the customers feel that the offers provided by the
hypermarket are good.
 About 60% of the customers feel that the range of the product
available here in average.
 From the survey it was found that 56% of the customers are
provided with freebies.
 Around 62% of the customers feel that the services provided in
Navaratna , like coffee shop is very good.
37
4.2SUGGESTIONS
 The management should introduce more free offers.
 The management should try to improve their services like payment
modes.
 The range of the products provided to the customers must be
increased.
 Freebies must always be provided to customers.
4.3 CONCLUSION
The project was done to know the “CUSTOMER SATISFACTION AT
NAVARATNAHYPERMARKET, CHALAKUDY”. On the basis of 50
samples of respondents, detailed analysis was made. Based on the data
collected, inferences are drawn and findings are suggestions were given.
The motto of the organization is to provide quality products at reasonable
price and to satisfy their customers.
From the survey it was found that the materials provided and the services of
Navaratna hypermarkets are very good. Though most of the customers are
satisfied with the services, there are certain areas which need special
attention. Managers must see to it that, the problems faces by the customer
are solved.
38
CUSTOMER SATISFACTION QUESTIONNAIRE
Customer Name: Signature: …………
Address : Date : …………
We would be grateful if you could spare a few minutes to complete this
questionnaire to help us to ensure that Navaratna Hypermarket standard of
customer care exceeds expectations wherever possible.
Please tick appropriate boxes to indicate your opinion.
1. Which characteristic‟s stated below influenced your preference in the shop?
☐Promotion
☐Price
☐Quality
☐Convenience
2. What kind of service provided by Navaratna Hypermarket attracted you the
most?
☐Service provided by Sales man
☐Parking facility
☐Payment modes
3. Which advertising media influence you to prefer this shop?
☐TV
☐Newspapers
☐Banners
☐Self interest
4. Your frequency of shopping from this shop?
☐Daily
☐Weekly
39
☐Monthly
5. How do you rate the quality, general ambience, design and the feel of the
shop
☐Excellent
☐Very good
☐Average
☐Poor
6. How do you rate the quality of products in Navaratna and did they meet your
requirements and expectations?
☐Excellent
☐Very good
☐Average
☐Poor
7. How do you rate the hospitality that you received in the shop?
☐Excellent
☐Very good
☐Average
☐Poor
8. What sort of dissatisfaction do you experience in the shop?
☐High price
☐Expired products
☐No dissatisfaction
9. As per your opinion, what is the current strength of this outlet in the market?
☐Excellent
☐Very good
☐Average
☐Poor
10. Are you satisfied with the behavior of sales people?
40
☐Extremely satisfied
☐Satisfied
☐Dissatisfied
11. Which type of scheme affects your buying behavior?
☐Discount
☐Free offers
☐Coupons
☐Others
12. How would you describe variety of offers?
☐Excellent
☐Good
☐Fair
☐Poor
13. Range of the product available here?
☐Large range
☐Average range
☐Low range
14. Are the freebies being provided to the customers?
☐Always
☐Often
☐Never
15. How do you rate services provided in the Navaratna like coffee shop?
☐Excellent
☐Very good
☐Average
☐Poor

More Related Content

What's hot

Final report on Consumer Buying Behavior and Factors Affecting their Buying B...
Final report on Consumer Buying Behavior and Factors Affecting their Buying B...Final report on Consumer Buying Behavior and Factors Affecting their Buying B...
Final report on Consumer Buying Behavior and Factors Affecting their Buying B...
Pran Mahato
 
“SATISFACTION OF CUSTOMERS TOWARDS D-MART”
“SATISFACTION OF CUSTOMERS TOWARDS D-MART”“SATISFACTION OF CUSTOMERS TOWARDS D-MART”
“SATISFACTION OF CUSTOMERS TOWARDS D-MART”
Ritesh Gholap (Digital Ritesh)
 
Big bazaar project
Big bazaar projectBig bazaar project
Big bazaar projectsandy14333
 
List of mba project topics reports
List of  mba project topics  reportsList of  mba project topics  reports
List of mba project topics reports
Babasab Patil
 
CONSUMER SATISFICTION ON AMAZON ONLINE SHOPPING
CONSUMER SATISFICTION ON AMAZON ONLINE SHOPPINGCONSUMER SATISFICTION ON AMAZON ONLINE SHOPPING
CONSUMER SATISFICTION ON AMAZON ONLINE SHOPPING
Amit Sarkar
 
A Study of Consumer Perception on Big Bazaar
A Study of Consumer Perception on Big BazaarA Study of Consumer Perception on Big Bazaar
A Study of Consumer Perception on Big Bazaar
Projects Kart
 
A study on buying behavior of customers in big bazaar
A study on buying behavior of customers in big bazaarA study on buying behavior of customers in big bazaar
A study on buying behavior of customers in big bazaar
Prakash Royal
 
Consumer perception towards business websites Mba project
Consumer perception towards business websites Mba project Consumer perception towards business websites Mba project
Consumer perception towards business websites Mba project
Varinder Singh Walia
 
A STUDY ON CUSTOMER SATISFACTION AT BIG BAZAAR (PATIA, BBSR)
 A STUDY ON CUSTOMER SATISFACTION AT BIG BAZAAR (PATIA, BBSR) A STUDY ON CUSTOMER SATISFACTION AT BIG BAZAAR (PATIA, BBSR)
A STUDY ON CUSTOMER SATISFACTION AT BIG BAZAAR (PATIA, BBSR)malaya_123
 
Dharm project big bazaar
Dharm project big bazaarDharm project big bazaar
Dharm project big bazaar
Dharmendra Kumar
 
A study on customer satisfaction, customer relationship management
A study on customer satisfaction, customer relationship managementA study on customer satisfaction, customer relationship management
A study on customer satisfaction, customer relationship management
alakunte
 
A study on Comsumer Behaviour towards Online Shopping in Maharashtra
A study on Comsumer Behaviour towards Online Shopping in MaharashtraA study on Comsumer Behaviour towards Online Shopping in Maharashtra
A study on Comsumer Behaviour towards Online Shopping in Maharashtra
Gauri Belan
 
A study of customer satisfaction
A study of customer satisfaction A study of customer satisfaction
A study of customer satisfaction
Tecnovaters Software Solutions Pvt Ltd
 
Consumer buying behaviour towards Online Retail: Flipkart v Amazon
Consumer buying behaviour towards Online Retail: Flipkart v AmazonConsumer buying behaviour towards Online Retail: Flipkart v Amazon
Consumer buying behaviour towards Online Retail: Flipkart v Amazon
Jubin James
 
A research project report on comparative study of vishal megamart and its com...
A research project report on comparative study of vishal megamart and its com...A research project report on comparative study of vishal megamart and its com...
A research project report on comparative study of vishal megamart and its com...
Projects Kart
 
PROJECT ON RELIANCE RETAIL
PROJECT ON RELIANCE RETAILPROJECT ON RELIANCE RETAIL
PROJECT ON RELIANCE RETAIL
tarun3288
 
Complete idp report on 'Consumer Behavior towards online shopping in Jamnagar...
Complete idp report on 'Consumer Behavior towards online shopping in Jamnagar...Complete idp report on 'Consumer Behavior towards online shopping in Jamnagar...
Complete idp report on 'Consumer Behavior towards online shopping in Jamnagar...
Darshana Chauhan
 
A PROJECT REPORT ON MARKETING RESEARCH
A PROJECT REPORT ON MARKETING RESEARCHA PROJECT REPORT ON MARKETING RESEARCH
A PROJECT REPORT ON MARKETING RESEARCHsanjay3017
 
MBA marketing (summer internship report)
MBA marketing (summer internship report)MBA marketing (summer internship report)
MBA marketing (summer internship report)
MANUJ SINGH
 
Presentation of d mart
Presentation of d martPresentation of d mart
Presentation of d martganaraya
 

What's hot (20)

Final report on Consumer Buying Behavior and Factors Affecting their Buying B...
Final report on Consumer Buying Behavior and Factors Affecting their Buying B...Final report on Consumer Buying Behavior and Factors Affecting their Buying B...
Final report on Consumer Buying Behavior and Factors Affecting their Buying B...
 
“SATISFACTION OF CUSTOMERS TOWARDS D-MART”
“SATISFACTION OF CUSTOMERS TOWARDS D-MART”“SATISFACTION OF CUSTOMERS TOWARDS D-MART”
“SATISFACTION OF CUSTOMERS TOWARDS D-MART”
 
Big bazaar project
Big bazaar projectBig bazaar project
Big bazaar project
 
List of mba project topics reports
List of  mba project topics  reportsList of  mba project topics  reports
List of mba project topics reports
 
CONSUMER SATISFICTION ON AMAZON ONLINE SHOPPING
CONSUMER SATISFICTION ON AMAZON ONLINE SHOPPINGCONSUMER SATISFICTION ON AMAZON ONLINE SHOPPING
CONSUMER SATISFICTION ON AMAZON ONLINE SHOPPING
 
A Study of Consumer Perception on Big Bazaar
A Study of Consumer Perception on Big BazaarA Study of Consumer Perception on Big Bazaar
A Study of Consumer Perception on Big Bazaar
 
A study on buying behavior of customers in big bazaar
A study on buying behavior of customers in big bazaarA study on buying behavior of customers in big bazaar
A study on buying behavior of customers in big bazaar
 
Consumer perception towards business websites Mba project
Consumer perception towards business websites Mba project Consumer perception towards business websites Mba project
Consumer perception towards business websites Mba project
 
A STUDY ON CUSTOMER SATISFACTION AT BIG BAZAAR (PATIA, BBSR)
 A STUDY ON CUSTOMER SATISFACTION AT BIG BAZAAR (PATIA, BBSR) A STUDY ON CUSTOMER SATISFACTION AT BIG BAZAAR (PATIA, BBSR)
A STUDY ON CUSTOMER SATISFACTION AT BIG BAZAAR (PATIA, BBSR)
 
Dharm project big bazaar
Dharm project big bazaarDharm project big bazaar
Dharm project big bazaar
 
A study on customer satisfaction, customer relationship management
A study on customer satisfaction, customer relationship managementA study on customer satisfaction, customer relationship management
A study on customer satisfaction, customer relationship management
 
A study on Comsumer Behaviour towards Online Shopping in Maharashtra
A study on Comsumer Behaviour towards Online Shopping in MaharashtraA study on Comsumer Behaviour towards Online Shopping in Maharashtra
A study on Comsumer Behaviour towards Online Shopping in Maharashtra
 
A study of customer satisfaction
A study of customer satisfaction A study of customer satisfaction
A study of customer satisfaction
 
Consumer buying behaviour towards Online Retail: Flipkart v Amazon
Consumer buying behaviour towards Online Retail: Flipkart v AmazonConsumer buying behaviour towards Online Retail: Flipkart v Amazon
Consumer buying behaviour towards Online Retail: Flipkart v Amazon
 
A research project report on comparative study of vishal megamart and its com...
A research project report on comparative study of vishal megamart and its com...A research project report on comparative study of vishal megamart and its com...
A research project report on comparative study of vishal megamart and its com...
 
PROJECT ON RELIANCE RETAIL
PROJECT ON RELIANCE RETAILPROJECT ON RELIANCE RETAIL
PROJECT ON RELIANCE RETAIL
 
Complete idp report on 'Consumer Behavior towards online shopping in Jamnagar...
Complete idp report on 'Consumer Behavior towards online shopping in Jamnagar...Complete idp report on 'Consumer Behavior towards online shopping in Jamnagar...
Complete idp report on 'Consumer Behavior towards online shopping in Jamnagar...
 
A PROJECT REPORT ON MARKETING RESEARCH
A PROJECT REPORT ON MARKETING RESEARCHA PROJECT REPORT ON MARKETING RESEARCH
A PROJECT REPORT ON MARKETING RESEARCH
 
MBA marketing (summer internship report)
MBA marketing (summer internship report)MBA marketing (summer internship report)
MBA marketing (summer internship report)
 
Presentation of d mart
Presentation of d martPresentation of d mart
Presentation of d mart
 

Similar to A study of customer satisfaction at navaratna hypermarket, chalakudy

OICX Retail Customer Experience
OICX Retail Customer ExperienceOICX Retail Customer Experience
OICX Retail Customer ExperienceDamian Kernahan
 
Customer service in clinical research markets jeff parke intellectual property
Customer service in clinical research markets jeff parke intellectual propertyCustomer service in clinical research markets jeff parke intellectual property
Customer service in clinical research markets jeff parke intellectual property
Jeff Parke
 
Sridhar.marketing new
Sridhar.marketing newSridhar.marketing new
Sridhar.marketing new
VANGARI VINAY
 
Customer satisfaction on Hero Motocop Ltd after split with Honda
Customer satisfaction on Hero Motocop Ltd after split with Honda  Customer satisfaction on Hero Motocop Ltd after split with Honda
Customer satisfaction on Hero Motocop Ltd after split with Honda KPMG
 
pdfcoffee.com_37039592-mba-full-project-pdf-free.pdf
pdfcoffee.com_37039592-mba-full-project-pdf-free.pdfpdfcoffee.com_37039592-mba-full-project-pdf-free.pdf
pdfcoffee.com_37039592-mba-full-project-pdf-free.pdf
KKillerKiller
 
Customer satisfaction on airtel
Customer  satisfaction on airtelCustomer  satisfaction on airtel
Customer satisfaction on airtel
goryaram
 
Customer focus seminar final ppts
Customer focus seminar final pptsCustomer focus seminar final ppts
Customer focus seminar final ppts
ssuser7413b8
 
consumer Satisfaction
consumer Satisfaction consumer Satisfaction
consumer Satisfaction
Amit Pandey
 
2bodyofdissertation 131104105101-phpapp01
2bodyofdissertation 131104105101-phpapp012bodyofdissertation 131104105101-phpapp01
2bodyofdissertation 131104105101-phpapp01
Amanlal Tapase
 
Sangam dairy project yedukondalu
Sangam dairy project   yedukondaluSangam dairy project   yedukondalu
Sangam dairy project yedukondalu
Venkata Reddy
 
371341891-A-Study-on-Customer-Satisfaction-Towards-Maruti-Suzuki-Cars-in-Luck...
371341891-A-Study-on-Customer-Satisfaction-Towards-Maruti-Suzuki-Cars-in-Luck...371341891-A-Study-on-Customer-Satisfaction-Towards-Maruti-Suzuki-Cars-in-Luck...
371341891-A-Study-on-Customer-Satisfaction-Towards-Maruti-Suzuki-Cars-in-Luck...
jeyamxerox
 
Customer satisfaction of oppo mobiles
Customer satisfaction of oppo mobilesCustomer satisfaction of oppo mobiles
Customer satisfaction of oppo mobiles
jyotikumari285
 
Vinay marketing projects final 19 7
Vinay marketing projects final 19 7Vinay marketing projects final 19 7
Vinay marketing projects final 19 7
Bandi Vinayreddy
 
Customer-Experience-Toolkit.pdf
Customer-Experience-Toolkit.pdfCustomer-Experience-Toolkit.pdf
Customer-Experience-Toolkit.pdf
NachisaleWakuNtcheu
 
Twills
TwillsTwills
A STUDY ON CUSTOMERS SATISFACTION OF BARTI AIRTEL TELECOMMUNICATION IN TIRUPU...
A STUDY ON CUSTOMERS SATISFACTION OF BARTI AIRTEL TELECOMMUNICATION IN TIRUPU...A STUDY ON CUSTOMERS SATISFACTION OF BARTI AIRTEL TELECOMMUNICATION IN TIRUPU...
A STUDY ON CUSTOMERS SATISFACTION OF BARTI AIRTEL TELECOMMUNICATION IN TIRUPU...
saravana vel.k
 
Project work customer satisfaction(1)(1)
Project work   customer satisfaction(1)(1)Project work   customer satisfaction(1)(1)
Project work customer satisfaction(1)(1)
bharadwaja yellapragada
 
Cutomer satifiastion project
Cutomer satifiastion projectCutomer satifiastion project
Cutomer satifiastion project
Koustubh Suryawanshi
 
Customer satisfaction-in-big-bazaar
Customer satisfaction-in-big-bazaarCustomer satisfaction-in-big-bazaar
Customer satisfaction-in-big-bazaar
mohit gupta
 
Internal customer satisfaction
Internal customer satisfactionInternal customer satisfaction
Internal customer satisfactionashwan411
 

Similar to A study of customer satisfaction at navaratna hypermarket, chalakudy (20)

OICX Retail Customer Experience
OICX Retail Customer ExperienceOICX Retail Customer Experience
OICX Retail Customer Experience
 
Customer service in clinical research markets jeff parke intellectual property
Customer service in clinical research markets jeff parke intellectual propertyCustomer service in clinical research markets jeff parke intellectual property
Customer service in clinical research markets jeff parke intellectual property
 
Sridhar.marketing new
Sridhar.marketing newSridhar.marketing new
Sridhar.marketing new
 
Customer satisfaction on Hero Motocop Ltd after split with Honda
Customer satisfaction on Hero Motocop Ltd after split with Honda  Customer satisfaction on Hero Motocop Ltd after split with Honda
Customer satisfaction on Hero Motocop Ltd after split with Honda
 
pdfcoffee.com_37039592-mba-full-project-pdf-free.pdf
pdfcoffee.com_37039592-mba-full-project-pdf-free.pdfpdfcoffee.com_37039592-mba-full-project-pdf-free.pdf
pdfcoffee.com_37039592-mba-full-project-pdf-free.pdf
 
Customer satisfaction on airtel
Customer  satisfaction on airtelCustomer  satisfaction on airtel
Customer satisfaction on airtel
 
Customer focus seminar final ppts
Customer focus seminar final pptsCustomer focus seminar final ppts
Customer focus seminar final ppts
 
consumer Satisfaction
consumer Satisfaction consumer Satisfaction
consumer Satisfaction
 
2bodyofdissertation 131104105101-phpapp01
2bodyofdissertation 131104105101-phpapp012bodyofdissertation 131104105101-phpapp01
2bodyofdissertation 131104105101-phpapp01
 
Sangam dairy project yedukondalu
Sangam dairy project   yedukondaluSangam dairy project   yedukondalu
Sangam dairy project yedukondalu
 
371341891-A-Study-on-Customer-Satisfaction-Towards-Maruti-Suzuki-Cars-in-Luck...
371341891-A-Study-on-Customer-Satisfaction-Towards-Maruti-Suzuki-Cars-in-Luck...371341891-A-Study-on-Customer-Satisfaction-Towards-Maruti-Suzuki-Cars-in-Luck...
371341891-A-Study-on-Customer-Satisfaction-Towards-Maruti-Suzuki-Cars-in-Luck...
 
Customer satisfaction of oppo mobiles
Customer satisfaction of oppo mobilesCustomer satisfaction of oppo mobiles
Customer satisfaction of oppo mobiles
 
Vinay marketing projects final 19 7
Vinay marketing projects final 19 7Vinay marketing projects final 19 7
Vinay marketing projects final 19 7
 
Customer-Experience-Toolkit.pdf
Customer-Experience-Toolkit.pdfCustomer-Experience-Toolkit.pdf
Customer-Experience-Toolkit.pdf
 
Twills
TwillsTwills
Twills
 
A STUDY ON CUSTOMERS SATISFACTION OF BARTI AIRTEL TELECOMMUNICATION IN TIRUPU...
A STUDY ON CUSTOMERS SATISFACTION OF BARTI AIRTEL TELECOMMUNICATION IN TIRUPU...A STUDY ON CUSTOMERS SATISFACTION OF BARTI AIRTEL TELECOMMUNICATION IN TIRUPU...
A STUDY ON CUSTOMERS SATISFACTION OF BARTI AIRTEL TELECOMMUNICATION IN TIRUPU...
 
Project work customer satisfaction(1)(1)
Project work   customer satisfaction(1)(1)Project work   customer satisfaction(1)(1)
Project work customer satisfaction(1)(1)
 
Cutomer satifiastion project
Cutomer satifiastion projectCutomer satifiastion project
Cutomer satifiastion project
 
Customer satisfaction-in-big-bazaar
Customer satisfaction-in-big-bazaarCustomer satisfaction-in-big-bazaar
Customer satisfaction-in-big-bazaar
 
Internal customer satisfaction
Internal customer satisfactionInternal customer satisfaction
Internal customer satisfaction
 

Recently uploaded

Supporting (UKRI) OA monographs at Salford.pptx
Supporting (UKRI) OA monographs at Salford.pptxSupporting (UKRI) OA monographs at Salford.pptx
Supporting (UKRI) OA monographs at Salford.pptx
Jisc
 
Language Across the Curriculm LAC B.Ed.
Language Across the  Curriculm LAC B.Ed.Language Across the  Curriculm LAC B.Ed.
Language Across the Curriculm LAC B.Ed.
Atul Kumar Singh
 
Additional Benefits for Employee Website.pdf
Additional Benefits for Employee Website.pdfAdditional Benefits for Employee Website.pdf
Additional Benefits for Employee Website.pdf
joachimlavalley1
 
Phrasal Verbs.XXXXXXXXXXXXXXXXXXXXXXXXXX
Phrasal Verbs.XXXXXXXXXXXXXXXXXXXXXXXXXXPhrasal Verbs.XXXXXXXXXXXXXXXXXXXXXXXXXX
Phrasal Verbs.XXXXXXXXXXXXXXXXXXXXXXXXXX
MIRIAMSALINAS13
 
How to Create Map Views in the Odoo 17 ERP
How to Create Map Views in the Odoo 17 ERPHow to Create Map Views in the Odoo 17 ERP
How to Create Map Views in the Odoo 17 ERP
Celine George
 
Fish and Chips - have they had their chips
Fish and Chips - have they had their chipsFish and Chips - have they had their chips
Fish and Chips - have they had their chips
GeoBlogs
 
Sectors of the Indian Economy - Class 10 Study Notes pdf
Sectors of the Indian Economy - Class 10 Study Notes pdfSectors of the Indian Economy - Class 10 Study Notes pdf
Sectors of the Indian Economy - Class 10 Study Notes pdf
Vivekanand Anglo Vedic Academy
 
Polish students' mobility in the Czech Republic
Polish students' mobility in the Czech RepublicPolish students' mobility in the Czech Republic
Polish students' mobility in the Czech Republic
Anna Sz.
 
Instructions for Submissions thorugh G- Classroom.pptx
Instructions for Submissions thorugh G- Classroom.pptxInstructions for Submissions thorugh G- Classroom.pptx
Instructions for Submissions thorugh G- Classroom.pptx
Jheel Barad
 
2024.06.01 Introducing a competency framework for languag learning materials ...
2024.06.01 Introducing a competency framework for languag learning materials ...2024.06.01 Introducing a competency framework for languag learning materials ...
2024.06.01 Introducing a competency framework for languag learning materials ...
Sandy Millin
 
ESC Beyond Borders _From EU to You_ InfoPack general.pdf
ESC Beyond Borders _From EU to You_ InfoPack general.pdfESC Beyond Borders _From EU to You_ InfoPack general.pdf
ESC Beyond Borders _From EU to You_ InfoPack general.pdf
Fundacja Rozwoju Społeczeństwa Przedsiębiorczego
 
MARUTI SUZUKI- A Successful Joint Venture in India.pptx
MARUTI SUZUKI- A Successful Joint Venture in India.pptxMARUTI SUZUKI- A Successful Joint Venture in India.pptx
MARUTI SUZUKI- A Successful Joint Venture in India.pptx
bennyroshan06
 
CLASS 11 CBSE B.St Project AIDS TO TRADE - INSURANCE
CLASS 11 CBSE B.St Project AIDS TO TRADE - INSURANCECLASS 11 CBSE B.St Project AIDS TO TRADE - INSURANCE
CLASS 11 CBSE B.St Project AIDS TO TRADE - INSURANCE
BhavyaRajput3
 
The Roman Empire A Historical Colossus.pdf
The Roman Empire A Historical Colossus.pdfThe Roman Empire A Historical Colossus.pdf
The Roman Empire A Historical Colossus.pdf
kaushalkr1407
 
special B.ed 2nd year old paper_20240531.pdf
special B.ed 2nd year old paper_20240531.pdfspecial B.ed 2nd year old paper_20240531.pdf
special B.ed 2nd year old paper_20240531.pdf
Special education needs
 
Model Attribute Check Company Auto Property
Model Attribute  Check Company Auto PropertyModel Attribute  Check Company Auto Property
Model Attribute Check Company Auto Property
Celine George
 
Template Jadual Bertugas Kelas (Boleh Edit)
Template Jadual Bertugas Kelas (Boleh Edit)Template Jadual Bertugas Kelas (Boleh Edit)
Template Jadual Bertugas Kelas (Boleh Edit)
rosedainty
 
The geography of Taylor Swift - some ideas
The geography of Taylor Swift - some ideasThe geography of Taylor Swift - some ideas
The geography of Taylor Swift - some ideas
GeoBlogs
 
GIÁO ÁN DẠY THÊM (KẾ HOẠCH BÀI BUỔI 2) - TIẾNG ANH 8 GLOBAL SUCCESS (2 CỘT) N...
GIÁO ÁN DẠY THÊM (KẾ HOẠCH BÀI BUỔI 2) - TIẾNG ANH 8 GLOBAL SUCCESS (2 CỘT) N...GIÁO ÁN DẠY THÊM (KẾ HOẠCH BÀI BUỔI 2) - TIẾNG ANH 8 GLOBAL SUCCESS (2 CỘT) N...
GIÁO ÁN DẠY THÊM (KẾ HOẠCH BÀI BUỔI 2) - TIẾNG ANH 8 GLOBAL SUCCESS (2 CỘT) N...
Nguyen Thanh Tu Collection
 
How to Make a Field invisible in Odoo 17
How to Make a Field invisible in Odoo 17How to Make a Field invisible in Odoo 17
How to Make a Field invisible in Odoo 17
Celine George
 

Recently uploaded (20)

Supporting (UKRI) OA monographs at Salford.pptx
Supporting (UKRI) OA monographs at Salford.pptxSupporting (UKRI) OA monographs at Salford.pptx
Supporting (UKRI) OA monographs at Salford.pptx
 
Language Across the Curriculm LAC B.Ed.
Language Across the  Curriculm LAC B.Ed.Language Across the  Curriculm LAC B.Ed.
Language Across the Curriculm LAC B.Ed.
 
Additional Benefits for Employee Website.pdf
Additional Benefits for Employee Website.pdfAdditional Benefits for Employee Website.pdf
Additional Benefits for Employee Website.pdf
 
Phrasal Verbs.XXXXXXXXXXXXXXXXXXXXXXXXXX
Phrasal Verbs.XXXXXXXXXXXXXXXXXXXXXXXXXXPhrasal Verbs.XXXXXXXXXXXXXXXXXXXXXXXXXX
Phrasal Verbs.XXXXXXXXXXXXXXXXXXXXXXXXXX
 
How to Create Map Views in the Odoo 17 ERP
How to Create Map Views in the Odoo 17 ERPHow to Create Map Views in the Odoo 17 ERP
How to Create Map Views in the Odoo 17 ERP
 
Fish and Chips - have they had their chips
Fish and Chips - have they had their chipsFish and Chips - have they had their chips
Fish and Chips - have they had their chips
 
Sectors of the Indian Economy - Class 10 Study Notes pdf
Sectors of the Indian Economy - Class 10 Study Notes pdfSectors of the Indian Economy - Class 10 Study Notes pdf
Sectors of the Indian Economy - Class 10 Study Notes pdf
 
Polish students' mobility in the Czech Republic
Polish students' mobility in the Czech RepublicPolish students' mobility in the Czech Republic
Polish students' mobility in the Czech Republic
 
Instructions for Submissions thorugh G- Classroom.pptx
Instructions for Submissions thorugh G- Classroom.pptxInstructions for Submissions thorugh G- Classroom.pptx
Instructions for Submissions thorugh G- Classroom.pptx
 
2024.06.01 Introducing a competency framework for languag learning materials ...
2024.06.01 Introducing a competency framework for languag learning materials ...2024.06.01 Introducing a competency framework for languag learning materials ...
2024.06.01 Introducing a competency framework for languag learning materials ...
 
ESC Beyond Borders _From EU to You_ InfoPack general.pdf
ESC Beyond Borders _From EU to You_ InfoPack general.pdfESC Beyond Borders _From EU to You_ InfoPack general.pdf
ESC Beyond Borders _From EU to You_ InfoPack general.pdf
 
MARUTI SUZUKI- A Successful Joint Venture in India.pptx
MARUTI SUZUKI- A Successful Joint Venture in India.pptxMARUTI SUZUKI- A Successful Joint Venture in India.pptx
MARUTI SUZUKI- A Successful Joint Venture in India.pptx
 
CLASS 11 CBSE B.St Project AIDS TO TRADE - INSURANCE
CLASS 11 CBSE B.St Project AIDS TO TRADE - INSURANCECLASS 11 CBSE B.St Project AIDS TO TRADE - INSURANCE
CLASS 11 CBSE B.St Project AIDS TO TRADE - INSURANCE
 
The Roman Empire A Historical Colossus.pdf
The Roman Empire A Historical Colossus.pdfThe Roman Empire A Historical Colossus.pdf
The Roman Empire A Historical Colossus.pdf
 
special B.ed 2nd year old paper_20240531.pdf
special B.ed 2nd year old paper_20240531.pdfspecial B.ed 2nd year old paper_20240531.pdf
special B.ed 2nd year old paper_20240531.pdf
 
Model Attribute Check Company Auto Property
Model Attribute  Check Company Auto PropertyModel Attribute  Check Company Auto Property
Model Attribute Check Company Auto Property
 
Template Jadual Bertugas Kelas (Boleh Edit)
Template Jadual Bertugas Kelas (Boleh Edit)Template Jadual Bertugas Kelas (Boleh Edit)
Template Jadual Bertugas Kelas (Boleh Edit)
 
The geography of Taylor Swift - some ideas
The geography of Taylor Swift - some ideasThe geography of Taylor Swift - some ideas
The geography of Taylor Swift - some ideas
 
GIÁO ÁN DẠY THÊM (KẾ HOẠCH BÀI BUỔI 2) - TIẾNG ANH 8 GLOBAL SUCCESS (2 CỘT) N...
GIÁO ÁN DẠY THÊM (KẾ HOẠCH BÀI BUỔI 2) - TIẾNG ANH 8 GLOBAL SUCCESS (2 CỘT) N...GIÁO ÁN DẠY THÊM (KẾ HOẠCH BÀI BUỔI 2) - TIẾNG ANH 8 GLOBAL SUCCESS (2 CỘT) N...
GIÁO ÁN DẠY THÊM (KẾ HOẠCH BÀI BUỔI 2) - TIẾNG ANH 8 GLOBAL SUCCESS (2 CỘT) N...
 
How to Make a Field invisible in Odoo 17
How to Make a Field invisible in Odoo 17How to Make a Field invisible in Odoo 17
How to Make a Field invisible in Odoo 17
 

A study of customer satisfaction at navaratna hypermarket, chalakudy

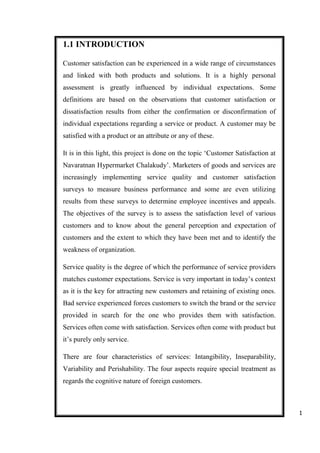
  • 1. 1 1.1 INTRODUCTION Customer satisfaction can be experienced in a wide range of circumstances and linked with both products and solutions. It is a highly personal assessment is greatly influenced by individual expectations. Some definitions are based on the observations that customer satisfaction or dissatisfaction results from either the confirmation or disconfirmation of individual expectations regarding a service or product. A customer may be satisfied with a product or an attribute or any of these. It is in this light, this project is done on the topic „Customer Satisfaction at Navaratnan Hypermarket Chalakudy‟. Marketers of goods and services are increasingly implementing service quality and customer satisfaction surveys to measure business performance and some are even utilizing results from these surveys to determine employee incentives and appeals. The objectives of the survey is to assess the satisfaction level of various customers and to know about the general perception and expectation of customers and the extent to which they have been met and to identify the weakness of organization. Service quality is the degree of which the performance of service providers matches customer expectations. Service is very important in today‟s context as it is the key for attracting new customers and retaining of existing ones. Bad service experienced forces customers to switch the brand or the service provided in search for the one who provides them with satisfaction. Services often come with satisfaction. Services often come with product but it‟s purely only service. There are four characteristics of services: Intangibility, Inseparability, Variability and Perishability. The four aspects require special treatment as regards the cognitive nature of foreign customers.
  • 2. 2 A customer satisfaction survey can provide management with a variability input on both short term and long term decision making. Here is a „customer satisfaction survey at Navaratna Hypermarket Chalakudy‟ which gives an idea about the perception and expectation of different customers. 1.2 REVIEW OF LITERATURE 1. Clarke (2001) said, “a business that focuses exclusively on customer satisfaction runs the risk of becoming an undifferentiated brand whose customers believe only that it meets the minimum performance criteria for the category. Long-term customer retention in competitive markets requires the supplier to go beyond mere basic satisfaction and to look for ways of establishing ties of loyalty that will help ward off competitor attack”. 2. William (2003) – “customers are satisfied when their judgment of the service they have received equals or exceeds what they expected”. This can be expressed as customer satisfaction = perception = expectations. This approach summarizes that a customer might experience various degree of satisfactions. If the product performances fall short of expectations, the customer is dissatisfied. 3. According to Crompton and Mackay (1989) – “satisfaction is a psychological outcome emerging from an experience”, where the key concepts of an individual customer are concepts of expectations and perceptions that form the degree of customer satisfaction experienced. 4. Kotler (1996) – customer satisfaction is determined by „how well the product meets the customer expectations for that product‟. 5. Eugene W. Anderson – a set of relevant category characteristic is used to further understand variation in both the levels of these variables and their relationship. Quality, expectation, satisfaction,
  • 3. 3 and satisfaction‟s effect on repurchase likelihood is lower – when competition, differentiation, involvement or experience is high and when switching costs, difficulty of standardization or ease of evaluation quality is low. 6. Bowen and Chen (2001) – “the result of our study supported the contention that there is a positive correlation between loyal customers and profitability”. 1.3 STATEMENT OF THE PROBLEM Every organization is trying to be at top position through providing better services to the customers. The company must know the customers‟ needs and wants and adequate step are to taken. Customer satisfaction is an important factor that helps the organization to be at top position. Without satisfying consumers no firms can exist in the market for long term. The study is focused on customer satisfaction, through this study the company will be able to know whether their customers are satisfied or not. So the problem of study is “Are the customers of navaratna hypermarket satisfied with their services provided.” 1.4 NEED AND SIGNIFICANCE OF THE STUDY  This study will help the company to understand the preference of customers to prefer this shop.  Company can update their existing strategies, product qualities and service provided as per customer‟s expectation.  Company can reduce the cost incurred on marketing research for understanding market trends and changing environment.
  • 4. 4 1.5 OBECTIVES OF THE STUDY Following are the objectives of the study.  To assess the satisfaction level of various customers.  To study the general perception and expectation of customer and the extent to which the same have been met  To find out the factors affecting customer satisfaction. 1.6 RESEARCH METHODOLOGY 1. RESEARCH DESIGN In this study research design is Descriptive and exploratory in nature. 2. SAMPLE DESIGN The sampling technique used in the study in convenience sampling. 3. SAMPLE SIZE Customers of Chalakudy Navaratna Hypermarket were selected for the study. The sample size is limited to 50. 4. DATA FOR THE STUDY The data collection pertaining to this study involves both primary and secondary methods. The primary data was collected using a structured questionnaire. The secondary data were collected from internet, organization and from magazines. TOOLS FOR ANALYSIS The collected data analyzed with the help of relevant statistical tools such as percentage analysis, charts and graphs.
  • 5. 5 1.7 LIMITATIONS OF THE STUDY 1. Time limit was the first constraint. 2. Co-operation from customers were limited. 3. Sample size was limited to 50.
  • 6. 6 2. COMPANY PROFILE 2.1 HISTORY A hypermarket store by anatomy, Navaratna offers 365 Days of Ultimate International Shopping Experience and a wide range of home and personal products to choose from, all under a single roof. On April 10, 2010 we set sail on an incredible journey with the inauguration of our first showroom at Ashtamichira, Thrissur. Fast forward to 2016, we now have showrooms at Mala (from July, 2011), Chalakkudy (from May, 2012), Annamanada (from August, 2014), Moonupeedika (from May, 2015) and Kodungalloor (from December, 2015). Through unparalleled customer dedication and support we have chartered our path to excellence, and our legacy is for everyone to see. We strive to fulfill each and every need of our beloved customers and cater to them premium quality products from over a wide variety of categories including home utility products like food, groceries and related commodities, toiletries, kitchenware, bed and bath linen; personal products in beauty and healthcare, ready-mades, garments, footwear, baby products, fitness products and a lot more in the most competitive and affordable prices.
  • 7. 7 2.2 ORGANISATIONAL CHART 2.3 CUSTOMER SERVICES AND FACILITIES  Internationally competitive showrooms with state of the art facilities specifically designed to address each individual‟s needs and priorities.  Products of reputed national and international brands and bountiful stocks of the said products.  Seasonal and festival offers, discounts and free gifts to make your special occasions truly special.  Sales personnel with technical expertise and penchant for making your shopping experience at Navaratna as worthwhile and encouraging as possible. Director Manager A/C Manager Accountant Supervisor Computer operators Workers
  • 8. 8  After sales service of the highest quality and promptness in action and response in case of any complaints from the customer‟s side. 2.4 OBJECTIVES Vision is to serve as many people as possible and in the process are planning on spreading our wings further into the sky. The ethics of Navaratna are ingrained in each and every member of our family and we have pledged to provide selfless service to our customers in every way possible and once again have placed your happiness and satisfaction above everything else.  To provide quality products to customers at reasonable prices.  To create employment opportunities for a large number of people.  To provide an International Shopping Experience and a wide range of home and personal products to choose from, all under a single roof 2.5 COMPANY DETAILS CIN U74999KL2016PTC046288 Company Name NAVARATNA HYPERMARKET PRIVATE LIMITED Company Status Active RoC RoC-Ernakulam Registration Number 46288 Company Category Company limited by Shares Company Sub Category Non-govt company Class of Company Private
  • 9. 9 2.6 LOCATION CHALAKKUDY Navaratna Hypermarket, 25/771B,C,D,E,F,GKavungal Complex, KSRTC Road,Chalakudy, Thrissur – 680307 2.7 COMPANY BRANCHES CHALAKKUDY Navaratna Hypermarket, 25/771B, C,D,E,F,GKavungal Complex, KSRTC Road,Chalakudy, Thrissur - 680307, Mob : +91 8086800185, Ph : 0480 2708500 ANNAMANADA Navaratna Hypermarket, Land Mark Auditorium Building, Near KSRTC Bus stand, Annamanada P.O, Thrissur -680741, Mob : +91 8086800153, Ph :0480 2772277 MOONUPEEDIKA
  • 10. 10 Navaratna Hypermarket, EKS Shopping Complex, Moonnupeedika, Kaipamangalam P.O, Thrissur -680686, Mob : +91 8943345179, Ph :0480 2847284 KODUNGALLUR Navaratna Hypermarket, Mughal Foundation Mall, North Nada Kodungallur P.O, Kodungallur, PIN: 680664, Mob : +91 8943345339, Ph : 0480 2800180 MALA Navaratna Hypermarket XII/785E3 Mala GramaPanchayath Smart Centre, Mala P.O Near Private Bus Stand, Thrissur – 680732 Mob: +91 8086800196 Ph: 0480 2895335 ASHTAMICHIRA Navaratna Hypermarket, Ashtamichira P.O Thrissur -680731 Mob : +91 8943345162 Ph : 0480 28972
  • 11. 11 3. THEORATICAL FRAMEWORK 3.1 WHO IS A CUSTOMER? A customer is an individual or business that purchases the goods or services produced by a business. 3.2 AN INTRODUCTION TO CUSTOMER SATISFACTION  Customer satisfaction Customer satisfaction is the measure of how the needs and responses are collaborated and delivered to excel customer expectation. It can only be attained if the customer has an overall good relationship with the supplier. In today‟s competitive business marketplace, customer satisfaction is an important performance exponent and basic differentiator of business strategies. Hence, the more is customer satisfaction; more is the business and the bonding with customer.Customer satisfaction is a part of customer‟s experience that exposes a supplier‟s behavior on customer‟s expectation. It also depends on how efficiently it is managed and how promptly services are provided. This satisfaction could be related to various business aspects like marketing, product manufacturing, engineering, quality of products and services, responses customer‟s problems and queries, completion of project, post delivery services, complaint management etc. Customer satisfaction is the overall essence of the impression about the supplier by the customers. This impression which a customer makes regarding supplier is the sum total of all the process he goes through, right from communicating supplier before doing any marketing to post delivery options and services and managing queries or complaints post-delivery. During this process the customer comes across working environment of
  • 12. 12 various departments and the type of strategies involved in the organization. This helps the customer to make strong opinion about the supplier which finally results in satisfaction or dissatisfaction. Customer‟s perception on supplier helps the customer choose among the supplier on basis of money value and how well the delivered products suit all the requirements. The supplier‟s services never diminishes after the delivery as customer seeks high values post marketing services which could help them use and customize the delivered product more efficiently. If he is satisfied with the post marketing services then there are good chances for supplier to retain the customers to enhance repeated purchases and make good business profits.  Few definitions of customer satisfaction Kotler (1996) – customer satisfaction is determined by „how well the product meets the customer expectations for that product‟. Bowen and Chen (2001) – “the result of our study supported the contention that there is a positive correlation between loyal customers and profitability”. According to Crompton and Mackay (1989) – “satisfaction is a psychological outcome emerging from an experience”, where the key concepts of an individual customer are concepts of expectations and perceptions that form the degree of customer satisfaction experienced.  Factors effecting customer satisfaction Customer satisfaction is the overall impression of customer about the supplier and the products and services delivered by the supplier. Following are the important factors that could affect customer satisfaction:  Department wise capability of the supplier.
  • 13. 13  Technological and engineering or re-engineering aspects of products and services.  Type and quality of response provided by the supplier.  Supplier‟s capability to commit on deadlines and how efficiently they are met.  Customer service provided by the supplier.  Complaint management.  Cost, quality, performance and efficiency of the product.  Supplier‟s personal facets like etiquettes and friendliness.  Supplier‟s ability to manage whole customer life cycle.  Compatible and hassle free functions and operations. Consumer preference: Consumer preference is a marketing term meaning a consumer likes one thing over another. For instance, a trend may indicate consumers prefer using debit cards over credit cards to pay for goods. All factors which determine the buying or consumer behaviour are broadly classified into six. Psychological factors, Social factors, Cultural factors, Personal factors, Economic factors and Environmental factors. Psychological Factors The following are the important psychological factors: 1) Consumer Needs and Motivation: All buying decisions start with need recognition. People always seek to satisfy their needs. When need is not satisfied it drives people to satisfy that need. Then the need becomes a motive. Thus motive arises from needs and wants. The force that converts needs into motives is called motivation.
  • 14. 14 2) Perception: It is the process of selecting, organizing and interpreting information in order to givemeaning to the world or environment we live in. the way the consumers display selective attention,Distortion or retention motivates marketers to design the product, package, promotional themes etc. The marketers should understand the consumer perception and convert perception into a buying response. 3) Learning: Learning is the process of acquiring knowledge. Generally, learning results in four ways-Listening, Reading, Observing and experiencing. The importance of learning theory for marketers is that they can create demand for a product by associating it with strong drives, using motivating cues and providing positive reinforcement. 4) Belief and Attitude: A belief is a descriptive thought that a person holds about something. Such thoughts are based on learning, opinion or faith. For example, A consumer believes that Maruti cars are less costly and fuel efficient. Attitude means a person‟s feelings towards a particular object or situation. Social Factors The major social factors are as follows Reference Group: consumer behaviour is influenced by various groups within society known as reference groups. We have several reference groups with whom an individual associate such as friends, relatives, classmates, club memberships etc. In each groups there is an opinion leader whose style is adopted by others. Marketers often identify such opinion leaders and develop advertisement featuring them as endorsers. WHY CUSTOMER SATISFACTION IS SO IMPORTANT? Why is it that we can think of more examples of companies failing to satisfy us rather than when we have been satisfied? There could be a
  • 15. 15 number of reasons for this. When we buy a product or service, we expect it to be right. We don‟t jump up and down with glee saying “isn‟t it wonderful, it actually worked”. This is what we paid our money for. Add to this our world of ever exacting standards. We now have products available to us that would astound our great grandparents and yet we quickly become used to them. The bar is getting higher and higher. At the same time our lives are ever more complicated with higher stress levels. Delighting customers and achieving high customer satisfaction scores in this environment is ever more difficult. And even if your customers are completely satisfied with your product or service, significant chunks of them could leave you and start doing business with your competition A market trader has a continuous finger on the pulse of customer satisfaction. Direct contact with customers indicates what he is doing right or where he is going wrong. Such informal feedback is valuable in any company but hard to formalize and are necessary to measure and track customer satisfaction. Developing a customer satisfaction programme is not just about carrying out a customer service survey. Surveys provide the reading that shows where attention is required but in many respects, this is the easy part. Very often, major long lasting training of the staff, possibly involving cultural change. The result should be financially beneficial with less customer churn, higher market shares, premium prices, stronger brands and reputation, and happier staff. However, there is a price to pay for these improvements. Costs will be incurred in the market research survey. Time will be spent working out an action plan. Training may well be required to improve the customer service. The implication of customer satisfaction surveys go far beyond the survey itself and will only be successful if fully supported by the echelons of senior management.
  • 16. 16 There are six parts to any customer satisfaction programme: 1. Who should be interviewed? 2. What should be measured? 3. How should the interview be carried out? 4. How should satisfaction be measured? 5. What do the measurements mean? 6. How to use customer satisfaction surveys to greatest effect? HOW SHOULD SATISFACTION BE MEASURED? Customers express their satisfaction in many ways. When they are satisfied, they mostly say nothing but return again and again to buy or use more. When asked how they feel about a company or its products in open-ended questioning they respond with anecdotes and may use terminology such as delighted, extremely satisfied, very dissatisfied etc. Collecting the motleys variety of adjectives together from open ended responses would be problematical in a large survey. To overcome this problem market researchers ask people to describe a company using verbal or numeric sales with words that measure attitudes. People are used to the concept of rating things with numerical scores and these can work well in surveys. Once the respondent has been given the anchors of the scale, they can readily give a number to express their level of satisfaction. Typically, scales of 5, 7 or 10 are used where the lowest figure indicates extreme dissatisfaction and the highest shows extreme satisfaction. The stem of the scale is usually quite short since a scale of up to 100 would prove too demanding for rating the dozens of specific issues that are often on the questionnaire. Measuring satisfaction is only half the story. It is also necessary to determine customer‟s expectations or the importance they attach to the different attributes, otherwise resources could be spent raising satisfaction
  • 17. 17 levels of things that do not matter. The measurement of expectations or importance is more difficult than the measurement of satisfaction. Many people do not know or cannot admit, even to themselves, what is important. Customers do not spend their time rationalizing why they do things, their views change and they may not be able to easily communicate or admit to the complex issues in the buying argument. The same Interval scales of words or numbers are often used to measure importance- 5, 7 or 10 being very important and I being not at all important and I being not at all important. However, most of the issues being researched are of some importance for otherwise they would not be considered in the study. As a result, the mean scores on importance may show little differentiation between the vital issues such as knowledgeable representatives and long opening hours. Ranking can indicate the importance of a small list of up to six or seven factors but respondents struggle to place things in rank order once the first four or five are out of the way. It would not work four determining the importance of 30 attributes. As a check against factors that are given a “stated importance” score, researchers can statistically calculate (or “device”) the importance of the same issues. Derived importance is calculated by correlating the satisfaction levels of each attribute with the overall level of satisfaction. Where there is a high link or correlation with an attribute, it can be inferred that the attribute is driving customer satisfaction. Deriving the importance of attributes can show the greater influence of softer issues such as the friendliness of the staff or the power of the brand – things that people somehow cannot rationalize or admit to in a “stated” answer.
  • 18. 18 DEVELOPING AN ACTION PLAN THAT RECTIFIES THE WEAKNESSES AND BUILDS ON THE STRENGTHS The purpose of customer satisfaction research is to improve customer satisfaction and yet so often surveys sit collecting dust. Worse than that, customers have generously given their time to assist in the customer service survey believing that some positive action will take place. Their expectations will have been raised. The process of collecting the data seems easier than taking action to improve satisfaction levels. In any customer satisfaction survey there will be quick fixes – actions that can be taken today or tomorrow that will have immediate effect. These could be quite information. In the longer term, cultural changes may well be required to improve customer satisfaction, and that is more difficult. A five-step process can be used to make these longer-term improvements. 5 step process to make longer -term improvements Spot The Gap Challenge & Redefine The Segmentation Challenge & Redefine The CVP Create An Action Plan Measurement & Improvement
  • 19. 19 Step 1: Spot the gap  Look at the customer satisfaction data to see where there are low absolute scores and low scores relative to competition.  Pay particular attention to those issues that are important to customers.  Assumes the scores are correct unless there is irrefutable evidence to the contrary and remember, perceptions are reality. Step 2:Challenge and redefine the segmentation  How do satisfaction scores vary across different types of customer?  Are segments correctly defined in the light of the customer satisfaction findings?  How could a change in segmentation direct the offer more effectively and so achieve higher levels of satisfaction? Step 3: Challenge and redefine the customer value propositions.  Are customer satisfactions scores low because the customer value proposition (CVP) is not being communicated effectively to the market?  Are customer satisfactions scores low because the CVP is not being effectively implemented?  Is the CVP right for the segment? How could a change in CVP achieve a higher customer satisfaction index (CSI)? Step 4: Create an action plan  Describe the problem.  Think through the issues that need to be addressed and list them out.  Identify the root cause of the problems.  Identify any barriers that could stop the improvement taking place.  Set measurable targets.
  • 20. 20  Allocated resources (usually money and people)  Assign people and time scales to the tasks.  Measure and review progress Step 5: Measure and review  How has the customer satisfaction index (CSI) moved?  Is the movement significant/real?  Has the action recommended in the plan, taken place? Has it been enough? Has it had enough time to work?  Revisit the step – spot the gap, challenge the segmentation and CVP, more action When the survey results are available, they should be shared with the same groups that were involved right at the beginning. Workshops are an excellent environment for analyzing the survey findings and driving through action planning. These are occasions when the survey data can be made user friendly and explained so that it is moved from something that has been collected and owned by the researcher to something that is believed in and found useful by the people that will have to implement the changes As with all good action planning, the workshops should deliver mutually agreed and achievable goals, assigned to people who can make things happen, with dates for achievements and rewards for success. Training may well be required to ensure that employees know how to handle customer service issues and understand which tools to use in various situations. Finally, there should be a constant review of the process as improving customer satisfaction is a race that never ends.
  • 21. 21 Table 4.1 Shows the characteristics which influence the customer to prefer this shop. Category No. of respondents Percentage Promotion 0 0 Price 4 8 Quality 37 74 Convenience 9 18 TOTAL 50 100 Diagram 4.1 Showing the characteristic which influence the customer to prefer the shop. Interpretation: Above diagram shows that 74% of the respondent prefer the shop because of the quality, 8% are influenced by price and the remaining 18% prefer the shop because of their convenience. 0% 10% 20% 30% 40% 50% 60% 70% 80% Promotion Price Quality Convenience
  • 22. 22 Table 4.2 Showing different kind of services provided by Navaratna Hypermarket that attracted the customer the most. Category No. of respondents Percentage Services provided by sales man 20 40 Parking Facility 10 20 Payment Modes 8 16 Product Selection 12 24 TOTAL 50 100 Diagram 4.2 Showing the services provided by Navaratna Hypermarket for attracting customers. Interpretation: Above diagram shows that 40% of the respondents are attracted by service provided by the salesman, 20% are influenced by parking facility, 16% are attracted by payment modes and the remaining 24% are influenced by product selection. 0% 5% 10% 15% 20% 25% 30% 35% 40% 45% Services provided by sales man Parking Facility Payment Modes Product Selection
  • 23. 23 Table 4.3 Showing the advertisement media that influenced customers to prefer the shop. Diagram 4.3 Showing the advertisement media that influenced customer to prefer the shop. Interpretation: Above diagram shows that 86% of the respondent are attracted by word of mouth, 6% are influenced through Newspapers and the 2% are influenced by each TV and banners. 0% 10% 20% 30% 40% 50% 60% 70% 80% 90% 100% TV Newspapers Banners Word of mouth Category No. of respondents Percentage TV 2 4 Newspapers 3 6 Banners 2 4 Word of mouth 43 86 TOTAL 50 100
  • 24. 24 Table 4.4 Showing frequency of consuming goods from the shop. Category No. of respondents Percentage Daily 3 6 Weekly 20 40 Monthly 26 52 Quarterly 1 2 TOTAL 50 100 Diagram 4.4 Showing the frequency of consuming goods from the shop. Interpretation: Above diagram shows that 52% of respondent are coming to the shop monthly. 40% of respondents visit this shop monthly, 6% of respondents are coming to the shop daily and the remaining 2% visit this shop quarterly. 0% 10% 20% 30% 40% 50% 60% Daily Weekly Monthly Quaterly
  • 25. 25 Table 4.5 Showing the rating of customers towards the general ambience, design and feel of the shop. Category No. of respondents Percentage Excellent 13 26 Very good 23 46 Average 13 26 Poor 1 2 TOTAL 50 100 Diagram 4.5 Showing the rating of customers towards the general ambience, design and feel of the shop. Interpretation: From above diagram it is clear that 26% of respondents opinion about the general ambience of the shop as excellent. 46% is of the opinion as very good and 26% are of the opinion of average. The remaining respondents are of the opinion that it‟s poor. 0% 5% 10% 15% 20% 25% 30% 35% 40% 45% 50% Excellent Very good Average Poor
  • 26. 26 Table 4.6 Showing the rating of quality of product in Navaratna Hypermarket. Category No. of respondents Percentage Excellent 11 22 Very good 28 56 Average 11 22 Poor 0 0 TOTAL 50 100 Diagram 4.6 Showing the rating of quality of product in Navaratna Hypermarket. Interpretation: From the diagram it is clear that 22% of respondents rate the quality product as excellent. 56% of respondents are of very good opinion and 22% tells that it is average. 0% 10% 20% 30% 40% 50% 60% Excellent Very good Average Poor
  • 27. 27 Table 4.7 Showing the rating of customers towards the hospitality received in the shop. Category No. of respondents Percentage Excellent 6 12 Very good 25 50 Average 16 32 Poor 3 6 TOTAL 50 100 Diagram 4.7 Showing the rating of customers towards the hospitality received in the shop. Interpretation: From the diagram it is clear that 12% of respondents rate the hospitality received as excellent. 50% of respondents are of the opinion that it is good and 32% have an average opinion. The remaining 6% of respondents are telling that it is poor. 0% 10% 20% 30% 40% 50% 60% Excellent Very good Average Poor
  • 28. 28 Table 4.8 Shows the dissatisfaction experienced by the consumers in the shop. Category No. of respondents Percentage High price 12 24 Expired products 2 4 Poor service 1 2 No dissatisfaction 35 70 TOTAL 50 100 Diagram 4.8 Shows the dissatisfaction experienced by the consumer. Interpretation: Above diagram shows that 24% of consumers shows dissatisfaction due to high priced product, 4% shows dissatisfaction because of expired products, 2% shows dissatisfaction due to poor service and 70% are not dissatisfied. 0% 10% 20% 30% 40% 50% 60% 70% 80% High price Expired products Poor service No dissatisfaction
  • 29. 29 Table 4.9 Shows the current strength of the outlet in market. Category No. of respondents Percentage Excellent 9 18 Very good 30 60 Average 11 22 Poor 0 0 TOTAL 50 100 Diagram 4.9 Shows the current strength of the outlet in the market. Interpretation: Above diagram shows that 18% of the respondents are of the opinion that the current strength of the outlet in the market is excellent. 60% are of the opinion that it is very good and 22% as average. 0% 10% 20% 30% 40% 50% 60% 70% Excellent Very good Average Poor
  • 30. 30 Table 4.10 Shows the behavior of the sales people. Category No. of respondents Percentage Extremely satisfied 5 10 Satisfied 38 76 Dissatisfied 7 14 TOTAL 50 100 Diagram 4.10 Shows the behavior of the sales people. Interpretation: Above diagram shows that 76% respondents are satisfied with behavior of sales people. 14% are dissatisfied with behavior of sales people, remaining 10% of respondents are extremely satisfied. 0% 10% 20% 30% 40% 50% 60% 70% 80% Extremely satisfied Satisfied Dissatisfied
  • 31. 31 Table 4.11 Showing the type of scheme affecting the buying behavior of customers. Category No. of respondents Percentage Discount 19 38 Free Offers 11 22 Coupons 5 22 Others 15 30 TOTAL 50 100 Diagram 4.11 Showing the type of scheme affecting the buying behavior of customers. Interpretation: Above diagram shows that 38% of the respondent buying behaviors are affected by discounts, 22% are influenced by free offers and 10% are influenced by coupons. The remaining 30% are influenced by others. 0% 5% 10% 15% 20% 25% 30% 35% 40% Discount Free Offers Coupons Others
  • 32. 32 Table 4.12 Showing the opinion about varieties of offer provided by the shop. Category No. of respondents Percentage Excellent 6 12 Very good 24 48 Average 16 32 Poor 4 8 TOTAL 50 100 Diagram 4.12 Showing the opinion about varieties of offers provided by the shop. Interpretation: Above diagram shows 12% consumers rate the varieties of offers provided as excellent, 48% as good, 32% as fair and 8% as poor. 0% 10% 20% 30% 40% 50% 60% Excellent Good Fair Poor
  • 33. 33 Table 4.13 Shows the range of products available in the shop. Category No. of respondents Percentage Large range 19 38 Average range 30 60 Low range 1 2 TOTAL 50 100 Diagram 4.13 Shows the range of products available in the shop. Interpretation: Above diagram shows 38% of products are available in large range, 60% of products are of average range and 2% are of low range. 0% 10% 20% 30% 40% 50% 60% 70% Large range Average range Low range
  • 34. 34 Table 4.14 Shows the freebies provided to the customers. Category No. of respondents Percentage Always 15 30 Often 28 56 Never 7 14 TOTAL 50 100 Diagram 4.14 Shows the freebies being provided to the customers. Interpretation: Above diagram shows 30% of customers always get freebies, 56% get freebies often and 14% never get freebies. 0% 10% 20% 30% 40% 50% 60% Always Often Never
  • 35. 35 Table 4.15 Shows the rating of services provided by the Navaratna Hypermarket, coffee shop. Diagram 4.15 Shows the rating of services provided in Navaratna Hypermarket, coffee shop. Interpretation: Above diagram shows that 10% of customers rate the services provided by the coffee shop as excellent, 62% as very good, 20% as average and 8% as poor. 0% 10% 20% 30% 40% 50% 60% 70% Excellent Very good Average Poor Category No. of respondents Percentage Excellent 5 10 Very good 31 62 Average 10 20 Poor 4 8 TOTAL 50 100
  • 36. 36 4.1 FINDINGS  74% of customers are influenced by quality of the products.  40% of the customers were attracted by the services provided by the salesmen.  About 86% of the customers are of the opinion that they came to the shop only by word of mouth.  About 52% of the customers shop monthly from this hypermarket.  From the survey it was found that about 46% of the customers feel that the general ambience design and feel of the shop is very good.  As per the survey it was clear that 56% of the customers feel that they have met their requirements and expectations regarding quality.  About 50% of the customers feel that the hospitality received in hypermarket is very good.  The survey shows that 70% of the customers haven‟t experienced any dissatisfaction.  As per the survey 60% of the customers feel that the current strength of this outlet in the market is very good.  As per the survey we can understand that 76% of the customers are satisfied with the behavior of the sales people.  From the survey it was found that 38% of customers are enlightened by discount scheme  48% of the customers feel that the offers provided by the hypermarket are good.  About 60% of the customers feel that the range of the product available here in average.  From the survey it was found that 56% of the customers are provided with freebies.  Around 62% of the customers feel that the services provided in Navaratna , like coffee shop is very good.
  • 37. 37 4.2SUGGESTIONS  The management should introduce more free offers.  The management should try to improve their services like payment modes.  The range of the products provided to the customers must be increased.  Freebies must always be provided to customers. 4.3 CONCLUSION The project was done to know the “CUSTOMER SATISFACTION AT NAVARATNAHYPERMARKET, CHALAKUDY”. On the basis of 50 samples of respondents, detailed analysis was made. Based on the data collected, inferences are drawn and findings are suggestions were given. The motto of the organization is to provide quality products at reasonable price and to satisfy their customers. From the survey it was found that the materials provided and the services of Navaratna hypermarkets are very good. Though most of the customers are satisfied with the services, there are certain areas which need special attention. Managers must see to it that, the problems faces by the customer are solved.
  • 38. 38 CUSTOMER SATISFACTION QUESTIONNAIRE Customer Name: Signature: ………… Address : Date : ………… We would be grateful if you could spare a few minutes to complete this questionnaire to help us to ensure that Navaratna Hypermarket standard of customer care exceeds expectations wherever possible. Please tick appropriate boxes to indicate your opinion. 1. Which characteristic‟s stated below influenced your preference in the shop? ☐Promotion ☐Price ☐Quality ☐Convenience 2. What kind of service provided by Navaratna Hypermarket attracted you the most? ☐Service provided by Sales man ☐Parking facility ☐Payment modes 3. Which advertising media influence you to prefer this shop? ☐TV ☐Newspapers ☐Banners ☐Self interest 4. Your frequency of shopping from this shop? ☐Daily ☐Weekly
  • 39. 39 ☐Monthly 5. How do you rate the quality, general ambience, design and the feel of the shop ☐Excellent ☐Very good ☐Average ☐Poor 6. How do you rate the quality of products in Navaratna and did they meet your requirements and expectations? ☐Excellent ☐Very good ☐Average ☐Poor 7. How do you rate the hospitality that you received in the shop? ☐Excellent ☐Very good ☐Average ☐Poor 8. What sort of dissatisfaction do you experience in the shop? ☐High price ☐Expired products ☐No dissatisfaction 9. As per your opinion, what is the current strength of this outlet in the market? ☐Excellent ☐Very good ☐Average ☐Poor 10. Are you satisfied with the behavior of sales people?
  • 40. 40 ☐Extremely satisfied ☐Satisfied ☐Dissatisfied 11. Which type of scheme affects your buying behavior? ☐Discount ☐Free offers ☐Coupons ☐Others 12. How would you describe variety of offers? ☐Excellent ☐Good ☐Fair ☐Poor 13. Range of the product available here? ☐Large range ☐Average range ☐Low range 14. Are the freebies being provided to the customers? ☐Always ☐Often ☐Never 15. How do you rate services provided in the Navaratna like coffee shop? ☐Excellent ☐Very good ☐Average ☐Poor