
Recommended
Recommended
More Related Content
What's hot
What's hot (19)
Similar to A Review of Elastic Search: Performance Metrics and challenges
Similar to A Review of Elastic Search: Performance Metrics and challenges (20)
More from rahulmonikasharma
More from rahulmonikasharma (20)
Recently uploaded
Recently uploaded (20)
A Review of Elastic Search: Performance Metrics and challenges
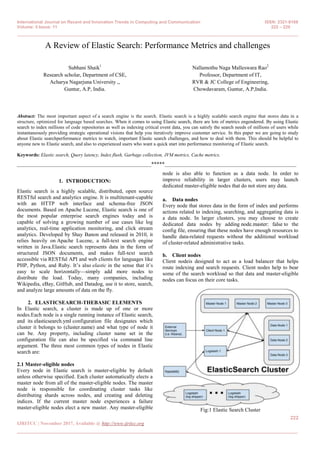
- 1. International Journal on Recent and Innovation Trends in Computing and Communication ISSN: 2321-8169 Volume: 5 Issue: 11 222 – 229 _______________________________________________________________________________________________ 222 IJRITCC | November 2017, Available @ http://www.ijritcc.org _______________________________________________________________________________________ A Review of Elastic Search: Performance Metrics and challenges Subhani Shaik1 Research scholar, Department of CSE, Acharya Nagarjuna University ,, Guntur, A.P, India. Nallamothu Naga Malleswara Rao2 Professor, Department of IT, RVR & JC College of Engineering, Chowdavaram, Guntur, A.P,India. Abstract: The most important aspect of a search engine is the search. Elastic search is a highly scalable search engine that stores data in a structure, optimized for language based searches. When it comes to using Elastic search, there are lots of metrics engendered. By using Elastic search to index millions of code repositories as well as indexing critical event data, you can satisfy the search needs of millions of users while instantaneously providing strategic operational visions that help you iteratively improve customer service. In this paper we are going to study about Elastic searchperformance metrics to watch, important Elastic search challenges, and how to deal with them. This should be helpful to anyone new to Elastic search, and also to experienced users who want a quick start into performance monitoring of Elastic search. Keywords: Elastic search, Query latency, Index flush, Garbage collection, JVM metrics, Cache metrics. __________________________________________________*****_________________________________________________ 1. INTRODUCTION: Elastic search is a highly scalable, distributed, open source RESTful search and analytics engine. It is multitenant-capable with an HTTP web interface and schema-free JSON documents. Based on Apache Lucene, Elastic search is one of the most popular enterprise search engines today and is capable of solving a growing number of use cases like log analytics, real-time application monitoring, and click stream analytics. Developed by Shay Banon and released in 2010, it relies heavily on Apache Lucene, a full-text search engine written in Java.Elastic search represents data in the form of structured JSON documents, and makes full-text search accessible via RESTful API and web clients for languages like PHP, Python, and Ruby. It’s also elastic in the sense that it’s easy to scale horizontally—simply add more nodes to distribute the load. Today, many companies, including Wikipedia, eBay, GitHub, and Datadog, use it to store, search, and analyze large amounts of data on the fly. 2. ELASTICSEARCH-THEBASIC ELEMENTS In Elastic search, a cluster is made up of one or more nodes.Each node is a single running instance of Elastic search, and its elasticsearch.yml configuration file designates which cluster it belongs to (cluster.name) and what type of node it can be. Any property, including cluster name set in the configuration file can also be specified via command line argument. The three most common types of nodes in Elastic search are: 2.1 Master-eligible nodes Every node in Elastic search is master-eligible by default unless otherwise specified. Each cluster automatically elects a master node from all of the master-eligible nodes. The master node is responsible for coordinating cluster tasks like distributing shards across nodes, and creating and deleting indices. If the current master node experiences a failure master-eligible nodes elect a new master. Any master-eligible node is also able to function as a data node. In order to improve reliability in larger clusters, users may launch dedicated master-eligible nodes that do not store any data. a. Data nodes Every node that stores data in the form of index and performs actions related to indexing, searching, and aggregating data is a data node. In larger clusters, you may choose to create dedicated data nodes by adding node.master: false to the config file, ensuring that these nodes have enough resources to handle data-related requests without the additional workload of cluster-related administrative tasks. b. Client nodes Client nodeis designed to act as a load balancer that helps route indexing and search requests. Client nodes help to bear some of the search workload so that data and master-eligible nodes can focus on their core tasks. Fig:1 Elastic Search Cluster
- 2. International Journal on Recent and Innovation Trends in Computing and Communication ISSN: 2321-8169 Volume: 5 Issue: 11 222 – 229 _______________________________________________________________________________________________ 223 IJRITCC | November 2017, Available @ http://www.ijritcc.org _______________________________________________________________________________________ 3. ELASTICSEARCHDATA ORGANIZATION In Elasticsearch, interrelated data is stored in the same index thatcontains a set of related documents in JSON format. Elasticsearch’s secret sauce for full-text search is Lucene’s inverted index. When a document is indexed, Elasticsearch automatically creates an inverted index for each field; the inverted index maps terms to the documents that contain those terms.An index is stored across one or more primary shards, and zero or more replica shards, and each shard is a complete instance of Lucene, like a mini search engine. When creating an index, we can specify the number of primary shards, as well as the number of replicas per primary. The defaults are five primary shards per index, and one replica per primary. The number of primary shards cannot be changed once an index has been created. The number of replicas can be updated later on as needed. To protect against data loss, the master node ensures that each replica shard is not allocated to the same node as its primary shard. Fig:2 Elastic search data rganization 4. 4. ELASTIC SEARCH PERFORMANCE METMETRICS : Elasticsearch provides plenty of metrics to detect problems like unreliable nodes, out-of-memory errors, and long garbage collection times. All these metrics are accessible via Elasticsearch’s API as well as single-purpose monitoring tools like Elastic’s Marvel and universal monitoring services like Datadog. 4.1Search and indexing performance In Elasticsearch we have two types of requests, the search requests and index requests which aresimilar to read and write requests in a traditional database system. 4.1.1 Search Request: Client sends a search request to Node 2 The coordinating node, Node 2 sends the query to a copy of every shard in the index. Each shard executes the query locally and delivers results to Node 2. Node 2 sorts and compiles them into a global priority queue. Node 2 finds out which documents need to be fetched and sends a multi GET request to the relevant shards.5. Each shard loads the documents and returns them to Node 2. Node 2 delivers the search results to the client. Figure 3: Processing of Search Request If search is a customer-facing feature you should monitor query latency and take action if it surpasses a threshold. It’s important to monitor relevant metrics about queries and fetches that can help you determine how your searches perform over time. For example, you may want to track spikes and long-term increases in query requests, so that you can be prepared to tweak your configuration to optimize for better performance and reliability. Search performance metrics Query load: Monitoring the number of queries currently in progress can give you a rough idea of how many requests your cluster is dealing with at any particular moment in time. Consider alerting on unusual spikes or dips that may point to underlying problems. You may also want to monitor the size of the search thread pool queue. Query latency: Though Elasticsearch does not explicitly provide this metric, monitoring tools can help you use the available metrics to calculate the average query latency by sampling the total number of queries and the total elapsed time at regular intervals. Set an alert if latency exceeds a threshold, and if it fires, look for potential resource bottlenecks, or investigate whether you need to optimize your queries. Fetch latency: The fetch phase, should typically take much less time than the query phase. If this metric isconstantly increasing, this could indicate a problem with slow disks, enriching of documents (highlighting relevant text in search results, etc.), or requesting too many results. 4.1.2 Index Requests Indexing requests are similar to write requests in a traditional database system. If your Elasticsearch workload is write- heavy, it’s important to monitor and analyze how effectively you are able to update indices with new information. When new information is added to an index, or existing information is updated or deleted, each shard in the index is updated via two processes: refresh and flush. Index refresh Newly indexed documents are not immediately made available for search. First they are written to an in-memory buffer where they await the next index refresh, which occurs once per
- 3. International Journal on Recent and Innovation Trends in Computing and Communication ISSN: 2321-8169 Volume: 5 Issue: 11 222 – 229 _______________________________________________________________________________________________ 224 IJRITCC | November 2017, Available @ http://www.ijritcc.org _______________________________________________________________________________________ second by default. The refresh process creates a new in- memory segment from the contents of the in-memory buffer (making the newly indexed documents searchable), then empties the buffer, as shown below. Figure 4. The index refresh process Shards of an index are composed of multiple segments. The core data structure from Lucene, a segment is essentially a change set for the index. These segments are created with every refresh and subsequently merged together over time in the background to ensure efficient use of resources. Each segment uses file handles, memory, and CPU. Segments are mini-inverted indices that map terms to the documents that contain those terms. Every time an index is searched, a primary or replica version of each shard must be searched by, in turn, searching every segment in that shard. A segment is immutable, so updating a document means: writing the information to a new segment during the refresh process marking the old information as deleted The old information is eventually deleted when the outdated segment is merged with another segment. Index flush When the newly indexed documents are added to the in- memory buffer, they are also appended to the shard’s translog: a persistent, write-ahead transaction log of operations. Whenever the translog reaches a maximum size which is 512MB by default, a flush is triggered. During a flush, any documents in the in-memory buffer are refreshed (stored on new segments), all in-memory segments are committed to disk, and the translog is cleared. The translog helps prevent data loss in the event that a node fails. It is designed to help a shard recover operations that may otherwise have been lost between flushes. The log is committed to disk every five seconds, or upon each successful index, delete, update, or bulk request, whichever occurs first. Figure: 5The index flush process Indexing Performance Metrics Elasticsearch provides a number of metrics to assess indexing performance and to optimize update your indices. Indexing latency: Monitoring tools can help to calculate the average indexing latency from the available index_total and index_time_in_millis metric s. If the latency is increasing, user is trying to index too many documents at one time.To index a lot of documents without new information to be immediately available for search, you can optimize for indexing performance over search performance by decreasing refresh frequency until you are done indexing. Flush latency: Because data is not persisted to disk until a flush is successfully completed, it can be useful to track flush latency and take action if performance begins to take a dive. If this metric is increasing steadily, it could indicate a problem with slow disks; this problem may escalate and eventually prevent from being able to add new information to index. 4.2 Memory usage and garbage collection Memory is one of the key resources when running Elasticsearch. Elasticsearch and Lucene utilize all of the available RAM on your nodes in two ways: JVM heap and the file system cache. Elasticsearch runs in the Java Virtual Machine (JVM), which means that JVM garbage collection duration and frequency will be other important areas to monitor. JVM heap: Elasticsearch stresses the importance of a JVM heap size. In general, Elasticsearch’s rule of thumb is allocating less than 50 percent of available RAM to JVM heap, and never going higher than 32 GB. The less heap memory you allocate to Elasticsearch, the more RAM remains available for Lucene, which relies heavily on the file system cache to serve requests quickly. If the heap size is too small we may get out-of-memory errors or reduced throughput as the application faces constant short pauses from frequent garbage collections. Elasticsearch’s default installation sets a JVM heap size of 1 gigabyte, which is too small for most use cases. The other option is to set the JVM heap size (with equal minimum and maximum sizes to prevent
- 4. International Journal on Recent and Innovation Trends in Computing and Communication ISSN: 2321-8169 Volume: 5 Issue: 11 222 – 229 _______________________________________________________________________________________________ 225 IJRITCC | November 2017, Available @ http://www.ijritcc.org _______________________________________________________________________________________ the heap from resizing) on the command line every time you start up Elasticsearch: Garbage collection Elasticsearch relies on garbage collection processes to free up heap memory. Because garbage collection uses resources in order to free up resources, you need to adjust the heap size. Setting the heap too large can result in long garbage collection times; these excessive pauses are dangerous because they can lead your cluster to mistakenly register your node as having dropped off the grid. JVM metrics JVM heap in use: Elasticsearch is set up to initiate garbage collections whenever JVM heap usage hits 75 percent. As shown above, it may be useful to monitor which nodes exhibit high heap usage, and set up an alert to find out if any node is consistently using over 85 percent of heap memory; this indicates that the rate of garbage collection isn’t keeping up with the rate of garbage creation. To address this problem, you can either increase your heap size (as long as it remains below the recommended guidelines stated above), or scale out the cluster by adding more nodes. JVM heap used vs. JVM heap committed: It can be helpful to get an idea of how much JVM heap is currently in use, compared to committed memory (the amount that is guaranteed to be available). The amount of heap memory in use will typically take on a sawtooth pattern that rises when garbage accumulates and dips when garbage is collected. If the pattern starts to skew upward over time, this means that the rate of garbage collection is not keeping up with the rate of object creation, which could lead to slow garbage collection times and, eventually, OutOfMemoryErrors. Garbage collection duration and frequency: Both young- and old-generation garbage collectors undergo ―stop the world‖ phases, as the JVM halts execution of the program to collect dead objects. During this time, the node cannot complete any tasks. Because the master node checks the status of every other node every 30 seconds, if any node’s garbage collection time exceed 30 seconds, it will lead the master to believe that the node has failed. Memory usage Elasticsearch makes excellent use of any RAM that has not been allocated to JVM heap. Elasticsearch was designed to rely on the operating system’s file system cache to serve requests quickly and reliably.A number of variables determine whether or not Elasticsearch successfully reads from the file system cache. If the segment file was recently written to disk by Elasticsearch, it is already in the cache. However, if a node has been shut off and rebooted, the first time a segment is queried, the information will most likely have to be read from disk. This is one reason why it’s important to make sure your cluster remains stable and that nodes do not crash.Generally, it’s very important to monitor memory usage on your nodes, and give Elasticsearch as much RAM as possible, so it can leverage the speed of the file system cache without running out of space. 4.3 Host-level network and system metrics Host metrics to alert on Disk space: This metric is significant if Elasticsearch cluster is write-heavy. To insert or update anything we need a sufficient disk space otherwise the node will fail. If less than 20 percent is available on a node, use a tool like Curator to delete certain indices residing on that node that are taking up too much valuable disk space. Other alternative is to add more nodes, and let the master take care of automatically redistributing shards across the new nodes. Host metrics to watch I/O utilization: Elasticsearch does a lot of writing to and reading from disk when segments are created, queried, and merged, For write-heavy clusters with nodes that are frequently experiencing heavy I/O activity, Elasticsearch recommends using SSDs to boost performance. CPU Utilization: Increase in CPU usage is usually caused by a heavy search or indexing workload. Set up a notification to find out if your nodes’ CPU usage is consistently increasing, and add more nodes to redistribute the load if needed. Network bytes sent/received: Communication between nodes is a key component of a balanced cluster. Elasticsearch provides transport metrics about cluster communication. Open file descriptors: File descriptors are used for node-to- node communications, client connections, and file operations. If this number reaches your system’s max capacity, then new connections and file operations will not be possible until old ones have closed. HTTP connections Requests sent in any language but Java will communicate with Elastic search using RESTful API over HTTP. If the total number of opened HTTP connections is constantly increasing, it could indicate that your HTTP clients are not properly establishing persistent connections. Reestablishing connections adds extra milliseconds or even seconds to your request response time. Make sure your clients are configured properly to avoid negative impact on performance, or use one of the official Elasticsearch clients, which already properly configure HTTP connections. 4.4 Cluster health and node availability Cluster status: If the cluster status is yellow, at least one replica shard is unallocated or missing. Search results will still be complete, but if more shards disappear, you may lose data.If the cluster status is red, at least one primary shard is missing, and you are missing data, which means that searches will return partial results. You will also be blocked from indexing into that shard. Consider setting up an alert to trigger if status has been yellow for more than 5 min or if the status has been red for the past minute. Initializing and unassigned shards When you first create an index, or when a node is rebooted, its shards will briefly be in an ―initializing‖ state before transitioning to a status of ―started‖ or ―unassigned‖, as the master node attempts to assign shards to nodes in the cluster. If shards remain in an
- 5. International Journal on Recent and Innovation Trends in Computing and Communication ISSN: 2321-8169 Volume: 5 Issue: 11 222 – 229 _______________________________________________________________________________________________ 226 IJRITCC | November 2017, Available @ http://www.ijritcc.org _______________________________________________________________________________________ initializing or unassigned state too long, it could be a warning sign that the cluster is unstable. 4.5 Resource saturation and errors Elasticsearch nodes use thread pools to manage how threads consume memory and CPU. Since thread pool settings are automatically configured based on the number of processors, it usually doesn’t make sense to tweak them. If the nodes are not able to keep up we can add more nodes to handle all of the concurrent requests. Fielddata and filter cache usage is another area to monitor, as evictions may point to inefficient queries or signs of memory pressure. Thread pool queue and rejections Each node maintains many types of thread pools; The most important nodes to monitor are search, index, merge, and bulk.The size of each thread pool’s queue represents how many requests are waiting to be served while the node is currently at capacity. The queue allows the node to track and eventually serve these requests instead of discarding them. Thread pool rejections arise once the thread pool’s maximum queue size is reached. Metrics to watch Thread pool queues : Large queues are not ideal because they use up resources and also increase the risk of losing requests if a node goes down. If you see the number of queued and rejected threads increasing steadily, you may want to try slowing down the rate of requests (if possible), increasing the number of processors on your nodes, or increasing the number of nodes in the cluster. As shown in the screenshot below, query load spikes correlate with spikes in search thread pool queue size, as the node attempts to keep up with rate of query requests. Fig:6.Thread pool queues Bulk rejections and bulk queues: Bulk rejections are usually related to trying to index too many documents in one bulk request. Bulk operations are a more efficient way to send many requests at one time. Generally, if you want to perform many actions like create an index, or add, update, or delete documents, you should try to send the requests as a bulk operation instead of many individual requests. Cache usage metrics Each query request is sent to every shard in an index, which then hits every segment of each of those shards. Elastic search caches queries on a per-segment basis to speed up response time. If caches hog too much of the heap, they may slow things down instead of speeding them up. In Elastic search, each field in a document can be stored in one of two forms: as an exact value or as full text. An exact value, such as a timestamp or a year, is stored exactly the way it was indexed because you do not expect to receive to query 1/1/16 as ―January 1st, 2016.‖ If a field is stored as full text, that means it is analyzed—basically, it is broken down into tokens, and, depending on the type of analyzer, punctuation and stop words like ―is‖ or ―the‖ may be removed. The analyzer converts the field into a normalized format that enables it to match a wider range of queries. Elastic search uses two main types of caches to serve search requests more quickly: fielddata and filter. Fielddata cache The fielddata cache is used when sorting or aggregating on a field, a process that basically has to uninvent the inverted index to create an array of every field value per field, in document order. Filter cache Filter caches also use JVM heap. Elastic search automatically cached filtered queries with a max value of 10 percent of the heap, and evicted the least recently used data. Elastic search automatically began optimizing its filter cache, based on frequency and segment size (caching only occurs on segments that have fewer than 10,000 documents or less than 3 percent of total documents in the index). Cache metrics to watch Fielddata cache evictions: Ideally, you want to limit the number of fielddata evictions because they are I/O intensive. If you’re seeing a lot of evictions and you cannot increase your memory at the moment, Elastic search recommends a temporary fix of limiting fielddata cache to 20 percent of heap; Elastic search also recommends using doc values whenever possible because they serve the same purpose as fielddata. However, because they are stored on disk, they do not rely on JVM heap. Although doc values cannot be used for analyzed string fields, they do save field data usage when aggregating or sorting on other types of fields. Filter cache evictions: Each segment maintains its own individual filter cache. Since evictions are costlier operations on large segments than small segments, there’s no clear-cut way to assess how serious each eviction may be. However, if you see evictions occurring more often, this may indicate that you are not using filters to your best advantage—you could just be creating new ones and evicting old ones on a frequent basis, defeating the purpose of even using a cache. Pending tasks Pending tasks such as creating indices and assigning shards to nodes can only be handled by master nodes. Pending tasks are processed in priority order—urgent comes first, then high priority. They start to accumulate when the number of changes occurs more quickly than the master can process them.The number of pending tasks indicates how smoothly a cluster is operating. If your master node is very busy and the number of
- 6. International Journal on Recent and Innovation Trends in Computing and Communication ISSN: 2321-8169 Volume: 5 Issue: 11 222 – 229 _______________________________________________________________________________________________ 227 IJRITCC | November 2017, Available @ http://www.ijritcc.org _______________________________________________________________________________________ pending tasks doesn’t subside, it can lead to an unstable cluster. Unsuccessful GET requests A GET request is more straightforward than a normal search request—it retrieves a document based on its ID. An unsuccessful get-by-ID request means that the document ID was not found. 5. ELASTICSEARCH CHALLENGES Elasticsearch was intended to allow its users to get up and running quickly, without having to understand all of its inner workings. 5.1 Cluster status. Cluster status is reported as red if one or more primary shards and its replicas is missing, and yellow if one or more replica shards is missing. Normally, this happens when a node drops off the cluster for hardware failure, long garbage collection time, etc. Once the node recovers, its shards will remain in an initializing state before they transition back to active status. The number of initializing shards typically peaks when a node rejoins the cluster, and then drops back down as the shards transition into an active state. Fig: 7.Cluster status During this initialization period, your cluster state may transition from green to yellow or red until the shards on the recovering node regain active status. In many cases, a brief status change to yellow or red may not require any action on your part. However, if you notice that your cluster status is lingering in red or yellow state for an extended period of time, verify that the cluster is recognizing the correct number of Elastic search nodes, either by consulting Data dog’s dashboard or by querying the Cluster Health API Fig:8. The Cluster Health API If the number of active nodes is lower than expected, it means that at least one of your nodes lost its connection and hasn’t been able to rejoin the cluster. To find out which node(s) left the cluster, check the logs (located by default in the logs folder of your Elastic search home directory) for a line similar to the following:[TIMESTAMP] ... Cluster health status changed from [GREEN] to [RED]. Reasons for node failure can vary, ranging from hardware or hypervisor failures, to out-of-memory errors. If it is a temporary failure, you can try to get the disconnected node(s) to recover and rejoin the cluster. If it is a permanent failure, and you are not able to recover the node, you can add new nodes and let Elastic search take care of recovering from any available replica shards; replica shards can be promoted to primary shards and redistributed on the new nodes you just added. However, if you lost both the primary and replica copy of a shard, you can try to recover as much of the missing data as possible by using Elastic search snapshot and restore module. If you’re not already familiar with this module, it can be used to store snapshots of indices over time in a remote repository for backup purposes. 5.2Disk space If all data nodes are running low on disk space, add more data nodes to a cluster. Make sure that indices have enough primary shards to be able to balance their data across all those nodes.However, if only certain nodes are running out of disk space means an index is initialized with too few shards. It is hard for Elastic search to distribute these shards across nodes in a balanced manner.Elastic search takes available disk space into account when allocating shards to nodes. By default, it will not assign shards to nodes that have over 85 percent disk in use. In Datadog, you can set up a threshold alert to notify you when any individual data node’s disk space usage approaches 80 percent, which should give you enough time to take action. There are two remedies for low disk space. One is to remove outdated data and store it off the cluster. Second is storing all of your data on the cluster vertically or horizontally. 5.3 Execution time of Searches Search performance varies according to the type of data that is being searched and how each query is structured. Depending on the way data is organized, to speed up search performance, we have two methods custom routing andforce merging. Custom routing allows you to store related data on the same shard, so that you only have to search a single shard to satisfy a query.In Elasticsearch, every search request has to check every segment of each shard it hits. So once you have reduced the number of shards you’ll have to search, you can also reduce the number of segments per shard by triggering the Force Merge API on one or more of your indices. The Force Merge API prompts the segments in the index to continue merging until each shard’s segment count is reduced to max_num_segments which is 1, by default. Force mergingwhen it comes to shards with a large number of segments, the force merge process becomes much more computationally expensive. Force merging an index of 10,000 segments down to 5,000 segments doesn’t
- 7. International Journal on Recent and Innovation Trends in Computing and Communication ISSN: 2321-8169 Volume: 5 Issue: 11 222 – 229 _______________________________________________________________________________________________ 228 IJRITCC | November 2017, Available @ http://www.ijritcc.org _______________________________________________________________________________________ take much time, but merging 10,000 segments all the way down to one segment can take hours. The more merging that must occur, the more resources you take away from fulfilling search requests, which may defeat the purpose of calling a force merge in the first place. It is a good idea to schedule a force merging during non-peak hours, such as overnight, when you don’t expect many search or indexing requests. 5.4Index-heavy workload. Elastic search comes pre-configured with many settings to retain enough resources for searching and indexing data. However, if the usage of Elastic search is heavily skewed towards writes, it makes sense to tweak certain settings to boost indexing performance, even if it means losing some search performance or data replication. Methods to optimize use case for indexing. Shard allocation: If you are creating an index to update frequently, allocate one primary shard per node in a cluster, and two or more primary shards per node, but only if you have a lot of CPU and disk bandwidth on those nodes. However, shard overallocation adds overhead and may negatively impact search, since search requests need to hit every shard in the index. If you assign fewer primary shards than the number of nodes, you may create hotspots, as the nodes that contain those shards will need to handle more indexing requests than nodes that don’t contain any of the index’s shards. Disable merge throttling: Merge throttling is Elasticsearch’s automatic tendency to throttle indexing requests when it detects that merging is falling behind indexing. Update cluster settings to disable merge throttling to optimize indexing performance, not search. Increase the size of the indexing buffer: This(indices.memory.index_buffer_size) setting determines how full the buffer can get before its documents are written to a segment on disk. The default setting limits this value to 10 percent of the total heap in order to reserve more of the heap for serving search requests, which doesn’t help you if you’re using Elastic search primarily for indexing. Index first, replicate later: When you initialize an index, specify zero replica shards in the index settings, and add replicas after you’re done indexing. This will boost indexing performance, but it can be a bit risky if the node holding the only copy of the data crashes before you have a chance to replicate it. Refresh less frequently: Increase the refresh interval in the Index Settings API. By default, the index refresh process occurs every second, but during heavy indexing periods, reducing the refresh frequency can help alleviate some of the workload. Tweak your translog settings: Elastic search will flush translog data to disk after every request, reducing the risk of data loss in the event of hardware failure. If you want to prioritize indexing performance over potential data loss, you can change index.translogdurability to asyncin the index settings. With this in place, the index will only commit writes to disk upon every sync_interval, rather than after each request, leaving more of its resources free to serve indexing requests. 5.5Bulk thread pool rejections Thread pool rejections are typically a sign that you are sending too many requests to your nodes, too quickly. If this is a temporary situation you can try to slow down the rate of your requests. However, if you want your cluster to be able to sustain the current rate of requests, you will probably need to scale out your cluster by adding more data nodes. In order to utilize the processing power of the increased number of nodes, you should also make sure that your indices contain enough shards to be able to spread the load evenly across all of your nodes. 6. CONCLUSION Elastic search lets you make amazing things quite easily. It provides great features at great speeds and scale.In this paper, we’ve covered important areas of Elastic searchsuch as Search and indexing performance, Memory and garbage collection, Host-level system and network metrics, Cluster health and node availability and Resource saturation and errors.Elastic search metrics along with node-level system metrics will discover which areas are the most meaningful for specific use case. REFERENCES [1] https://curatedsql.com/2016/09/29/monitoring- elasticsearch-performance/ [2] https://blog.codecentric.de/en/2014/05/elasticsearch- indexing-performance-cheatsheet/ [3] https://sematext.com/publications/performance-monitoring- essentials-elasticsearch-edition.pdf [4] https://www.datadoghq.com/blog/elasticsearch- performance-scaling-problems/ [5] https://dzone.com/articles/top-10-elasticsearch-metrics [6] Elastic search: Guide – https://www.elastic.co/guide [7] Elasticsearch: Issues – https://github.com/elasticsearch/elasticsearch/issues [8] Heroku postgres production tier technical characterization, 2013 – https://devcenter.heroku.com/articles/heroku- postgres-production-tier-technical-characterization [9] PostgreSQL: PostgreSQL documentation, 2013 – http://www.postgresql.org/docs/current/static/ [10] Szegedi, Attila: Everything i ever learned about jVM performance tuning @twitter About the Authors Mr. Subhani Shaik is working as Assistant professor in Department of computer science and Engineering at St. Mary’s group of institutions Guntur, he has 12 years of TeachingExperience in the academics.
- 8. International Journal on Recent and Innovation Trends in Computing and Communication ISSN: 2321-8169 Volume: 5 Issue: 11 222 – 229 _______________________________________________________________________________________________ 229 IJRITCC | November 2017, Available @ http://www.ijritcc.org _______________________________________________________________________________________ Dr. Nallamothu Naga Malleswara Rao is working as Professor in the Department of Information Technology at RVR & JC College of Engineering with 25 years of Teaching Experience in the academics.