This document describes the development of an updated growth chart for preterm babies that begins at 22 weeks gestation. It summarizes the process of collecting recent data from large population studies on infant size at birth and term infant measurements to update the existing Babson and Benda 1976 chart. The new chart was developed by combining data sources on weight from Canada, head circumference from Sweden and Australia, and length from Australia and Sweden. Term infant data came from the CDC. The growth patterns of infants in the NICHD Neonatal Research Network were then compared to the new chart as validation. The updated chart allows comparison of preterm infant growth to intrauterine and term references from 22 weeks to 10 weeks.
![BMC Pediatrics 2003, 3 http://www.biomedcentral.com/1471-2431/3/13
Page 2 of 10
(page number not for citation purposes)
Background
Growth monitoring is a part of the medical and nutri-
tional assessment of preterm infants. Growth charts pro-
vide the basis for this assessment by providing a
comparison to a reference which allows for a visual pic-
ture of both the infant's achieved size and growth trajec-
tory. Parents and health professionals like to know
whether a preterm infant is able to maintain growth veloc-
ity or achieve catch-up in growth compared to the fetus
and the term infant. Intrauterine growth charts allow this
comparison for infants before term. Babson and Benda
(Babson) [1] extended an intrauterine chart past term age
by including a section based on the growth of infants born
at term. They published this chart in 1976 which they
referred to as a "fetal-infant growth graph".
The growth chart developed by Babson is still recom-
mended for use in Neonatal Intensive Care Units [2,3]. In
a recent survey of 118 neonatal health professionals, the
growth chart used most frequently was that of Babson [1]
(50%), followed by that of Lubchenco, Hansman &, Boyd
[4] (42%) and then by the one by Dancis [5] (18%)
(unpublished data).
Although commonly used, Babson's growth chart has lim-
itations. The X axis begins at 26 weeks of gestation thus
limiting its usefulness to plot younger preterm infants
from birth. The Y axis is made in 500 gram increments
which make precise plotting difficult. The sample size of
the data behind Babson's chart was small. There were only
45 infants in their sample that were 30 weeks or younger
[6]. The data was 15 years old at the time of publication
and is now 40 years old.
The purpose of this project was to prepare an updated
fetal-infant Babson-type growth chart for use in neonatal
intensive care units. This chart will allow a comparison for
preterm infants as young as 22 weeks of gestation, first
with intrauterine and then with post term references.
Methods
Literature review and selection
A search of the literature was conducted on three data-
bases (Pub Med, the Cochrane Library, EMBASE from
1980 to June 2002) using the subject headings: infant,
(premature, very low birthweight), anthropometry,
growth, birthweight, head, cephalometry, gestational age,
newborn, and reference values. Articles selected included
surveys of intrauterine and post term growth. Reference
lists of relevant articles were searched.
To improve on the Babson graph, two types of data were
needed: infant size measured at the time of birth for the
intrauterine section and term infant measurements for the
post-term section. Population studies with large sample
sizes were preferred to improve generalizability. The
World Health Organization has recommended that gesta-
tional age of infants be described as completed weeks [7],
so data stated in this manner were favored. Numerical
data were preferred over graphic depiction to ensure
accuracy.
Intrauterine data
Three recent large population based [8-10] surveys of
birthweight for various gestational ages were identified in
the literature search. These studies used statistical meth-
ods to delete implausible birth weight-gestational age
combinations and then smoothed the birth weight curves
across gestational age categories. The Canadian study by
Kramer et al [8] was selected for the intrauterine weight
section since their methods produced the most plausible
distribution of birth weights particularly for 28 through
36 weeks. For example, the 50th and 90th percentiles for 32
weeks in Alexander's corrected data were 2.2 and 3.2 kilo-
grams (kg) respectively. The 50th and 90th percentiles for
32 weeks in Kramer's corrected data were the more plausi-
ble 1.9 and 2.3 kg, respectively. Kramer et al used a statis-
tical method to correct for misclassification of term
infants incorrectly labeled as preterm. Table 1 lists details
regarding the data sources used.
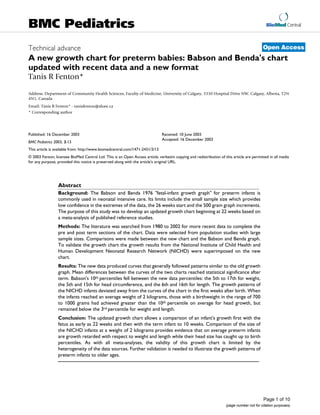
Two population based studies that met the a priori criteria
included head circumference and length, one from Swe-
den by Niklasson et al [11] and one from Australia by
Beeby et al [12]. A limitation with the Swedish survey was
that it did not include data prior to 29 weeks, however
both were used since the Swedish study was based on a
large sample.
To develop the head circumference and length curves, the
numerical data from Niklasson [11] and Beeby [12] were
averaged together using a weighted average based on total
sample size. Ideally the combining of these two data
sources would have been done with the raw data to create
one distribution for each gestational age, however this
was not possible from the published data. Since the sam-
ple sizes were very different (380,000 vs 30,000), the
resulting weighted averages were predominantly influ-
enced by the Swedish data. Therefore the head circumfer-
ence and length curves are only Australian data prior to 30
weeks and then predominately Swedish data after 30
weeks.
There was remarkable consistency between the head and
length results from the Australian and Swedish studies.
Between 31 and 33 weeks; the differences were less than
0.3 centimeter (cm) for 50th percentiles and 0.4 cm for the
10th and 90th percentile curves. The magnitudes of the dif-
ferences were greater for data at 29 weeks and greater than
36 weeks which may to be due to the way the Swedish](https://image.slidesharecdn.com/anewgrowthchartforpretermbabies-130818170937-phpapp02/85/A-new-growth-chart-for-preterm-babies-2-320.jpg)
![BMC Pediatrics 2003, 3 http://www.biomedcentral.com/1471-2431/3/13
Page 3 of 10
(page number not for citation purposes)
data was reported. These data were expressed as a third
degree polynomial function, so their curves were curved
downward at both ends. At the ends of the curves the dif-
ferences increased to 0.4 cm at both ends of the curve for
head circumference and to 0.8 cm (29 weeks) and 1.0 cm
(40 weeks) for length. (This problem was dealt with under
Smoothing of the Curves.) The consistency in the mid sec-
tions of the curves provides confidence regarding the com-
bining of the results from these two studies.
Post 40 week data
In selecting the term infant data for the post 40 weeks sec-
tion of the fetal-infant chart the Center for Disease Con-
trol (CDC) [13-15] data met the a priori criteria of being
based on large samples and having a numerical version
available. The CDC Growth Data is a compilation of
growth surveys of American multiracial-ethnic breast and
formula fed infants born between 1963 and 1994 [13].
The data are mostly cross sectional, but include some lon-
gitudinal measures.
Chart development
The data for both genders were averaged together for the
3rd, 10th, 50th, 90th and 97th percentiles to create one
growth chart. Separate gender charts were not produced
since the gender differences were considered not impor-
tant enough to warrant separate charts. The sample sizes
for the birthweight data are very large, so significant differ-
ences between the genders could be seen for most ages
even when the differences were small and of minor prac-
tical importance. Specifically, the differences between the
male and female weights were statistically significant at all
ages above 23 weeks for the 50th percentile (beginning
with a difference of 32 grams) and above 24 weeks for the
3rd percentile (beginning with a difference of 44 grams).
None of the head and length or the CDC data were
reported in a manner that permitted a statistical compari-
son by gender.
The largest differences between the genders were confined
to late gestation and after term. Along the 3rd percentile,
there was only one weight difference between the genders
that was greater than 100 grams (40 weeks) and none of
the head differences were greater than 0.4 cm. The differ-
ences between the genders along the 10th percentile were
limited to greater than 36 weeks for weight differences
greater than 100 grams and only 1 head difference was
greater than 0.6 cm. Along the 50th percentile the only dif-
ferences between the genders for weight more than 100
grams were greater than 35 weeks and the only head dif-
ferences greater than 0.4 cm were after term. For each of
these three percentiles, only 1 length measure was greater
than 1 cm and all of these were after term.
A large-scale grid was used to aid accuracy of plotting. The
increments were 100 grams for weight, one cm for head
Table 1: Details of the Data Sources
Kramer [8] Niklasson [11] Beeby [12] CDC [13]
Data used Birthweight ≤ 40 weeks Head and length measures ≤ 40 weeks Head and length measures ≤ 40
weeks
Weight, head and length
measures after term
Sample size (n) 676,605 376,000 Head circumference: 29090 and
length: 26973
Birth data :weight: 82 million,
length: 900,000, head
circumference: 400. First year
of life: 2200 to 38,000 infants.
n < 30 weeks 4101 0 274 N/A
Gestational age range of
study
22 to 43 weeks 28.5 to 42.5 weeks 22 to 43 weeks Post term
Inclusion criteria All births "Healthy" newborn infants Singleton livebirths NHANES surveys
Exclusion criteria Ontario (province) was
excluded due to problems with
data quality.
Stillbirths, twins, complications during
pregnancy with potential effects on
fetal growth and significant
malformations
Multiple births Infants with birthweights <
1500 grams
Dates 1994 to 1996 1977 to 81 1982 to 1995 Primarily 1963 to 1994
Completed gestational
weeks
yes yes yes N/A
Method to assess
gestational age
"early ultrasound has
increasingly been the basis for
gestational age assessments in
recent years"
Last menstrual period was used when
it was in agreement (+/- 2 weeks) with
the obstetric assessment. If not, the
latter was used. When either estimate
was missing the gestational age was
considered unknown.
In the majority of cases the
gestational age was based on first
trimester ultrasound, or when early
ultrasound was not available, last
menstrual period dates were used.
In < 1% of cases, the Ballard
assessment was used when neither
dates nor ultrasound were available.
N/A
Outliers Assumed a log normal
distribution of birthweight at
each gestational age and
compared the probabilities of
accurate versus misclassification
of infant's gestational age.
The mother's medical record was
examined and following verification
of the gestational age and other data,
outliers were either accepted as real
or corrected.
Curves were smoothed with
a variety of parametric and
non-parametric procedures](https://image.slidesharecdn.com/anewgrowthchartforpretermbabies-130818170937-phpapp02/85/A-new-growth-chart-for-preterm-babies-3-320.jpg)
![BMC Pediatrics 2003, 3 http://www.biomedcentral.com/1471-2431/3/13
Page 6 of 10
(page number not for citation purposes)
How does the growth of preterm infants appear on the
chart?
The data from the large multicenter cohort study done by
the National Institute of Child Health and Human Devel-
opment Neonatal Research Network (NICHD) [16] were
superimposed on the new growth chart (Figure 4). This
study documented the growth patterns of 1660 very low
birthweight infants born in 1994 and 1995. Infants with
anomalies and those that did not survive were excluded
from the study, but those with a variety of morbidities
were included. For this comparison, the growth trends of
the infants of average birthweights 550, 750, 950 and
1450 were used.
Results
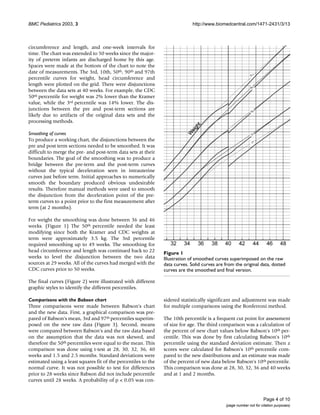
Comparisons with the Babson chart
The graphical comparison of Babson's mean, 3rd and 97th
percentiles [1] superimposed on the new raw data showed
similar values along the 50th percentile (Figure 3) with
greater differences for the 3rd and 97th percentiles.
When the means of Babson's and the new data were com-
pared, head circumference and length measures were sig-
nificantly different (p < 0.00005) after term. The small
numbers in the sample used by Babson [6] before term
limited the power of the statistical comparison to find dif-
ferences for the younger ages. The largest numerical differ-
ences in mean weight between the two sources were at 36
weeks where the new data was 120 grams higher and at
2.5 months where the new data was 143 grams lower. The
largest differences in means for head circumference and
length were 1.0 centimetre at 1.5 months and 1.2 cm at 26
weeks, respectively. The largest discrepancies for all 3
parameters were at the 97th percentile, with differences for
weight of 260 grams at 36 weeks, for head circumference
of 1.1 cm at 32 weeks and for length of 1.8 cm at both 30
and 32 weeks.
The percent of values below Babson's 10th percentile
ranged from the 5th to 17th for weight, the 5th and 15th
The dotted curves are Babson and Benda's 1976 fetal-infantgrowth curves superimposed on the raw data curvesFigure 3
The dotted curves are Babson and Benda's 1976 fetal-infant
growth curves superimposed on the raw data curves.
The postnatal growth data of 4 of the infant cohorts from theNational Institute of Child Health and Human DevelopmentNeonatal Research Network superimposed on the new chartFigure 4
The postnatal growth data of 4 of the infant cohorts from the
National Institute of Child Health and Human Development
Neonatal Research Network superimposed on the new
chart.](https://image.slidesharecdn.com/anewgrowthchartforpretermbabies-130818170937-phpapp02/85/A-new-growth-chart-for-preterm-babies-6-320.jpg)
![BMC Pediatrics 2003, 3 http://www.biomedcentral.com/1471-2431/3/13
Page 7 of 10
(page number not for citation purposes)
for head circumference, and the 6th and 16th for length
(data not shown).
How does the growth of preterm infants appear on the
chart?
The growth curves from the NICHD for weight, length and
head circumference showed clear deviations away from
the intrauterine curves in the first weeks after birth. (Fig-
ure 4) The subsequent growth in weight of the infants
with birthweights less than 1 kilogram was less than the
late intrauterine rate but steeper than the post term slope.
When the infants reached an average weight of 2 kilo-
grams, all of the average weight growth curves were below
the 10th percentile, and the smaller three groups remained
below the 3rd percentile. The average growth of head cir-
cumference recovered the original birth percentiles except
for the smallest group. Only the smallest group's average
head size remained below the 10th percentile. The average
growth in length also recovered from the post birth decel-
eration but like weight, only the largest group had an aver-
age size above the 3rd percentile.
Discussion
This new fetal-infant chart is an updated Babson-type
growth chart for use in neonatal intensive care units. This
chart will allow a comparison for preterm infants as
young as 22 weeks of gestation first with intrauterine and
then with post term references and it can replace the one
developed by Babson [1] which has been used in neonatal
intensive care for over 25 years. The 10th percentile of this
chart is accurate to the source data prior to 36 weeks;
therefore it could be used for the assessment of size for
gestational age for infants smaller than 2 kilograms.
This meta-analysis does not represent the actual growth of
preterm infants for three reasons. First, the initial parts of
the curves are based on the size of fetuses at birth, which
do not show the change in weight that occurs after birth.
This is followed by curves based on the growth of term
infants who have not had the growth depressing effect of
prematurity [17]. Another approach for monitoring
growth of preterm infants using growth charts is to use a
longitudinal postnatal growth chart. These growth charts
show the pattern of initial weight loss after birth followed
by subsequent growth of a sample of preterm infants.
Examples include those by Dancis et al [5], Wright et al
[18], and those developed by the Infant Health Develop-
ment Program [19], and by the NICHD [16]. These longi-
tudinal charts have the advantage of using samples of very
low birth weight infants as the growth reference and
showing the actual growth pattern of preterm infants.
Their disadvantage is that they are not based on the
growth standard for preterm infants, that is, on fetal
growth [20,21]. Therefore they do not show an infant's
growth velocity or catch-up in growth relative to the fetus
or the term infant. Further, the curves on a longitudinal
growth chart are highly influenced by the medical and
nutritional care of the sample infants; growth patterns
may change with innovations in medical and nutritional
care [22]. The use of both fetal-infant and longitudinal
charts together provide a more accurate assessment of
growth of preterm infants [22].
Second, the validity of a meta-analysis is affected by meth-
odological quality of the individual studies and the extent
of heterogeneity in the studies and their results. Data from
different studies were combined to prepare the graphs. It
would have been preferable if all the data could have been
obtained from one study with uniform methodology. The
a priori criteria did limit the studies to those that were
population based, had large sample sizes, and recorded
gestational age in completed weeks. The studies used were
all from developed countries where the majority of
women are well nourished and the three studies used for
the preterm section have publicly funded universal health
care. The studies have slight differences in the inclusion
and exclusion criteria (Table 1) which could have influ-
enced their results. The most notable differences between
the studies were the exclusion of multiple births from the
Swedish and Australian surveys and the statistical adjust-
ment of the Canadian survey data. There is evidence that
the birthweight of infants from multiple gestations are
reduced relative to the weight of singletons after 28 to 30
weeks of gestation [23]. The consistency of the results of
the two sources of head circumference and length data
was remarkable, which suggests that the differences
between these two studies were not substantial.
Could a secular trend make the combining of the data
invalid? There has been a slight trend towards an increase
in birthweight of term infants in the United States and in
Canada of 1 to 3 grams per year on average over the time
frame that the data were collected [24,25]. No trends are
apparent among infants of lower gestational ages [24,25].
Regarding head and length size, there is some evidence of
small increases over this time period [26]. Since these dif-
ferences are slight, their influence on the data is not likely
of clinical significance.
Third, the smoothing that was applied to bridge the pre
and post term curves may or may not be a valid estimate
of the growth of preterm infants. Further validation stud-
ies will determine the soundness of the smoothed disjunc-
tion between the data sets. The ideal validation study
would compare the growth of a population of healthy pre-
term infants followed prospectively from birth though 50
weeks post-conceptual age. Healthy infants should be
used to decrease the chance of bias due to illness of pre-
maturity, however it would be useful to also document
the growth patterns of unwell infants on this growth chart.](https://image.slidesharecdn.com/anewgrowthchartforpretermbabies-130818170937-phpapp02/85/A-new-growth-chart-for-preterm-babies-7-320.jpg)
![BMC Pediatrics 2003, 3 http://www.biomedcentral.com/1471-2431/3/13
Page 8 of 10
(page number not for citation purposes)
The superimposed NICHD growth curves (Figure 4) rep-
resent a mixed group of infants, some without complica-
tions and others with morbidities, and with varying size
for gestational age [16]. When the infants from this study
approached the average weight of 2 kilograms those
infants with a birthweight in the range of 700 to 1000
grams on average achieved the 10th percentile for head
growth, but remained below the 3rd percentile for weight
and length.
This finding is similar to that seen in previous studies of
the growth of preterm infants on this type of growth
chart[16,17,27]. The growth of most preterm infants plot-
ted on this type of chart track lower curves or below the
curves because of the initial weight loss after birth and the
extended time required for catch up growth to occur
[17,28]. There appears to be a priority among preterm
infants for growth of head circumference over weight and
length growth [27] and of weight over length growth
[17,27]. Catch up growth of preterm infants is a long term
process and small preterm infants are growth retarded
during the first years of life [17]. The curves of the fetal-
infant growth chart provide a backdrop against which an
infant's growth trajectory can be plotted.
There were agreements and differences between this
newer data with that of Babson. The agreements suggest
that the Babson curves had fairly accurate depictions of
infant size which may account for the continued popular-
ity of this chart. The differences may reflect the small sam-
ple sizes of the early chart and the use of only maternal
dates for the gestational age [6]. The larger sample sizes
used here may provide better confidence in the extreme
percentiles [29].
The fetal-infant chart encourages the use of age that is
adjusted for prematurity after 40 weeks. Once an infant
surpasses 50 weeks, the regular CDC growth charts could
be used, with continued adjustment for prematurity.
Some authors have suggested that age be adjusted for
preterm infants to at least 3 years [30], or even up to 7
years [31].
The data behind the new chart are predominantly cross
sectional. Data of this type can be criticized since they are
based on attained size of individuals and not on actual
growth patterns [15]. However, cross sectional growth
charts, such as the CDC Growth Charts, are useful for
assessment of growth over time [15].
The selection of the CDC data for the post 40 week section
may not be ideal since the database excluded preterm
infants with a birth weight less than 1.5 kg. These infants
grow differently than those of higher birthweight and this
exclusion make the CDC charts more like a growth stand-
ard [14]. However, this data of mostly normal birthweight
infants have some advantages in that they are intuitively
understood and their use aids the assessment of whether
catch-up growth is occurring. As well, for those infants
that may cross percentiles upward, the CDC curves of
infants born at term provide a guide for a realistic
expected size for age and what size is heavier than
expected. An additional advantage from using the CDC
data is that after 50 weeks of post menstrial age a
transition can be made from the chart developed here to
the CDC charts.
It has been suggested that the distribution of weights
among fetuses that are born preterm may be smaller than
those that remain in utero and are delivered at term [32],
and therefore it may be better to use ultrasound data for
measures of the size of infants that are not born prema-
turely. There are two reasons why it may be desirable to
continue to use the size of preterm infants at birth as a
growth reference. First, ultrasound data are variable and
lack reproducibility [32-34]. As well, measurement of pre-
term infants provides weight, head circumference and
length measurements while ultrasound only provides esti-
mates of these measures.
The use of growth charts is only as accurate as the meas-
urements that are made of the infants. Measurements of
weight on electronic scales [35] and head circumference
using paper tapes [36] have been shown to be reliable.
However, measurement of length, even under controlled
conditions on clinically stable infants is not very accurate
or reliable and therefore growth may be undetected or
appear excessive or inadequate [37]. To improve accuracy
of length data, infants should be measured on a head-
board by two people [38].
Unfortunately the literature that accompanied the popu-
lation based data sources does not include a description of
the scales and tapes used to measure the infants, nor of the
accuracy of these instruments. Since the data sources were
population based, it is likely that a variety of precision
occurred.
Head growth is important to monitor, since growth that
deviates from the intrauterine rate could indicate prob-
lems [39,40]. Calculation of growth velocity (gram/kg/
day over several days) is recommended since it is a precise
measure of growth [38]. The most comprehensive growth
assessment uses a calculation of growth velocity together
with assessment of size relative to references for a given
age on a growth chart.
At term age, infants born prematurely tend to have a dif-
ferent body composition than infants born at term, with
lower weight, lean tissue and bone mineral content and a](https://image.slidesharecdn.com/anewgrowthchartforpretermbabies-130818170937-phpapp02/85/A-new-growth-chart-for-preterm-babies-8-320.jpg)
![BMC Pediatrics 2003, 3 http://www.biomedcentral.com/1471-2431/3/13
Page 9 of 10
(page number not for citation purposes)
higher percent body fat [41]. The optimum body
composition of the growing preterm infant is not known
nor easily measured. Current growth charts provide no
assessment of body composition.
Conclusions
This updated fetal-infant chart supports growth monitor-
ing of preterm infants from as early as 22 weeks gesta-
tional age to 10 weeks post term age. It allows a
comparison of an infant's growth with first the fetus and
then the term infant and therefore allows an evaluation of
catch up growth. Although Babson's "fetal-infant growth
graph" had reasonably accurate estimates along the 50th
percentile, the larger sample sizes and more accurate ges-
tational age assignments used here may provide better
confidence in the extreme percentiles. As with all meta-
analyses, the validity of this growth chart is affected by the
methodological quality of the data sources and the heter-
ogeneity of their results.
Comparison of the growth of the NICHD infants at
attained weight of 2 kilograms provides evidence that, on
average, preterm infants are growth retarded with respect
to weight and length while, except for the smallest infants,
their average head size has caught up to birth percentiles.
Further validation work is needed to illustrate the growth
patterns of preterm infants to older ages.
List of Abbreviations
kilogram (kg)
centimeter (cm)
Center for Disease Control (CDC)
National Institute of Child Health and Human Develop-
ment Neonatal Research Network (NICHD)
Competing interests
None declared.
Authors' contributions
TF carried out the literature search, data selection, grid
design, chart development, statistical comparisons and
manuscript preparation.
Acknowledgements
Thanks to: Pat Fenton for assistance with the computer graph preparations,
Doug McMillan for scientific and editorial advice, Debbie McNeil for statis-
tical advice and Sari Czink and Suzanne Tough for editorial assistance.
References
1. Babson SG, Benda GI: Growth graphs for the clinical assess-
ment of infants of varying gestational age. J Pediatr 1976,
89:814-820.
2. KF Catrine: Anthropometric Assessment. Nutritional Care for
High Risk Newborns 3rdth edition. Edited by: Groh-Wargo S, Thompson
M and Hovasi-Cox J. Chicago, Precept Press; 2000.
3. DM Anderson: Nutrition for the low-birth-weight infant.
Krause's Food,Nutrition and Diet Therapy 10thth edition. Edited by:
Mahan LK and Escott-Stump S. Philadelphia, WB Saunders; 2000:231.
4. Lubchenco LO, Hansman C, Boyd E: Intrauterine growth in
length and head circumference as estimated from live births
at gestational ages from 26 to 42 weeks. Pediatrics 1966,
37:403-408.
5. Dancis J, O'Connell JR, Holt LE: A grid for recording the weight
of premature infants. J Pediatr 1948, 33:570-572.
6. Usher R, McLean F: Intrauterine growth of live-born Caucasian
infants at sea level: standards obtained from measurements
in 7 dimensions of infants born between 25 and 44 weeks of
gestation. J Pediatr 1969, 74:901-910.
7. World Health Organization: Physical status: the use and inter-
pretation of anthropometry. Report of a WHO Expert
Committee. World Health Organ Tech Rep Ser 1995, 854:1-452.
8. Kramer MS, Platt RW, Wen SW, Joseph KS, Allen A, Abrahamowicz
M, Blondel B, Breart G: A new and improved population-based
Canadian reference for birth weight for gestational age. Pedi-
atrics 2001, 108:E35.
9. Alexander GR, Himes JH, Kaufman RB, Mor J, Kogan M: A United
States national reference for fetal growth. Obstet Gynecol 1996,
87:163-168.
10. Arbuckle TE, Wilkins R, Sherman GJ: Birth weight percentiles by
gestational age in Canada. Obstet Gynecol 1993, 81:39-48.
11. Niklasson A, Ericson A, Fryer JG, Karlberg J, Lawrence C, Karlberg P:
An update of the Swedish reference standards for weight,
length and head circumference at birth for given gestational
age (1977-1981). Acta Paediatr Scand 1991, 80:756-762.
12. Beeby PJ, Bhutap T, Taylor LK: New South Wales population-
based birthweight percentile charts. J Paediatr Child Health 1996,
32:512-518.
13. RJ Kuczmarski, CL Ogden, Grummer-Strawn LM et al: CDC growth
charts: United States. Advance Data from vital and health statistics,
no 314 Hyattsville, Maryland: National Center for Health Statistics. 2000;
2000.
14. Ogden CL, Kuczmarski RJ, Flegal KM, Mei Z, Guo S, Wei R, Grum-
mer-Strawn LM, Curtin LR, Roche AF, Johnson CL: Centers for Dis-
ease Control and Prevention 2000 growth charts for the
United States: improvements to the 1977 National Center
for Health Statistics version. Pediatrics 2002, 109:45-60.
15. Kuczmarski RJ, Ogden CL, Guo SS, Grummer-Strawn LM, Flegal KM,
Mei Z, Wei R, Curtin LR, Roche AF, Johnson CL: 2000 CDC
Growth Charts for the United States: methods and
development. Vital Health Stat 11 2002:1-190.
16. Ehrenkranz RA, Younes N, Lemons JA, Fanaroff AA, Donovan EF,
Wright LL, Katsikiotis V, Tyson JE, Oh W, Shankaran S, Bauer CR,
Korones SB, Stoll BJ, Stevenson DK, Papile LA: Longitudinal
growth of hospitalized very low birth weight infants. Pediatrics
1999, 104:280-289.
17. Niklasson A, Engstrom E, Hard AL, Wikland KA, Hellstrom A:
Growth in very preterm children: a longitudinal study. Pediatr
Res 2003, 54:899-905.
18. Wright K, Dawson JP, Fallis D, Vogt E, Lorch V: New postnatal
growth grids for very low birth weight infants. Pediatrics 1993,
91:922-926.
19. Guo SS, Roche AF, Chumlea WC, Casey PH, Moore WM: Growth
in weight, recumbent length, and head circumference for
preterm low-birthweight infants during the first three years
of life using gestation-adjusted ages. Early Hum Dev 1997,
47:305-325.
20. Committee on Nutrition American Academy of Pediatrics: Nutri-
tional Needs of Preterm Infants. Pediatric Nutrition Handbook Elk
Grove Village Il; 1998.
21. Nutrition Committee Canadian Paediatric Society: Nutrient needs
and feeding of premature infants. CMAJ 1995, 152:1765-1785.
22. AF Roche: Executive Summary of the Low Birth Weight
Workshop. US Department of Health and Social Services; Centers for
Disease Control and Prevention; National Center for Health Statistics 1994.
23. Min SJ, Luke B, Gillespie B, Min L, Newman RB, Mauldin JG, Witter
FR, Salman FA, O'sullivan MJ: Birth weight references for twins.
Am J Obstet Gynecol 2000, 182:1250-1257.](https://image.slidesharecdn.com/anewgrowthchartforpretermbabies-130818170937-phpapp02/85/A-new-growth-chart-for-preterm-babies-9-320.jpg)


![Hypothalamus short ppt by Dr. Neha [PT].pptx](https://cdn.slidesharecdn.com/ss_thumbnails/hypothalamusbydr-260124145759-b9f94a93-thumbnail.jpg?width=640&height=640&fit=bounds)


