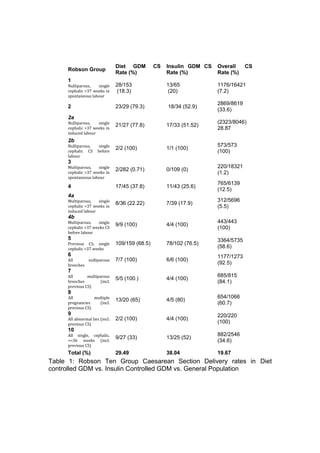
Use of the Robson Ten Groups to allow accurate comparison of
caesarean section rates specific to Gestational Diabetes: important
implications to clinical practice and patient counseling
W Courtney, C Carroll, M Higgins, M Robson, F McAuliffe, M Foley
Introduction
This study aimed to examine the rate of caesarean section (CS) in gestational
diabetes (GDM) as classified by the Robson Criteria, a commonly used
method of analysis.
Methods
Prospective study of all women with GDM in a large tertiary level unit. Cases
were classified into their relevant Robson group and compared based on rate
of caesarean section (CS).
Results
Between January 2005 and December 2011, 61,116 women delivered infants
greater than 24 weeks gestation in this unit, of which 1126 (1.8%) were
diagnosed with gestational diabetes. During this time the overall hospital CS
rate was 19.6%, compared to 32.5% rate in GDM. Nulliparous women
undergoing induction of labour (Groups 2a and 4a) had an increased CS
delivery rate (63% in nulliparous vs 20% in multiparous women). The majority
of women with a previous CS delivered by repeat CS (71%).
Conclusion
The incidence of GDM in this hospital population remains low. Women with a
diagnosis of GDM had a 65% increased rate of delivery by caesarean section
compared to the general population. The highest rate of CS was amongst
women with a previous CS or those undergoing induction. Multiparous women
undergoing induction (group 4a) had a three to four fold increased rate of
delivery by CS compared to the general population. This data supports a
policy of thoughtful induction of labour in women with GDM and realistic
counselling of women regarding the possible outcomes of induction of labour.
Table 1: Robson Ten Group Caesarean Section Delivery rates in Diet
controlled GDM vs. Insulin Controlled GDM vs. General Population
Robson Group
Diet GDM CS
Rate (%)
Insulin GDM CS
Rate (%)
Overall CS
Rate (%)
1
Nulliparous, single
cephalic >37 weeks in
spontaneous labour
28/153
(18.3)
13/65
(20)
1176/16421
(7.2)
2 23/29 (79.3) 18/34 (52.9)
2869/8619
(33.6)
2a
Nulliparous, single
cephalic >37 weeks in
induced labour
21/27 (77.8) 17/33 (51.52)
(2323/8046)
28.87
2b
Nulliparous, single
cephalic CS before
labour
2/2 (100) 1/1 (100)
573/573
(100)
3
Multiparous, single
cephalic >37 weeks in
spontaneous labour
2/282 (0.71) 0/109 (0)
220/18321
(1.2)
4 17/45 (37.8) 11/43 (25.6)
765/6139
(12.5)
4a
Multiparous, single
cephalic >37 weeks in
induced labour
8/36 (22.22) 7/39 (17.9)
312/5696
(5.5)
4b
Multiparous, single
cephalic >37 weeks CS
before labour
9/9 (100) 4/4 (100)
443/443
(100)
5
Previous CS, single
cephalic >37 weeks
109/159 (68.5) 78/102 (76.5)
3364/5735
(58.6)
6
All nulliparous
breeches
7/7 (100) 6/6 (100)
1177/1273
(92.5)
7
All multiparous
breeches (incl.
previous CS)
5/5 (100.) 4/4 (100)
685/815
(84.1)
8
All multiple
pregnancies (incl.
previous CS)
13/20 (65) 4/5 (80)
654/1066
(60.7)
9
All abnormal lies (incl.
previous CS)
2/2 (100) 4/4 (100)
220/220
(100)
10
All single, cephalic,
<=36 weeks (incl.
previous CS)
9/27 (33) 13/25 (52)
882/2546
(34.6)
Total (%) 29.49 38.04 19.67

GDM and Pregnancy

  • 1.
    Use of theRobson Ten Groups to allow accurate comparison of caesarean section rates specific to Gestational Diabetes: important implications to clinical practice and patient counseling W Courtney, C Carroll, M Higgins, M Robson, F McAuliffe, M Foley Introduction This study aimed to examine the rate of caesarean section (CS) in gestational diabetes (GDM) as classified by the Robson Criteria, a commonly used method of analysis. Methods Prospective study of all women with GDM in a large tertiary level unit. Cases were classified into their relevant Robson group and compared based on rate of caesarean section (CS). Results Between January 2005 and December 2011, 61,116 women delivered infants greater than 24 weeks gestation in this unit, of which 1126 (1.8%) were diagnosed with gestational diabetes. During this time the overall hospital CS rate was 19.6%, compared to 32.5% rate in GDM. Nulliparous women undergoing induction of labour (Groups 2a and 4a) had an increased CS delivery rate (63% in nulliparous vs 20% in multiparous women). The majority of women with a previous CS delivered by repeat CS (71%). Conclusion The incidence of GDM in this hospital population remains low. Women with a diagnosis of GDM had a 65% increased rate of delivery by caesarean section compared to the general population. The highest rate of CS was amongst women with a previous CS or those undergoing induction. Multiparous women undergoing induction (group 4a) had a three to four fold increased rate of delivery by CS compared to the general population. This data supports a policy of thoughtful induction of labour in women with GDM and realistic counselling of women regarding the possible outcomes of induction of labour.
  • 2.
    Table 1: RobsonTen Group Caesarean Section Delivery rates in Diet controlled GDM vs. Insulin Controlled GDM vs. General Population Robson Group Diet GDM CS Rate (%) Insulin GDM CS Rate (%) Overall CS Rate (%) 1 Nulliparous, single cephalic >37 weeks in spontaneous labour 28/153 (18.3) 13/65 (20) 1176/16421 (7.2) 2 23/29 (79.3) 18/34 (52.9) 2869/8619 (33.6) 2a Nulliparous, single cephalic >37 weeks in induced labour 21/27 (77.8) 17/33 (51.52) (2323/8046) 28.87 2b Nulliparous, single cephalic CS before labour 2/2 (100) 1/1 (100) 573/573 (100) 3 Multiparous, single cephalic >37 weeks in spontaneous labour 2/282 (0.71) 0/109 (0) 220/18321 (1.2) 4 17/45 (37.8) 11/43 (25.6) 765/6139 (12.5) 4a Multiparous, single cephalic >37 weeks in induced labour 8/36 (22.22) 7/39 (17.9) 312/5696 (5.5) 4b Multiparous, single cephalic >37 weeks CS before labour 9/9 (100) 4/4 (100) 443/443 (100) 5 Previous CS, single cephalic >37 weeks 109/159 (68.5) 78/102 (76.5) 3364/5735 (58.6) 6 All nulliparous breeches 7/7 (100) 6/6 (100) 1177/1273 (92.5) 7 All multiparous breeches (incl. previous CS) 5/5 (100.) 4/4 (100) 685/815 (84.1) 8 All multiple pregnancies (incl. previous CS) 13/20 (65) 4/5 (80) 654/1066 (60.7) 9 All abnormal lies (incl. previous CS) 2/2 (100) 4/4 (100) 220/220 (100) 10 All single, cephalic, <=36 weeks (incl. previous CS) 9/27 (33) 13/25 (52) 882/2546 (34.6) Total (%) 29.49 38.04 19.67