Download to read offline
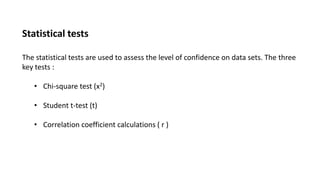
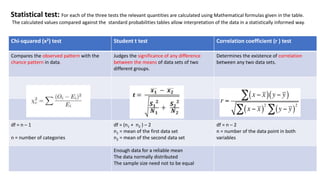

The document discusses three key statistical tests: the chi-square test, Student t-test, and correlation coefficient calculations. It provides information on what each test is used for and the relevant quantities calculated for each using mathematical formulas. The chi-square test compares observed and expected patterns in data. The Student t-test judges the significance of differences between means of two groups. The correlation coefficient determines the existence of correlation between two data sets.


