A Description of the Immigrant Population: An Update

This Congressional Budget Office report provides an updated description of the immigrant population in the United States based on data through 2009. It finds that the foreign-born population reached a record high of 40 million in 2009, comprising 13% of the total U.S. population. The report analyzes characteristics of the immigrant population such as countries of origin, citizenship status, decade of arrival, and demographic and socioeconomic traits. It also examines trends in legal immigration to the U.S. over the past century and a half. Key findings include that over a third of immigrants came from Mexico and Central America, over half of immigrants have become naturalized U.S. citizens, and grants of legal permanent residence have increased substantially since the 1960s

Recommended
More Related Content
Viewers also liked
Viewers also liked (20)
Similar to A Description of the Immigrant Population: An Update
Similar to A Description of the Immigrant Population: An Update (20)
More from Congressional Budget Office
More from Congressional Budget Office (20)
Recently uploaded
Recently uploaded (10)
A Description of the Immigrant Population: An Update
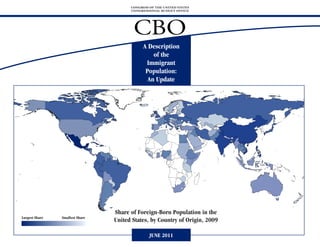
- 1. CONGRESS OF THE UNITED STATES CONGRESSIONAL BUDGET OFFICE CBO A Description of the Immigrant Population: An Update Share of Foreign-Born Population in the Largest Share Smallest Share United States, by Country of Origin, 2009 JUNE 2011
- 3. CBO A Description of the Immigrant Population: An Update June 2011 The Congress of the United States O Congressional Budget Office
- 4. Notes and Definitions Unless otherwise noted, all years referred to are calendar years. Numbers in the text and exhibits may not add up to totals because of rounding. Foreign born: Born outside the United States (or one of its territories) to parents who are not U.S. citizens. Immigrant: In this report, a synonym for foreign born. Legal permanent resident: A noncitizen of the United States authorized to live, work, and study in the United States permanently. Such status is granted to immediate relatives of U.S. citizens, including spouses, minor children, and parents. It can also be granted for family-sponsored preferences (for example, to extended family members such as aunts or cousins), employment-based preferences, and diversity preferences, although there is an annual cap on the number of people who can receive such grants. In addition, legal permanent resident status can be granted to people who are classified as refugees or asylum seekers. After becoming a legal permanent resident, a noncitizen immigrant receives a permanent resident card, commonly called a “green card,” which serves as proof of permission to live and work in the country. Legal temporary resident or visitor: A noncitizen of the United States who is admitted to the country with a temporary visa or who is allowed to enter without a visa. People in those categories include visitors who are in the United States for short periods and temporary residents who are in the United States for longer, although time-limited, stays. Native born: Born in the United States or one of its territories or, if born abroad, to at least one parent who is a U.S. citizen. Naturalized citizen: A foreign-born individual who has become a U.S. citizen by fulfilling requirements set forth in the Immigration and Nationality Act, including, in most cases, having resided in the United States for at least five years. Unauthorized resident: A noncitizen of the United States who is in the United States without legal authorization. This group includes people who enter the country illegally and people who enter the country with valid visas but overstay their authorized time in the country. CBO
- 5. NOTES AND DEFINITIONS A DESCRIPTION OF THE IMMIGRANT POPULATION: AN UPDATE iii Source data: Much of the information on immigration in this document comes from the Current Population Survey (CPS), a monthly survey of U.S. households conducted by the Census Bureau. The survey of people living in house- holds excludes the roughly 3 percent of the resident U.S. population living in barracks, prisons, nursing homes, and other group quarters. Among other questions, respondents are asked where they and their parents were born. Those who were born in another country are asked when they came to the United States to stay and whether they have become citizens by naturalization. All information is reported by respondents and is not validated against other sources. No one is asked about legal immigration status. To increase the statistical accuracy of the estimates in this document, the Congressional Budget Office (CBO) combined unduplicated samples from all 12 months of the 2009 CPS (known as the Outgoing Rotation Group files). CBO used the American Community Survey (ACS) for estimates of the total population, decade of arrival, and rates of fertility and the March 2009 CPS (also known as the Annual Social and Economic Supplement) for information on annual earnings, income, and poverty status. CBO did not attempt to adjust the estimates from the CPS or the ACS to account for the possibility that some foreign-born people should have been counted in those surveys but were not. For estimating the size of the unauthorized population, the Department of Homeland Security has assumed that the ACS’s undercount rates range from 2.5 percent for noncitizens who are legal permanent residents, refugees, or have been granted asylum to 10 percent for noncitizens without authorization to be in the United States. Those estimates suggest that the ACS and CPS undercount the overall foreign-born population by about 5 percent. Categories of regions: The foreign-born population from Mexico and Central America differs significantly from the remaining foreign-born population with respect to educational attainment and the likelihood of becoming naturalized citizens; consequently, that group is identified separately in this report. The foreign-born population from other parts of the world is divided into four regions, generally corresponding to continents. Oceania includes Australia, New Zealand, and the Pacific Islands. Russia, which lies both in Europe and in Asia, is grouped with European countries, as is Canada. CBO
- 6. Preface Foreign-born people represent a large and growing share of the U.S. population. The native- and foreign-born populations differ in a variety of characteristics, such as age, fertility, educational attainment, occupation, earnings, and income. Among the foreign born, naturalized citizens differ from noncitizens, and people from some parts of the world differ from people from other parts on most of those characteristics. In November 2004, the Congressional Budget Office (CBO) published A Description of the Immigrant Population, which included data through 2003. This update contains information through 2009. It relies on a set of data sources that differ slightly from those used for the original paper. Nabeel Alsalam and Jonathan Schwabish of CBO’s Health and Human Resources Division wrote the document with guidance from Greg Acs, Joyce Manchester, and Bruce Vavrichek (formerly of CBO). CBO staff member Sarah Axeen provided research assistance, and the work benefited from the comments of Molly Dahl, Robert Dennis (formerly of CBO), Peter Fontaine, Patrice Gordon, Priscila Hammett, Jimmy Jin, Melissa Merrell, Jonathan Morancy, Paige Piper/Bach, Brian Prest, David Rafferty, and Robert Shackleton Jr. Helpful comments also came from William Kandel of the Congressional Research Service, Rakesh Kochhar of the Pew Hispanic Center, and Jennifer Van Hook of Pennsylvania State University. (The assistance of external reviewers implies no responsibility for the final product, which rests solely with CBO.) In keeping with CBO’s mandate to provide objective analysis, this document makes no recommendations. Kate Kelly and Sherry Snyder edited the document. Maureen Costantino and Jeanine Rees prepared the document for publication, Monte Ruffin produced the printed copies, and Linda Schimmel handled the print distribution. An electronic version is available from CBO’s Web site (www.cbo.gov). Douglas W. Elmendorf Director June 2011 CBO
- 7. List of Exhibits Exhibit Page Number 1. Foreign-Born Population in the United States, 1860 to 2009 3 2. Naturalized Citizens, by Period of Arrival in the United States and Birthplace, 2009 4 3. Noncitizens, by Period of Arrival in the United States and Birthplace, 2009 5 Grants of Legal Permanent Resident Status 4. Grants of Legal Permanent Resident Status During the Decade as a Percentage of the U.S. Population in the First Year of the Decade, 1860 to 2009 7 5. Percentage of Grants of Legal Permanent Resident Status, by Birthplace and Decade, 1860 to 2009 8 6. Grants of Legal Permanent Resident Status, by Time and Major Category of Admission, Fiscal Years 2004 and 2009 9 Demographic Characteristics of the Foreign-Born and Native-Born Populations 7. Foreign-Born Population, by State of Residence, 1999 to 2009 11 8. Twenty States with the Highest Shares of Foreign-Born People, by Region, 2009 12 9. U.S. Population, by Age and Birthplace, 2009 13 10. Fertility Rates and Marital Status for Native-Born and Foreign-Born Women Ages 15 to 49, 2009 14 11. Educational Attainment of People Ages 25 to 64, by Birthplace, 2009 15 12. Unauthorized Foreign-Born Population, by Birthplace and Age, 2000 and 2009 16 13. Unauthorized Foreign-Born Population, by State of Residence, 2000 and 2009 17 CBO
- 8. LIST OF EXHIBITS A DESCRIPTION OF THE IMMIGRANT POPULATION: AN UPDATE vi Exhibit Page Number Labor Market Characteristics of the Foreign-Born and Native-Born Populations 14. Labor Force Status of Men and Women Ages 16 to 64, by Age and Birthplace, 2009 19 15. Percentage of Workers Ages 25 to 64 in Various Occupational Groups, by Birthplace, 2009 20 16. Percentage of Workers Ages 25 to 64 in Various Industries, by Birthplace, 2009 21 17. Unemployment Rate of People Ages 25 to 64, by Birthplace, 1994 to 2009 22 18. Annual Earnings of Workers Ages 25 to 64, by Sex, Citizenship, Birthplace, and Earnings Percentile, 2009 23 19. Median Family Income and Other Selected Characteristics, by Type of Family, Citizenship, and Birthplace, 2009 24 20. Percentage of the Population Living in Families with Income Below the Poverty Threshold, by Age, Sex, and Citizenship, 2009 25 CBO
- 9. A Description of the Immigrant Population: An Update In 2009, about 39 million foreign-born people Legal Permanent Residents 37 percent of naturalized citizens were from Asia, lived in the United States, making up more than 21 percent were from Mexico and Central From 2000 to 2009, more than 10 million people 12 percent of the U.S. population—the largest America, and 18 percent were from the Caribbean were granted legal permanent resident (LPR) status share since 1920. Naturalized citizens (foreign- and South America; only 21 percent were from in the United States. Legal permanent residents are born people who have fulfilled the requirements of Europe and Canada. permitted to live, work, and study in the United U.S. citizenship) accounted for about 17 million States, and receiving LPR status is an important of the total. Noncitizens (foreign-born people milestone on the path to U.S. citizenship. As a authorized to live and work in the United States percentage of the U.S. population, grants of LPR Demographic Characteristics of either temporarily or permanently and people who status were down somewhat from the 1990s, but Foreign-Born and Native-Born are not authorized to live or work in the United States) accounted for about 22 million of the total. otherwise they were higher than at any time since Populations the 1920s. Foreign-born people live throughout the United About half of the noncitizens were people without authorization to live or work in the United States, States, and in some states they represent a substan- Over the past two centuries, the main nations of either temporarily or permanently. tial fraction of the population. In 2009, more than origin of legal permanent residents in the United 1 in 4 people in California and more than 1 in 5 States have changed. Until the past few decades, In 2009, about 38 percent of foreign-born people people in New York and New Jersey were born most people who came to the United States arrived in the United States were from Mexico or Central in another country. Conversely, in 31 states, fewer from Europe and Canada; in the early part of the America; the next-largest group came from Asia than 1 person in 20 was foreign born. The foreign- 20th century, 90 percent or more arrived here from and accounted for 27 percent of the total foreign- born share of the population increased in all but those areas. By the early part of the 21st century, born population. In that year, about one-fifth three states between 1999 and 2009, rising by however, only about 15 percent of legal permanent of naturalized U.S. citizens were from Mexico or 2.4 percentage points for the nation as a whole. residents were European or Canadian by birth; Central America; more than one-third were from New Jersey experienced a particularly large more than 30 percent were from Asia and another Asia. About half of the noncitizens living in the increase: The share of that state’s population that 22 percent were born in Mexico or Central Amer- United States in 2009 were from Mexico or was foreign-born increased from 15 percent in ica. The origins of people granted legal permanent Central America, and about one-fifth were from 1999 to more than 21 percent in 2009. The four residence in the United States largely translate into Asia. An estimated 62 percent of noncitizens states with the highest concentrations of unauthor- the origins of naturalized citizens some years later unauthorized to live in the United States were from ized residents in 2009 were Nevada, California, as those noncitizens become citizens. (One Mexico and another 12 percent were from Texas, and Arizona. Almost half of all unauthorized criterion for naturalized citizenship is a five-year El Salvador, Guatemala, and Honduras. residents of the United States were living in those period of residence on a permanent visa.) In 2009, states. CBO
- 10. INTRODUCTION A DESCRIPTION OF THE IMMIGRANT POPULATION: AN UPDATE 2 Foreign-born people as a group differ in several 55 percent of people from Asia had at least a were in construction, mining, agriculture, or important ways from their native-born counter- bachelor’s degree, as did 47 percent of people related occupations, compared with 5 percent of parts. In particular, compared with the native-born from Europe and Canada; just 32 percent of the native-born workers. Reflecting their high level of population, relatively few foreign-born people native-born population had earned at least a educational attainment, 39 percent of workers are under the age of 25. In 2009, only 15 percent of bachelor’s degree. More than half of the people from Asia were in the professional or technical the foreign-born population was under that age, from Mexico and Central America, 56 percent, occupations, compared with 30 percent of native- compared with 37 percent of the native-born pop- had not finished high school, but only about born workers in those occupations. ulation. In contrast, nearly three-quarters of the 10 percent of people from Asia and 6 percent of foreign-born population was of working age people from Europe and Canada had less than a The differences in educational attainment, labor (between 25 and 64 years old), compared with high school education. force participation, and concentration in particular about half of the native-born population. Marriage occupational groups were reflected in the differ- and fertility rates are generally higher among young ences in the annual earnings of foreign-born foreign-born women than among their native-born Labor Market Characteristics of workers, which also were strongly associated with citizenship status. The amount and distribution of counterparts. In 2009, 20 percent of foreign-born the Foreign-Born and Native- annual earnings were similar for naturalized and women ages 15 to 24 were (or had been) married, compared with 9 percent of native-born women; 68 Born Populations native-born citizens, but earnings tended to be percent of foreign-born women ages 25 to 34 were Foreign-born men are more likely to be working or much lower among noncitizens. The amount of (or had been) married, compared with 57 percent looking for work (that is, to be in the labor force) annual earnings among foreign-born workers also of native-born women. The fertility rate (the than are native-born men. Foreign-born women, varied greatly by country of origin. For example, in expected number of births) among foreign-born however, are less likely than native-born women to 2009 the median annual earnings of male workers women between the ages of 15 and 49 was 2.6, be in the labor force. In 2009, 93 percent of men from Mexico and Central America was $22,000. compared with a fertility rate of 2.0 for native-born ages 25 to 64 from Mexico and Central America Among male workers from Asia, the median was women in the same age range. were in the labor force, compared with 88 percent $48,000; among male workers from Europe and of men from Asia and 85 percent of native-born Canada, it was $53,000; and among native-born Educational attainment also differs considerably men. Conversely, 57 percent of women in that age male workers, it was $45,000. among foreign-born people, who overall have group from Mexico and Central America were in somewhat less education than do native-born the labor force in 2009, as were 67 percent of Asian Noncitizens tended to live in families with much people. In 2009, 29 percent of the foreign-born women, both significantly below the 74 percent of lower family income than native-born or natural- population between the ages of 25 and 64 had not native-born women in the labor force in that year. ized citizens and, as a consequence, were more completed high school, compared with 8 percent likely to have family income below the poverty of the native-born population. Some groups of Workers from Mexico and Central America are threshold (about $22,000 for a family of four in foreign-born people, however, had more education concentrated in a different set of occupations than 2009). In 2009, 25 percent of noncitizens lived in than did their native-born counterparts. About are people from other regions of the world. In poverty, compared with 11 percent of naturalized 2009, 21 percent of workers from that region citizens and 14 percent of native-born people. CBO
- 11. INTRODUCTION A DESCRIPTION OF THE IMMIGRANT POPULATION: AN UPDATE 3 Exhibit 1. From 1860 to 1910, between 13 percent and Foreign-Born Population in the United States, 1860 to 2009 15 percent of people in the United States were born somewhere else. After 1910, that share of (Millions) (Percent) the population began a steady decline, falling 45 16 to less than 5 percent by 1970, when the trend 40 reversed. Between 1970 and 2000, the foreign- 14 Share of the born population increased from 9.6 million to 35 U.S. Population 31.5 million. In the 1970s, the rate of increase 12 (Right scale) 30 was about 0.4 million people per year; in the 10 1980s, the rate was about 0.6 million people 25 8 per year; and in the 1990s, the rate was about 20 1.1 million people per year. The rate of 6 increase slowed slightly during the 2000s, 15 4 when about 0.8 million foreign-born people 10 Number were added to the U.S. population each (Left scale) 5 2 year. By 2009, 38.5 million people were for- eign born. That group constituted roughly 0 0 12.5 percent of the U.S. population, about 1860 1870 1880 1890 1900 1910 1920 1930 1940 1950 1960 1970 1980 1990 2000 2009 the same percentage as in the early part of the Sources: Congressional Budget Office based on data from Campbell J. Gibson and Emily Lennon, Historical Census 20th century. Statistics on the Foreign-Born Population of the United States: 1950–1990, Working Paper 29 (Census Bureau, Population Division, February 1999); Nolan Malone and others, The Foreign-Born Population: 2000, Census 2000 Brief (Census Bureau, December 2003); and Census Bureau, American Community Survey, 2009. CBO
- 12. INTRODUCTION A DESCRIPTION OF THE IMMIGRANT POPULATION: AN UPDATE 4 Exhibit 2. In 2009, nearly 17 million people in the Naturalized Citizens, by Period of Arrival in the United States and United States were naturalized citizens (that Birthplace, 2009 is, they were foreign-born people who became citizens by meeting the requirements of As a Percentage of: citizenship). That group constituted less than Foreign-Born half of the total U.S. foreign-born population. Percentage of Naturalized Population Naturalized citizens accounted for nearly Citizens from the Birthplace, by in the 60 percent of the foreign-born population Period of Arrival Naturalized United States Population from Asia and from Europe and Canada but Before 1990- 2000- Number Citizens in the from the of the less than a quarter of the population from Birthplace 1990 1999 2009 Total (Millions) United States Birthplacea Birthplaceb Mexico and Central America. In 2009, two- Mexico and Central America 74 19 7 100 3.5 21 24 2.3 thirds of all naturalized citizens in the United Mexico 75 18 7 100 2.6 15 23 2.3 States had arrived before 1990. About 80 per- El Salvador 74 20 6 100 0.3 2 28 4.5 cent of naturalized citizens from Cuba and Asia 37 58 Canada, but only 44 percent of those from 61 30 9 100 6.2 0.2 China, Hong Kong, and Taiwan 60 30 10 100 1.2 7 60 0.1 Africa and Oceania, had arrived before 1990. Philippines 64 27 9 100 1.1 7 66 1.2 In 2009, one-fifth of all naturalized citizens India 51 39 10 100 0.8 4 45 0.1 were from Mexico and Central America; a Vietnam 54 38 8 100 0.9 5 75 1.0 much larger share (one-half ) of all noncitizens Korea 74 20 6 100 0.6 3 56 0.8 were from those countries (see Exhibit 3). Caribbean and South America 67 24 9 100 3.0 18 50 0.7 Another 37 percent of all naturalized citizens Cuba 78 16 6 100 0.6 3 58 5.0 came from Asia, a proportion much larger Dominican Republic 60 31 9 100 0.4 2 48 3.9 than the 20 percent share of noncitizens who Europe and Canada 70 24 6 100 3.4 21 59 0.4 were from that region. Canada 81 15 4 100 0.4 2 45 1.1 Overall, in 2009, naturalized citizens consti- c Africa and Oceania 44 38 18 100 0.7 4 42 0.1 tuted only 0.3 percent of the population of their countries of birth. However, naturalized All Areas 66 26 8 100 16.8 100 44 0.3 citizens from Cuba, El Salvador, and the Dominican Republic constituted 5.0 percent, Sources: Congressional Budget Office based on data from Census Bureau, American Community Survey, 2009; and 4.5 percent, and 3.9 percent, respectively, of Central Intelligence Agency, The World Factbook (2009). the populations of those countries. Note: The resident U.S. population in 2009 was about 307 million. The countries shown, including the group consisting of China, Hong Kong, and Taiwan, accounted for the largest shares of the total foreign-born U.S. population in 2009. a. The foreign-born population is the sum of the naturalized and noncitizen populations (see Exhibit 3 for the noncitizen population). b. The birthplace population is the naturalized population as a share of the population of the region or country in which they were born. c. Includes Australia, New Zealand, and the Pacific Islands. CBO
- 13. INTRODUCTION A DESCRIPTION OF THE IMMIGRANT POPULATION: AN UPDATE 5 Exhibit 3. In 2009, 22 million people in the United Noncitizens, by Period of Arrival in the United States and States were noncitizens in one of three catego- Birthplace, 2009 ries: legal permanent residents on the path to U.S. citizenship, legal temporary residents here As a Percentage of: for a limited time, and people here without Foreign-Born authorization. (Authorized visitors, such as Percentage of Noncitizens Population tourists, are not counted in the foreign-born from the Birthplace, by in the population.) Period of Arrival Naturalized United States Population Before 1990- 2000- Number Citizens in the from the of the In 2009, about half of all the noncitizens living Birthplace 1990 1999 2009 Total (Millions) United States Birthplacea Birthplaceb in the United States had arrived after 1999. About 40 percent of all noncitizens from Mexico and Central America 24 35 41 100 10.9 50 76 7.1 Mexico 41 77 Canada, Mexico, and Central America had 25 35 40 100 8.9 8.0 El Salvador 25 33 42 100 0.8 4 72 11.6 arrived after 1999, but about two-thirds of all noncitizens from Asia and from Africa and Asia 12 22 66 100 4.4 20 42 0.1 Oceania have arrived since then. China, Hong Kong, and Taiwan 8 27 65 100 0.8 4 40 0.1 Philippines 15 20 65 100 0.6 3 34 0.6 Overall, in 2009, noncitizens living in the India 5 19 76 100 0.9 4 55 0.1 United States constituted only 0.3 percent Vietnam 16 29 56 100 0.3 1 25 0.3 of the population of their countries of birth. Korea 15 24 61 100 0.4 2 44 0.6 However, noncitizens from Mexico and Caribbean and South America 14 50 Central America constituted more than 19 28 53 100 3.0 0.7 Cuba 20 25 55 100 0.4 2 42 3.6 7.0 percent of the population in those coun- Dominican Republic 23 33 44 100 0.4 2 52 4.3 tries, including 8.0 percent of the Mexican population and 11.6 percent of the population Europe and Canada 29 25 46 100 2.4 11 41 0.3 of El Salvador. The noncitizen population Canada 35 26 39 100 0.4 2 55 1.3 in the United States from Cuba and the Africa and Oceaniac 10 21 68 100 0.9 4 58 0.1 Dominican Republic constituted 3.6 percent and 4.3 percent, respectively, of the popula- All Areas 21 29 50 100 21.6 100 56 0.3 tions of those countries. Sources: Congressional Budget Office based on data from Census Bureau, American Community Survey, 2009; and Central Intelligence Agency, The World Factbook (2009). Note: The resident U.S. population in 2009 was about 307 million. The countries shown, including the group consisting of China, Hong Kong, and Taiwan, accounted for the largest shares of the total foreign-born U.S. population in 2009. a. The foreign-born population is the sum of the naturalized and noncitizen populations (see Exhibit 2 for the naturalized population). b. The birthplace population is the noncitizen population as a share of the population of the region or country in which they were born. c. Includes Australia, New Zealand, and the Pacific Islands. CBO
- 14. Grants of Legal Permanent Resident Status CBO
- 15. GRANTS OF LEGAL PERMANENT RESIDENT STATUS A DESCRIPTION OF THE IMMIGRANT POPULATION: AN UPDATE 7 Exhibit 4. Between 2000 and 2009, 10.3 million people, Grants of Legal Permanent Resident Status During the Decade as a or 3.7 percent of the U.S. population, became Percentage of the U.S. Population in the First Year of the Decade, legal permanent residents of the United States, either as new arrivals or because of an adjust- 1860 to 2009 ment in their status. (Legal permanent resi- (Percent) dents are noncitizens who are authorized to live, work, and study in the United States per- 12 manently.) That percentage is about the same as it was during the 1920s, before the enact- 10 ment of a series of laws that placed restrictions and quotas on the immigration of people from 8 various countries. In the 1930s, the proportion of people granted 6 LPR status declined to less than 1.0 percent of the total U.S. population, in part as a result of 4 the Great Depression. In the 1940s, the rate at which LPR status was granted to people began 2 to rise, and it continued to do so through the 1990s, before falling off slightly in the 2000s. 0 The most recent decline may be the result of 1860s 1870s 1880s 1890s 1900s 1910s 1920s 1930s 1940s 1950s 1960s 1970s 1980s 1990s 2000s increased scrutiny of applications stemming Source: Congressional Budget Office based on data from Department of Homeland Security, Office of Immigration from concerns about national security. Statistics, 2009 Yearbook of Immigration Statistics (August 2010). CBO
- 16. GRANTS OF LEGAL PERMANENT RESIDENT STATUS A DESCRIPTION OF THE IMMIGRANT POPULATION: AN UPDATE 8 Exhibit 5. For much of the nation’s early history, most Percentage of Grants of Legal Permanent Resident Status, by people who emigrated to the United States Birthplace and Decade, 1860 to 2009 came from Europe and Canada. Beginning in the 1920s, however, and continuing until the (Percent) 1960s, various quotas and preferences were put Europe and Mexico and Caribbean and Africa and in place, so that by the end of the 20th cen- Canada Central America South America Asia Oceaniaa Total tury, the nation’s grants of legal permanent resident status went to people from a broader 1860–1869 100 cross section of the world’s countries. As the 1870–1879 100 proportion of people arriving from Europe and 1880–1889 100 Canada declined between the 1930s and the 1890–1899 100 1980s, grants of LPR status to people from 1900–1909 100 Asia, Mexico, and Central America steadily 1910–1919 100 1920–1929 100 increased. Since the 1970s, the largest propor- 1930–1939 100 tion of new legal permanent residents have 1940–1949 100 come from Asia. In fact, between the 1960s 1950–1959 100 and the 1980s, the share of people granted 1960–1969 100 LPR status from Asia nearly tripled. 1970–1979 100 In the 1990s, the proportion of people from 1980–1989 100 Mexico and Central America who were 1990–1999 100 granted LPR status jumped because of provi- 2000–2009 100 sions enacted in the Immigration Reform and 0 20 40 60 80 100 0 20 40 0 20 40 0 20 40 0 10 Control Act of 1986. That legislation granted LPR status to some agricultural workers and Source: Congressional Budget Office based on data from Department of Homeland Security, Office of Immigration Statistics, 2009 Yearbook of Immigration Statistics (August 2010). unauthorized residents who could prove they had been in the country continuously since at Note: Data represent the sum over each decade. least 1982. a. Includes Australia, New Zealand, and the Pacific Islands. The most notable change in the first decade of the 21st century was a decrease of about one- third (from 35 percent to 22 percent) in the share of people from Mexico and Central America granted LPR status. Over the most recent decade, one-third of all people granted LPR status were from Asia. CBO
- 17. GRANTS OF LEGAL PERMANENT RESIDENT STATUS A DESCRIPTION OF THE IMMIGRANT POPULATION: AN UPDATE 9 Exhibit 6. In fiscal year 2009, more than 1.1 million peo- Grants of Legal Permanent Resident Status, by Time and ple, about 60 percent of whom were already in Major Category of Admission, Fiscal Years 2004 and 2009 the country, were granted LPR status. Annual grants to immediate relatives of U.S. citizens 2004 2009 Percentage (including spouses, parents, and minor chil- Number Percentage Number Percentage Change, dren) and humanitarian grants to asylum (Thousands) of Total (Thousands) of Total 2004 to 2009 seekers and refugees are not capped by federal Time of Admission law, although the President sets the limit on the number of refugees who can enter the First-Time Admission to the U.S. 374 39 463 41 24 United States each year. In contrast, annual Admitted Previously, Status Changed to grants to people in the family-sponsored and Legal Permanent Resident 584 ____ 61 ____ 668 ______ 59 ____ 14 employment-based categories and under the Total 958 100 1,131 100 18 Diversity Program are capped. In 2009, almost half of all grants of LPR status (47 percent) Category of Admission went to immediate relatives of U.S. citizens. Uncapped About 19 percent were awarded under the Immediate relatives of U.S citizens 418 44 536 47 28 family-sponsored preference system (which Humanitariana 120 13 191 17 59 includes other close relatives of U.S. citizens Capped and immediate and close relatives of legal per- Family-sponsored preferences 214 22 212 19 -1 manent residents), 17 percent were awarded Employment-based preferences 155 16 144 13 -7 on humanitarian grounds (to refugees and Diversity Programb 50 ____ 5 ____ 48 ______ 4 ____ -4 asylum seekers), 13 percent were awarded Total 958 100 1,131 100 18 on the basis of employment preferences, and 4 percent were awarded under the Diversity Source: Congressional Budget Office based on data from Department of Homeland Security, Office of Immigration Program. Statistics, 2009 Yearbook of Immigration Statistics (August 2010). Between 2004 and 2009, the two uncapped a. Primarily consists of grants to refugees and asylum seekers. categories grew significantly. Grants of LPR b. The program grants legal permanent resident status to up to 50,000 people annually who are randomly selected status to immediate relatives of U.S. citizens from all applicants from countries with low rates of immigration to the United States and who meet strict eligibility increased by 28 percent, and grants to refugees requirements. See Congressional Budget Office, Immigration Policy in the United States: An Update (December and asylum seekers increased by 59 percent. 2010). Despite that latter increase, however, in 2009 more grants went to people with family-sponsored preferences (212,000 people) than to refugees or asylum seekers (191,000 people). CBO
- 18. Demographic Characteristics of the Foreign-Born and Native-Born Populations CBO
- 19. DEMOGRAPHIC CHARACTERISTICS OF THE FOREIGN-BORN AND NATIVE-BORN POPULATIONS A DESCRIPTION OF THE IMMIGRANT POPULATION: AN UPDATE 11 Exhibit 7. In 2009, three states—California, New York, Foreign-Born Population, by State of Residence, 1999 to 2009 and New Jersey—which account for more than one-fifth of the nation’s population, had a Foreign Born as a Change in the Percentage of foreign-born population that exceeded 20 per- Percentage of the Foreign Born in the cent of the state’s total population. In another State Population, 2009 State Population, 1999 to 2009 17 states, accounting for 39 percent of the State (Percentage) (Percentage points) U.S. population, foreign-born people made up Top Three States with About One-Fifth of U.S. Population between 8 percent and 19 percent of the state’s California 26.6 2.2 total. In the remaining 31 states, mostly in the New York 21.5 1.9 center of the country, fewer than 1 in 20 peo- New Jersey 21.3 6.3 ple was foreign born. Illinois was the exception All 24.4 2.7 among the Midwestern states; its foreign-born Next Seven States with About One-Fifth of U.S. Population population made up about 13.1 percent Hawaii 18.5 (about 1 in 8 people) of the state’s population 1.2 Florida 18.1 1.3 in 2009. Among the 20 states with the largest Nevada 17.4 2.2 proportion of foreign-born people, that pro- Texas 15.8 3.5 portion was 17.5 percent in 2009, up by Maryland 14.6 4.9 2.6 percentage points since 1999. (Data for District of Columbia 13.7 3.0 the combined 20 states are not shown in the Arizona 13.3 -1.0 exhibit.) All 16.2 2.4 Next Ten States with About One-Fifth of U.S. Population Illinois 13.1 3.6 Massachusetts 12.7 1.7 Connecticut 12.3 3.7 Rhode Island 12.1 2.4 Washington 11.5 2.7 New Mexico 10.1 4.2 Virginia 9.9 3.5 Colorado 9.9 2.5 Georgia 9.3 5.2 Oregon 8.1 -0.3 All 11.1 3.1 Remaining 31 States with About Two-Fifths of U.S. Population All 31 States 4.7 1.6 Total U.S. Population All States 12.4 2.4 Source: Congressional Budget Office based on monthly data from Census Bureau, Current Population Survey, Outgoing Rotation Groups, 1999 and 2009. CBO
- 20. DEMOGRAPHIC CHARACTERISTICS OF THE FOREIGN-BORN AND NATIVE-BORN POPULATIONS A DESCRIPTION OF THE IMMIGRANT POPULATION: AN UPDATE 12 Exhibit 8. Between 1999 and 2009 some states realized Twenty States with the Highest Shares of Foreign-Born People, by dramatic increases in the proportion of their population that was foreign born, others Region, 2009 showed modest growth, and the share declined (Change in the percentage of foreign-born residents in the state population, 1999 to 2009) in some states. For example, over that decade the foreign-born share of New Jersey’s popula- West Midwest South Northeast tion increased by 6 percentage points. In 2009, 8 the number of foreign-born people there Foreign Born as a had reached more than 1.8 million, or about 7 Percentage of the State Population 21 percent of the state’s population, well above New the national average of 12.4 percent. Georgia Jersey >18 Percent 6 Georgia and Maryland also experienced significant Maryland 13–18 Percent growth in the foreign-born shares of their 5 New Mexico 11–13 Percent population, which in each state rose by about 8–11 Percent 5 percentage points over the decade. By 2009, Connecticut 4 Virginia foreign-born people in Georgia numbered Illinois Texas almost 900,000, and their share of the state’s Washington 3 Colorado Rhode population had risen above 9 percent; in Island Maryland, foreign-born people numbered District of Size of Foreign-Born California Columbia Population in Each State about 800,000, almost 15 percent of that 2 Nevada New York (Millions) state’s population. Florida Massachusetts 10 1 Hawaii During the decade, the foreign-born popula- 4 tion of all western states exhibited slower 0 2 growth than the foreign-born population of Oregon 1 New Jersey, Maryland, or Georgia. In two -1 states, Arizona and Oregon, the population of Arizona foreign-born people declined as a percentage -2 of the total population. In Arizona, about 900,000 foreign-born people were living in the Source: Congressional Budget Office based on monthly data from Census Bureau, Current Population Survey, Outgoing state in 2009, accounting for about 13 percent Rotation Groups, 1999 and 2009. of the state’s population, a decline of 1 per- Note: The larger the circle, the greater the state’s population in 2009. The higher the circle is on the scale, the more centage point from the share of the foreign- its foreign-born population increased (or the less it decreased) as a percentage of the state’s total population born population in 1999. from 1999 to 2009. The darker the circle, the greater the state’s foreign-born population as a share of its total population in 2009. CBO
- 21. DEMOGRAPHIC CHARACTERISTICS OF THE FOREIGN-BORN AND NATIVE-BORN POPULATIONS A DESCRIPTION OF THE IMMIGRANT POPULATION: AN UPDATE 13 Exhibit 9. Foreign-born people are less likely to be under U.S. Population, by Age and Birthplace, 2009 the age of 25 and more likely to be of working age than native-born people. In 2009, 15 per- (Percent) cent of foreign-born people were younger than Under 25 25 to 44 45 to 64 65 or Older Total 25, compared with 37 percent of native-born people. In that year, almost three-quarters of Native Born 37 25 26 13 100 the foreign-born population was in the work- ing-age category (between 25 and 64), com- Native born to at least one foreign-born parent 56 19 12 13 100 pared with slightly more than half of the native-born population. Among the native Native born to native-born parents 34 26 28 13 100 born, those with at least one foreign-born par- ent are likely to be young: In 2009, over half of that group was under the age of 25 and less Foreign Born 15 43 30 12 100 than a third was in the working-age category. Mexico and 18 52 24 6 100 The percentage of the foreign-born population Central America age 65 or older varied significantly by region Asia 13 41 33 13 100 of origin. For example, 27 percent of U.S. residents born in Europe and Canada were Caribbean and 14 36 36 14 100 65 or older, but just 6 percent of people from South America Mexico and Central America were in that Europe and Canada 11 29 33 27 100 age group. Africa and a 21 44 28 7 100 Because people tend to arrive in the United Oceania States when they are young, immigrants from Source: Congressional Budget Office based on monthly data from Census Bureau, Current Population Survey, Outgoing regions that have been the source of most Rotation Groups, 2009. recent immigration tend to be younger than those from regions that were the primary a. Includes Australia, New Zealand, and the Pacific Islands. sources of immigration in earlier periods (see Exhibit 3). In 2009, 52 percent of foreign- born residents from Mexico and Central America, 41 percent from Asia, and 36 percent from the Caribbean and South America were between ages 25 and 44, as contrasted with 29 percent of those from Europe and Canada. CBO
- 22. DEMOGRAPHIC CHARACTERISTICS OF THE FOREIGN-BORN AND NATIVE-BORN POPULATIONS A DESCRIPTION OF THE IMMIGRANT POPULATION: AN UPDATE 14 Exhibit 10. Fertility rates (the expected number of births) Fertility Rates and Marital Status for Native-Born and Foreign-Born were higher among foreign-born women than Women Ages 15 to 49, 2009 among native-born women (2.6 births versus 2.0 births, respectively) between the ages of 15 All Women Birthplace of Foreign-Born Women and 49 in 2009. Those rates varied consider- Native Foreign Mexico and Caribbean and Europe and Africa and ably, however, depending on the country of Age Born Born Central America Asia South America Canada Oceaniaa birth, with a high of 3.3 for women from Mex- b Fertility Rate ico and Central America and a low of 2.0 for women from Europe and Canada. 15 to 24 0.6 0.7 1.3 0.3 0.5 0.3 0.4 25 to 34 1.0 1.3 1.4 1.2 1.1 1.1 1.8 Among the youngest group (ages 15 to 24), 35 to 49 0.4 ___ 0.6 ___ 0.6 ___ 0.7 ___ 0.5 ___ 0.6 ___ 0.8 ___ women from Mexico and Central America Total, 15 to 49 2.0 2.6 3.3 2.1 2.2 2.0 3.0 had the highest fertility rate (1.3 births per woman) and the largest share (27 percent) Percentage with One or More Children in the Household with at least one child. That group of women 15 to 24 11 16 27 7 10 7 8 also had the highest marriage rate—about 25 to 34 52 55 66 46 50 44 49 28 percent were, or had been, married. Fertil- 35 to 49 66 74 70 73 71 69 72 ity rates among native-born women (0.6 births per woman) were somewhat higher in that age c Percentage Ever Married group than among women from Asia or 15 to 24 9 20 28 15 14 12 10 women from Europe and Canada (0.3 births 25 to 34 57 68 67 72 62 69 65 per woman). Women born in Africa or 35 to 49 83 87 84 91 83 91 86 Oceania had a relatively low rate of childbirth 8 in the youngest group, but between the ages Source: Congressional Budget Office based on data from Census Bureau, American Community Survey, 2009. of 25 and 34, their fertility rate was compara- a. Includes Australia, New Zealand, and the Pacific Islands. tively high, at 1.8 births per woman. b. The expected number of births to a woman in a particular age range if, at each age within the range, the likelihood Foreign-born women from any region were that she gave birth was equal to the share of women at that age who bore a child during the survey year. more likely than native-born women to marry c. Consists of all women who are married, divorced, separated, or widowed. before age 25 or between the ages of 25 and 34. Between the ages of 35 and 49, those gaps had narrowed, and native-born women were about as likely as women from Mexico and Central America or the Caribbean and South America to have married. CBO
- 23. DEMOGRAPHIC CHARACTERISTICS OF THE FOREIGN-BORN AND NATIVE-BORN POPULATIONS A DESCRIPTION OF THE IMMIGRANT POPULATION: AN UPDATE 15 Exhibit 11. Overall, the foreign-born population tends to Educational Attainment of People Ages 25 to 64, by Birthplace, 2009 have completed less education than the native- born population, although some groups match (Percent) or exceed native-born citizens’ attainment. In Some 2009, 29 percent of the foreign-born popula- Less Than College or Master’s tion between the ages of 25 and 64 had not High School High School Associate’s Bachelor’s Degree or Diploma or GED Diploma or GED Degree Degree More Total completed high school or received a GED, compared with about 8 percent of the native- Native Born 8 37 31 30 21 11 100 born population. However, the percentages of people who had completed a bachelor’s degree Native born to at least 8 56 24 29 25 13 100 or more were similar: Twenty-nine percent of one foreign-born parent the foreign-born population and 32 percent Native born to of the native-born population had at least a 8 34 31 30 21 10 100 native-born parents bachelor’s degree. The educational attainment of foreign-born Foreign Born 29 25 16 18 11 100 people in the United States varies considerably Mexico and by region of birth. In 2009, people from Mex- 56 26 11 5 2 100 Central America ico and Central America, as a group, had com- Asia 10 19 16 33 22 100 pleted less education than had native-born people or people from other regions. A major- Caribbean and 16 32 25 18 9 100 ity, about 56 percent, of people from Mexico South America and Central America had less than a high Europe and Canada 6 24 23 27 20 100 school diploma or GED, and only 7 percent had a bachelor’s degree or more. By contrast, Africa and 9 24 24 25 17 about 10 percent of people from Asia had a 100 Oceania less than a high school diploma or GED, and Source: Congressional Budget Office based on monthly data from Census Bureau, Current Population Survey, Outgoing 55 percent had completed a bachelor’s degree Rotation Groups, 2009. or more; 6 percent of people from Europe and a. Includes Australia, New Zealand, and the Pacific Islands. Canada had less than a high school diploma or GED, and 47 percent had completed a bachelor’s degree or more. CBO