imagine
all the
people
Irish
CITY OFBOSTON
Martin J. Walsh
Mayor
2016
Irish in Boston
“imagine all the people” is a series of publica ons pro-
duced by the Boston Redevelopment Authority for the
Mayor’s Office of Immigrant Advancement. The series
provides a comprehensive profile of Boston’s diverse
immigrant communi es and their numerous contribu-
ons to the city’s social, cultural and economic land-
scape. It is part of an ongoing effort to celebrate immi-
grants and gain insight into how they shape our city.
Mayor Walsh, US ambassador to Ireland Kevin O'Malley and Boston Photographer Bill Bre at
Greenhill's Bakery in Dorchester, Jeremiah Robinson
Irish step dancers at Fenway Park, Don Harney
2.
2
Ireland has along history of emigra on, but since the 1990s Ireland has
consistently had posi ve net migra on.1
Irish immigra on to the United
States extends back to before the Revolu onary War. In the early 1800s,
thousands of Irish Catholic men began moving to the urban centers of the
Northeast to take advantage of job opportuni es on construc on projects
such as the Erie Canal. During and following the Great Irish Famine of 1845-
1852, millions of Irish families arrived in the United States looking to escape
these condi ons. The Famine killed as many as one million people, or 12
percent of Ireland’s popula on, and began a period of popula on decline in
Ireland that lasted for more than half a century. Many of the Irish immi-
grants who came to America during the second half of the nineteenth cen-
tury se led in already established Irish communi es in New York and Bos-
ton. The Irish once were the largest foreign-born popula on in Boston, but
today, although large shares of the city’s popula on have Irish ancestry,
the foreign-born popula on is declining. The Irish economy has grown rap-
idly and the country has a racted many immigrants of its own.
Only the United Kingdom has a larger foreign-born Irish popula on than
the United States, while Australia is the third largest des na on of Irish.2
Massachuse s has the 3rd largest share (12 percent) of the es mated
125,0223
foreign-born Irish living in the United States in 2014. States with
the largest concentra ons of Irish include New York (22 percent) and Cali-
fornia (17 percent).
Irish pubs on Union Street, Chris na Kim
3.
3
Popula on Share
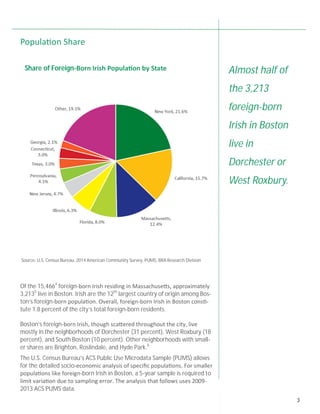
Almosthalf of
the 3,213
foreign-born
Irish in Boston
live in
Dorchester or
West Roxbury.
Share of Foreign-Born Irish Popula on by State
Source: U.S. Census Bureau, 2014 American Community Survey, PUMS, BRA Research Division
Of the 15,4664
foreign-born Irish residing in Massachuse s, approximately
3,2135
live in Boston. Irish are the 12th
largest country of origin among Bos-
ton’s foreign-born popula on. Overall, foreign-born Irish in Boston cons -
tute 1.8 percent of the city’s total foreign-born residents.
Boston’s foreign-born Irish, though sca ered throughout the city, live
mostly in the neighborhoods of Dorchester (31 percent), West Roxbury (18
percent), and South Boston (10 percent). Other neighborhoods with small-
er shares are Brighton, Roslindale, and Hyde Park.6
The U.S. Census Bureau’s ACS Public Use Microdata Sample (PUMS) allows
for the detailed socio-economic analysis of specific popula ons. For smaller
popula ons like foreign-born Irish in Boston, a 5-year sample is required to
limit varia on due to sampling error. The analysis that follows uses 2009-
2013 ACS PUMS data.
4.
4
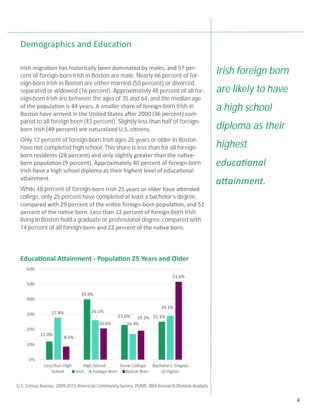
Irish foreign born
arelikely to have
a high school
diploma as their
highest
educa onal
a ainment.
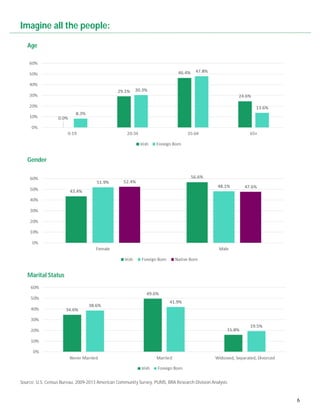
Educa onal A ainment - Popula on 25 Years and Older
Demographics and Educa on
Irish migra on has historically been dominated by males, and 57 per-
cent of foreign-born Irish in Boston are male. Nearly 66 percent of for-
eign-born Irish in Boston are either married (50 percent) or divorced,
separated or widowed (16 percent). Approximately 48 percent of all for-
eign-born Irish are between the ages of 35 and 64, and the median age
of the popula on is 44 years. A smaller share of foreign-born Irish in
Boston have arrived in the United States a er 2000 (36 percent) com-
pared to all foreign born (43 percent). Slightly less than half of foreign-
born Irish (49 percent) are naturalized U.S. ci zens.
Only 12 percent of foreign-born Irish ages 25 years or older in Boston
have not completed high school. This share is less than for all foreign-
born residents (28 percent) and only slightly greater than the na ve-
born popula on (9 percent). Approximately 40 percent of foreign-born
Irish have a high school diploma as their highest level of educa onal
a ainment.
While 48 percent of foreign-born Irish 25 years or older have a ended
college, only 25 percent have completed at least a bachelor’s degree,
compared with 29 percent of the en re foreign-born popula on, and 52
percent of the na ve born. Less than 12 percent of foreign-born Irish
living in Boston hold a graduate or professional degree, compared with
14 percent of all foreign-born and 22 percent of the na ve born.
U.S. Census Bureau, 2009-2013 American Community Survey, PUMS, BRA Research Division Analysis
5.
5
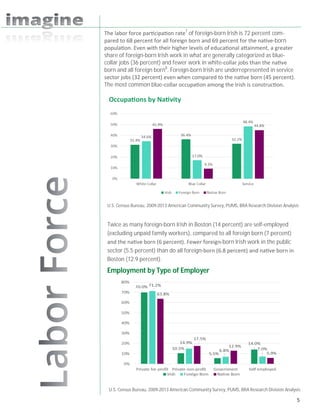
The labor forcepar cipa on rate7
of foreign-born Irish is 72 percent com-
pared to 68 percent for all foreign born and 69 percent for the na ve-born
popula on. Even with their higher levels of educa onal a ainment, a greater
share of foreign-born Irish work in what are generally categorized as blue-
collar jobs (36 percent) and fewer work in white-collar jobs than the na ve
born and all foreign born8
. Foreign-born Irish are underrepresented in service
sector jobs (32 percent) even when compared to the na ve born (45 percent).
The most common blue-collar occupa on among the Irish is construc on.
Occupa ons by Na vity
U.S. Census Bureau, 2009-2013 American Community Survey, PUMS, BRA Research Division Analysis
Twice as many foreign-born Irish in Boston (14 percent) are self-employed
(excluding unpaid family workers), compared to all foreign born (7 percent)
and the na ve born (6 percent). Fewer foreign-born Irish work in the public
sector (5.5 percent) than do all foreign-born (6.8 percent) and na ve born in
Boston (12.9 percent).
Employment by Type of Employer
U.S. Census Bureau, 2009-2013 American Community Survey, PUMS, BRA Research Division Analysis
9
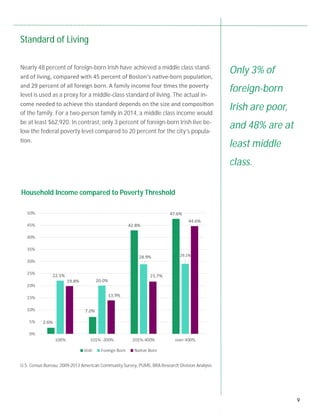
Only 3% of
foreign-born
Irishare poor,
and 48% are at
least middle
class.
Nearly 48 percent of foreign-born Irish have achieved a middle class stand-
ard of living, compared with 45 percent of Boston’s na ve-born popula on,
and 29 percent of all foreign born. A family income four mes the poverty
level is used as a proxy for a middle-class standard of living. The actual in-
come needed to achieve this standard depends on the size and composi on
of the family. For a two-person family in 2014, a middle class income would
be at least $62,920. In contrast, only 3 percent of foreign-born Irish live be-
low the federal poverty level compared to 20 percent for the city’s popula-
on.
Household Income compared to Poverty Threshold
Standard of Living
U.S. Census Bureau, 2009-2013 American Community Survey, PUMS, BRA Research Division Analysis
10.
10
Conclusion
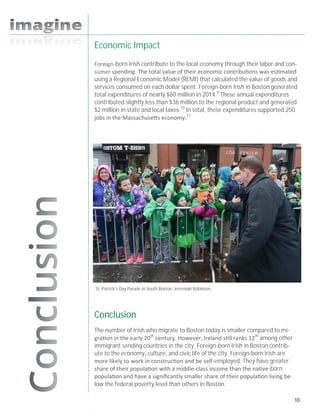
Foreign-born Irish contributeto the local economy through their labor and con-
sumer spending. The total value of their economic contribu ons was es mated
using a Regional Economic Model (REMI) that calculated the value of goods and
services consumed on each dollar spent. Foreign-born Irish in Boston generated
total expenditures of nearly $60 million in 2014.9
These annual expenditures
contributed slightly less than $36 million to the regional product and generated
$2 million in state and local taxes.10
In total, these expenditures supported 250
jobs in the Massachuse s economy.11
The number of Irish who migrate to Boston today is smaller compared to mi-
gra on in the early 20th
century. However, Ireland s ll ranks 12th
among other
immigrant sending countries in the city. Foreign-born Irish in Boston contrib-
ute to the economy, culture, and civic life of the city. Foreign-born Irish are
more likely to work in construc on and be self-employed. They have greater
share of their popula on with a middle-class income than the na ve-born
popula on and have a significantly smaller share of their popula on living be-
low the federal poverty level than others in Boston.
Economic Impact
St. Patrick’s Day Parade in South Boston, Jeremiah Robinson
11.
11
1
Ruhs, M andQuinn, E., Ireland: From Rapid Immigra on to Recession, Migra on Policy
Ins tute (2009).
2
UNICEF Migra on Profiles, 2013.
3
American Fac inder website Table B05006 reports 125,022 Irish residing in the United
States in 2014 with a margin of error of +/- 5,318. The 124,622 es mate reported for
this analysis was tabulated from 2014 U.S. Census Bureau Public Use Microdata Sample
data. Both es mates contain a margin of error due to sampling methodology. For more
informa on on American Fact Finder please see: h p://fac inder.census.gov/home/
saff/main.html?_lang=en.
4
American Fac inder website Table B05006 reports 15,777 Irish residing in Massachu-
se s with a margin of error of +/- 2,118 in 2014. The 15,466 es mate reported for this
analysis was tabulated from 2014 U.S. Census Bureau Public Use Microdata Sample da-
ta. Both es mates contain a margin of error due to sampling methodology. Lower sur-
vey response rates due to documenta on issues may result in an undercount of the
popula on.
5
American Fac inder website Table B05006 reports 3,240 Irish in Boston with a margin
of error of +/- 922 in 2014. The 2014 U.S. Census Bureau Public Use Microdata Sample
data es mates 3,213 foreign-born Irish for Boston. Both es mates contain a margin of
error due to sampling methodology.
6
2009-2013 American Community Survey, American Fac inder, BRA Research Analysis.
7
Defined as the share of the working-age popula on that is either currently employed
or seeking work. U.S. Department of Labor, Bureau of Labor Sta s cs. (2016).
8
For a smaller popula on like foreign-born Irish in Boston, occupa ons fall into three
broad categories. White collar includes managerial & professional, health care, educa-
on, and arts, design entertainment, sports & media occupa ons. Service includes ser-
vice, sales, office & administra ve support, community & social service occupa ons.
Blue collar includes construc on, farming, fishing, and forestry, and produc on occupa-
ons. Military specific occupa ons and long-term unemployed are excluded from the
analysis.
9
BRA Research Division Analysis, 2014, Regional Economic Model, Inc., REMI.
10
BRA Research Division Analysis, 2014, Regional Economic Model, Inc., REMI.
11
BRA Research Division Analysis, 2014, Regional Economic Model, Inc., REMI.
12.
12
Produced by theResearch Division
Alvaro Lima, Director of Research
Jonathan Lee– Deputy Director
Chris na Kim – Research Manager
Phillip Granberry – Senior Researcher/Demographer
Ma hew Resseger – Senior Researcher/Economist
Kevin Kang – Research Associate
Kevin Wandrei – Research Assistant
Interns:
Xiaoxiao Ma
Michael Bratsis
Map by the Digital Cartography & GIS
Alla Ziskin
Brian P. Golden, Director


![NYC, Race, Covid-19 [timestamp Jun 12, 2020]](https://cdn.slidesharecdn.com/ss_thumbnails/nycracecovid-192020jun12-200715145521-thumbnail.jpg?width=640&height=640&fit=bounds)


