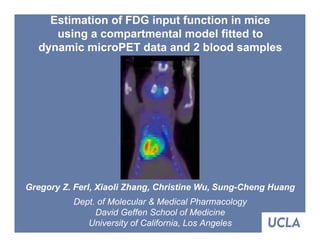
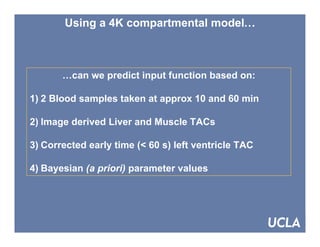
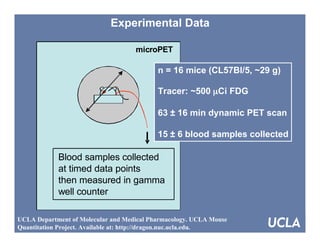
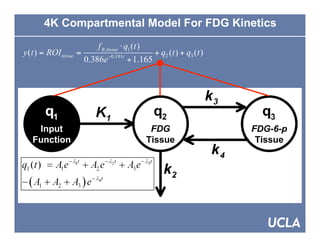
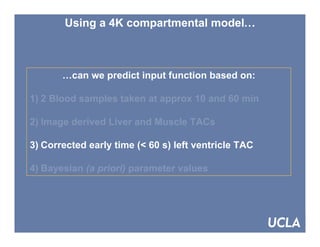
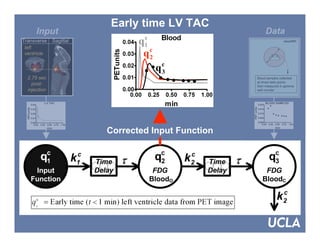
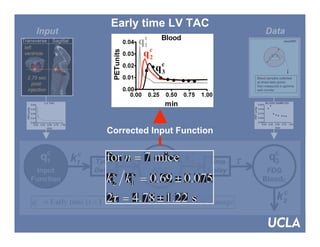
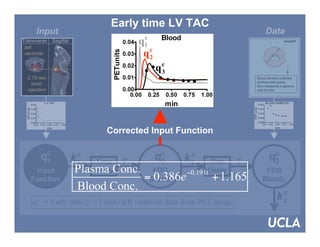
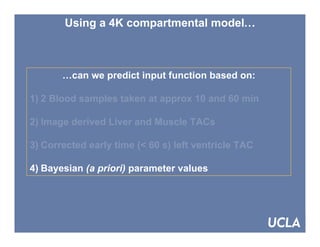
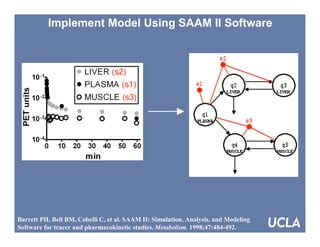
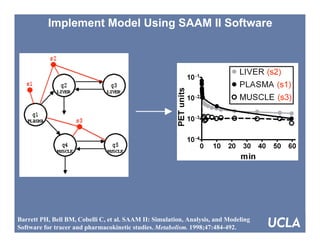
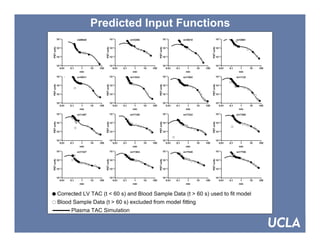
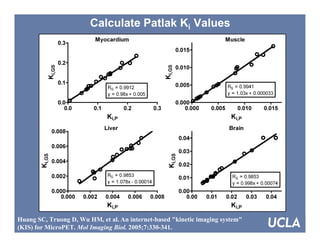
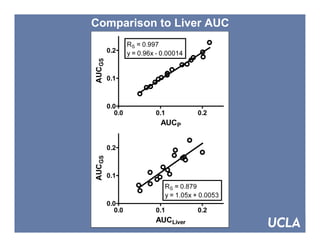
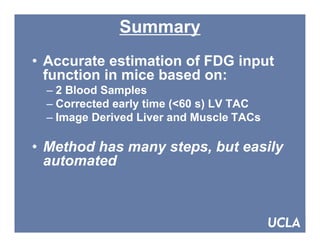
Ferl GZ, Wu HM, Zhang X, Huang SC (2007), “Estimation of FDG input function in mice using a compartmental model fitted to dynamic microPET data and 2 blood samples”, Society of Nuclear Medicine 54th Annual Meeting, Washington DC.
Top Rated Bangalore Call Girls Richmond Circle ⟟ 8250192130 ⟟ Call Me For Gen...
SNM 2007, Washington DC
1. Estimation of FDG input function in mice
using a compartmental model fitted to
dynamic microPET data and 2 blood samples
Gregory Z. Ferl, Xiaoli Zhang, Christine Wu, Sung-Cheng Huang
Dept. of Molecular & Medical Pharmacology
David Geffen School of Medicine
University of California, Los Angeles
2. Using a 4K compartmental model…
…can we predict input function based on:
1) 2 Blood samples taken at approx 10 and 60 min
2) Image derived Liver and Muscle TACs
3) Corrected early time (< 60 s) left ventricle TAC
4) Bayesian (a priori) parameter values
3. Experimental Data
microPET
n = 16 mice (CL57Bl/5, ~29 g)
Tracer: ~500 µCi FDG
63 ± 16 min dynamic PET scan
15 ± 6 blood samples collected
Blood samples collected
at timed data points
then measured in gamma
well counter
UCLA Department of Molecular and Medical Pharmacology. UCLA Mouse
Quantitation Project. Available at: http://dragon.nuc.ucla.edu.
5. 4K Compartmental Model For FDG Kinetics
f B ,tissue quot; q1 (t )
y (t ) = ROI tissue + q2 (t ) + q3 (t )
= !0.191t
0.386e + 1.165
6. Using a 4K compartmental model…
…can we predict input function based on:
1) 2 Blood samples taken at approx 10 and 60 min
2) Image derived Liver and Muscle TACs
3) Corrected early time (< 60 s) left ventricle TAC
4) Bayesian (a priori) parameter values
7. Drawing the LV ROI
Transverse (-9.07 mm)
1.75 s 2.25 s 2.75 s 3.25 s 54 min
R. Ventricle Lungs L. Ventricle Systemic L. Ventricle
Coronal (-4.00 mm)
8. Early time LV TAC
Data
Input
microPET
Correct for:
-Partial volume effects
-Delay Blood samples collected
-Dispersion at timed data points
then measured in gamma
well counter
9. Early time LV TAC
Data
Input
c
q microPET
1
qc
2
qc
3
Blood samples collected
at timed data points
then measured in gamma
well counter
Corrected Input Function
10. Early time LV TAC
Data
Input
c
q microPET
1
qc
2
qc
3
Blood samples collected
at timed data points
then measured in gamma
well counter
Corrected Input Function
11. Early time LV TAC
Data
Input
c
q microPET
1
qc
2
qc
3
Blood samples collected
at timed data points
then measured in gamma
well counter
Corrected Input Function
Plasma Conc.
= 0.386e !0.191t + 1.165
Blood Conc.
12. Using a 4K compartmental model…
…can we predict input function based on:
1) 2 Blood samples taken at approx 10 and 60 min
2) Image derived Liver and Muscle TACs
3) Corrected early time (< 60 s) left ventricle TAC
4) Bayesian (a priori) parameter values
13. Bayesian Values
quot; !t
Model : f ( A, ! ) = Ae
2
! p # Mean )quot;
(
2
v $i pi
%
J ( p ) = WRSS + ( 2
SDpi
$ %
i =1
& '
Callegari T, Caumo A, Cobelli C. Generalization of map estimation in SAAM II:
validation against ADAPT II in a glucose model case study. Ann Biomed Eng.
2002;30:961-968.
14. Bayesian Values
quot; !t
Model : f ( A, ! ) = Ae
2
! p # Mean )quot;
(
2
v $i pi
%
J ( p ) = WRSS + ( 2
SDpi
$ %
i =1
& '
Callegari T, Caumo A, Cobelli C. Generalization of map estimation in SAAM II:
validation against ADAPT II in a glucose model case study. Ann Biomed Eng.
2002;30:961-968.
15. Bayesian Values
quot; !t
Model : f ( A, ! ) = Ae
2
! p # Mean )quot;
(
2
v $i pi
%
J ( p ) = WRSS + ( 2
SDpi
$ %
i =1
& '
Callegari T, Caumo A, Cobelli C. Generalization of map estimation in SAAM II:
validation against ADAPT II in a glucose model case study. Ann Biomed Eng.
2002;30:961-968.
16. Calculate Bayesian Values
FIT TO ALL BLOOD & TISSUE DATA FROM 6 RANDOMLY
SELECTED MOUSE STUDIES
Objective Function
2
15 ! p # Mean
)quot;
(
v i pi
J ( p ) = f (WRSS ) + ( $ %
2
SDpi
i =1 $ %
& '
18. Implement Model Using SAAM II Software
Barrett PH, Bell BM, Cobelli C, et al. SAAM II: Simulation, Analysis, and Modeling
Software for tracer and pharmacokinetic studies. Metabolism. 1998;47:484-492.
19. Implement Model Using SAAM II Software
Barrett PH, Bell BM, Cobelli C, et al. SAAM II: Simulation, Analysis, and Modeling
Software for tracer and pharmacokinetic studies. Metabolism. 1998;47:484-492.
23. Summary
• Accurate estimation of FDG input
function in mice based on:
– 2 Blood Samples
– Corrected early time (<60 s) LV TAC
– Image Derived Liver and Muscle TACs
• Method has many steps, but easily
automated
24. Acknowledgements
UCLA Animal Imaging Huang Lab
Blood Sampling
Facility (Crump Institute)
Dr. K.P. Wong
Dr. David Stout
Hillary Protas
Dr. Arion Chatziioannou
James Yu
Waldemar Ladno
Mirwais Wardak
Judy Edwards
Antonia Luu
Computer Support
David Truong
UCLA Cyclotron Laboratory
David Vu
Dr. Nagichettiar Satyamurthy
Weber Shao
and staff
UCLA Scholars in Oncologic Molecular Imaging (SOMI) Program
(NCI Cancer Education Grant R25-CA098010)
DOE Contract DE-FC03-02ER63420
NIH Grants R01-EB001943, P50-CA086306