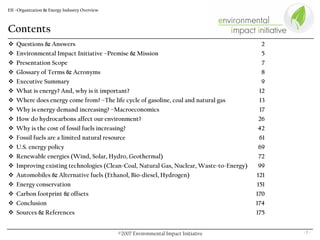
SlideShare a Scribd company logo
Environmental Impact Initiative (EII)
       Organization & Energy Industry Overview


Managing Director
David A. Champion

Revision Date: October 18, 2007
EII –Organization & Energy Industry Overview


Contents
    Questions & Answers                                                                    2
    Environmental Impact Initiative –Premise & Mission                                     5
    Presentation Scope                                                                     7
    Glossary of Terms & Acronyms                                                           8
    Executive Summary                                                                      9
    What is energy? And, why is it important?                                              12
    Where does energy come from? –The life cycle of gasoline, coal and natural gas         13
    Why is energy demand increasing? –Macroeconomics                                       17
    How do hydrocarbons affect our environment?                                           26
    Why is the cost of fossil fuels increasing?                                           42
    Fossil fuels are a limited natural resource                                            61
    U.S. energy policy                                                                    69
    Renewable energies (Wind, Solar, Hydro, Geothermal)                                   72
    Improving existing technologies (Clean-Coal, Natural Gas, Nuclear, Waste-to-Energy)   99
    Automobiles & Alternative fuels (Ethanol, Bio-diesel, Hydrogen)                       121
    Energy conservation                                                                   151
    Carbon footprint & offsets                                                            170
    Conclusion                                                                            174
    Sources & References                                                                  175


                                                                                                –2–
                                               ©2007 Environmental Impact Initiative
EII


Questions:
1.    The United States represents 5% of the earth’s population; what percent of the world’s greenhouse gas
      emissions do we emit?
2.    What percent of waste does America recycle?
3.    How much carbon dioxide does 1 gallon of gasoline produce?
4.    What is the federally mandated fuel economy standard in the U.S.?
5.    If every car in the U.S. increased its fuel efficiency by 7.6 miles per gallon, we could stop importing oil from
      which global region?
6.    If the United States became solely dependent upon its own domestic production of oil from current wells to
      fuel our economy, how long could we sustain our current consumption rates?
7.    What costs more 1 gallon (8 x 16 oz. bottles) of filtered water, or one gallon of regular unleaded gasoline?
8.    How many trees would the average U.S. household have to plant each year to absorb the amount of carbon
      dioxide they emit?
9.    Where does our electricity come from in the United States?
10. How many children today have asthma in the United States?
11. How many of the contiguous 48 states is it NOT permissible to eat all types of fresh water fish due to high
    levels of mercury?
12. Two of the fastest growing renewable energy generation methods are Solar and Wind, where were these
    technologies invented?


                                                                                                                         –3–
                                            ©2007 Environmental Impact Initiative
EII


Answers:
1.    The United States emits 30% of the world’s greenhouse gases. The average U.S. household emits 41,800 lbs.
      of carbon dioxide or 5 times the average global household quantity.
2.    According to the U.S. EPA, Americans dispose of 250 million tons of municipal solid waste per year (4.5 lbs.
      per person/per day) and recycle 23.8% of this waste and compost 8.4%.
3.    1 gallon of gasoline at 6.3 lbs. produces 19.4 lbs. of carbon dioxide, this is because when hydrocarbons burn,
      the carbon molecules are combined with two oxygen molecules to form CO2, which is 3 times heavier than
      the original gasoline. The average car burns its weight in CO2 every 4 months.
4.    In 1987 the U.S. fuel economy was 22.1 miles per gallon (mpg) for light-duty vehicles and was reduced to
      20.9mpg in 1997 and then 21.0mpg in 2006, remaining relatively unchanged for over 20 years.
5.    7.6 more miles/gal. on every car in the U.S. would result in independence from Middle East oil imports.
6.    The U.S. holds about 680 million barrels of strategic oil reserves, produces 4.66MM barrels per day
      domestically, but consumes 21MM barrels per day resulting in only 40 days of domestically available oil.
7.    The average U.S. price for a 16oz. bottle of purified water is $1.00 x 8 = $8.00/gallon or 2.5 times more than a
      gallon of gasoline. Americans consumed 8.3billion gallons of bottled water in 2006, costing $66.4bn dollars.
8.    The average mature tree consumes about 48 lbs. of CO2 per annum. If the average U.S. household emits 41,800
      lbs. of carbon dioxide, each household would need to plant 871 trees per year to be carbon neutral.
9.    49% of our electricity comes from coal-fired power plants, 20% from natural gas, 19.4% from nuclear, 7%
      hydroelectric, 2.4% from renewable energy sources such as, biofuels, waste to energy, solar and wind.
10. Asthma currently affects 6.2 million children and is the most common chronic childhood disorder, it is the
    leading cause of absenteeism in schools. 80% of asthmatic cases, especially in Black and Hispanic children
    takes place in industrial regions that do not meet U.S. EPA federal air pollution standards.
11. You cannot eat all types of fresh water fish in 44 states due to high levels of mercury. The burning of coal and
    mining causes the majority of mercury, lead, and arsenic poisoning in the United States.
12. Both solar and wind electrical generation were invented in the U.S.A., however both of these technologies are
    now predominantly supplied by German, Japanese, and Chinese companies.
                                                                                                                    –4–
                                            ©2007 Environmental Impact Initiative
EII


The Environmental Impact Initiative -Premise
The questions and answers on the previous pages are meant to be thought provoking and provide
examples of the energy related challenges that exist today both globally and in the U.S. These
challenges are summarized below:

      There exists today an uncertain and diminishing supply of conventional energy sources at
      affordable prices to meet a growing world demand.
      Fossil fuels used as the primary energy source, cause human and environmental harm.
      Poor waste management and a lack of sustainable business practices affect our natural resources
      such as water, soil, air, and forests.
       Animosity towards the U.S. based on our per capita energy use and pollution emissions will only
      increase unless we take a leadership role in environmental stewardship, sustainable product
      development, renewable energy projects and international energy policy.

Be sure that these issues will define this new millennium. The solutions to these challenges rest in
our ability to adopt energy efficient practices and products, in our ability to develop economically
viable renewable energies, to produce alternative transportation vehicles and fuels, and in managing
our waste and pollution emissions with the goal of protecting our valuable natural resources and
progressing a sustainable energy future.
The Environmental Impact Initiative (EII) was created to be the vehicle through which we
communicate the above issues, research affordable and actionable solutions, and through our
members and sponsors, we make these solutions a reality.


                                                                                                    –5–
                                        ©2007 Environmental Impact Initiative
EII


The Environmental Impact Initiative -Mission
Mission Statement:
To initiate environmental stewardship with businesses and residents by demonstrating the positive
financial and social impacts of resource preservation, energy conservation, pollution minimization
and waste management best-practices within the urban setting.
Vision:
Pollution controls, waste management, renewable energies, energy-efficient technologies, and
environmental best-practices will protect our depleting natural resources, provide sustainable
energy to the masses, and will yield both ecological as well as financial benefits to the cities in
which we execute our mission.
Guiding Principles:
  Lead by example, be a catalyst for positive environmental change at home and in your community
  Solutions must be financially and environmentally justified to be sustainable
  Tirelessly research and analyze new products, technologies and practices to establish best-in-class
  solutions
  Remain politically neutral as pollution, resource depletion, and improving our living environment
  equally impacts every person despite their political preference
  Focus on positive messages, benefits and actions
  Build an effective and active membership based upon these key traits: trust, honesty, diversity,
  mutual respect, complete communication, a shared vision, and a collaborative effort focused on
  results
  All funding and use of monies will be made transparent to sponsors and members
  Perform every task with a sense of urgency
                                                                                                 –6–
                                    ©2007 Environmental Impact Initiative
EII


EII: Research, Promote, Act
Research: The environmental impact initiative will tirelessly research and analyze products,
services, companies, and processes which will fulfill our mission statement. The EII will act
as a resource for other institutions and clients, therefore must stay abreast of the latest
environmental and energy trends. Research tools include various publications, industry or
technology expert reviews, company specific meetings, research papers done by financial or
academic institutions, and from meetings with other energy/environmental groups.
Promote: Education and public awareness are at the forefront of long-term, sustainable
changes and social movements. Clients must be aware of the issues and potential solutions in
order to properly act. The use of billboards, newsprint, promotional products, and our
website will be used to create awareness. Presentations at schools, businesses, and
environmental events will help educate the public. Hosting large environmental seminars
with expert discussion panels, company/product overviews, and subject specific breakout
sessions will help promote the adoption and investment in our subject matter. A strong and
diverse social network of EII members and sponsors will help spread the word.
Act: Through our sponsors and members we will work to implement the services, products,
technologies, processes and practices that we promote. Action can take many forms:
volunteer work at an environmental community project, writing and implementing a best-in-
class recycling program for a commercial office building, motivating residents or businesses to
better insulate their homes or purchase energy-efficient appliances, working with target
businesses to evaluate the implementation of solar panels on their property and working with
city or state officials to influence policy, promote renewable projects, carbon offsets, energy-
efficient products or purchasing fuel efficient vehicles.
                                                                                             –7–
                                  ©2007 Environmental Impact Initiative
EII


Presentation Scope

This presentation is designed to:

      Provide potential members and sponsors with an overview and purpose of the EII organization

      Articulate the EII view of the energy industry, current issues, and viable solutions

      Validate our view with factual data, detailed references, and expert advice

      Inspire our audience to make changes in their own lives and to be a positive example for others

      To recruit members and sponsors


                                                                                                    –8–
                                        ©2007 Environmental Impact Initiative
EII


Glossary of Terms & Acronyms
AEO – Annual Energy Outlook                        LNG – Liquid Natural Gas
Bbls – Billion Barrels of Oil                      MCF – Thousand Cubic Feet
BTU – British Thermal Unit                         MTOE – Million Tonnes Oil Equivalence
CO2 – Carbon Dioxide                               MW – MegaWatt
CNG – Compressed Natural Gas                       NAP –Northern Appalachian Coal
DOE – U.S. Department of Energy                    NG – Natural Gas
EIA – U.S. Energy Information Administration       Non-OECD – Non members of the OECD
EII – Environmental Impact Initiative              OECD – Organisation for Economic Co-
                                                   operation & Development
EPA – U.S. Environmental Protection Agency
                                                   OPEC – Organization of the Petroleum
EtOH - Ethanol
                                                   Exporting Countries
EU – European Union
                                                   PTW – Pump to Wheels
FC – Fuel Cell
                                                   PV – PhotoVoltaic –solar cells
FCV – Fuel Cell Vehicle
                                                   R&D –Research & Development
GDP – Gross Domestic Product
                                                   RFG – ReFormulated Gasoline (regular gasoline
GHG – Greenhouse Gas                               blended with ethanol)
H or H2 - Hydrogen                                 TCF – Trillion Cubic Feet
HEV – Hybrid Electric Vehicle                      TW – Terawatts (1 trillion watts)
ICE – Internal Combustion Engine                   USD – United States Dollar
ICEV – Internal Combustion Engine Vehicle          WTI – West Texas Intermediate –crude oil
IEA – International Energy Agency                  designation
kWh – KiloWatt Hour                                WTP – Well to Pump
LDV –Light Duty Vehicle                            WTW – Well to Wheel
                                                                                               –9–
                                  ©2007 Environmental Impact Initiative
EII


Executive Summary
      World energy demand is increasing at a rate of 1.8% per annum, due to global population growth, the
      industrialization of China and India, and the desire of industrialized nations to continue to grow their own
      gross domestic products.
      87.5% of the world’s energy currently comes from the burning of hydrocarbons (fossil fuels). Electricity is
      primarily generated by coal and natural gas, whereas transportation fuels come from petroleum.
      As fossil fuels are burned and converted into energy, they release carbon dioxide as well as a variety of other
      harmful greenhouse gases and pollutants. Scientists and politicians around the world now believe that the
      continued use of fossil fuels negatively impacts human health, the environment as well as geo-political
      stability. As a result, hydrocarbons carry with them a very high societal cost.
      Fossil fuel prices will remain relatively high vs. historical values. Prices will be driven by increased global
      demand, resource depletion, marginal cost increases in extracting more difficult unconventional sources,
      higher refinement costs of heavier more sulfur laden oil, transporting fuels from greater distances,
      production constraints of petroleum providers and the additional cost of pollution controls.
      Fossil fuels are a limited natural resource. As these increasingly important and costly resources diminish we
      are seeing examples of protectionism, fascism, and war play out on the global stage.
      Energy independence needs to become a primary objective of the United States. Reducing our dependency
      upon foreign energy supplies, minimizing energy price fluctuations, and diversifying our energy portfolio
      means long-term economic stability for America.
      The United States will follow the rest of the world with some form of a carbon tax or carbon cap and trade
      proposal in efforts to reduce greenhouse gas emissions, but will most likely not mandate the change until the
      next presidential election in 2009 or until the next evolution of the Kyoto protocol envisioned by 2012.


                                                                                                                        – 10 –
                                           ©2007 Environmental Impact Initiative
EII


Executive Summary –(continued)
      Federal and state governments as well as concerned citizen utility boards work to keep our gas prices and
      utility costs low by mandating utility price caps on electricity, maintaining low taxes on gasoline and other
      fuels, providing subsidies and tax incentives to offset the increased cost of fossil fuel discovery and
      production, and have grandfathered in older- more pollutive facilities which do not meet current U.S. EPA
      clean air standards. Inadvertently, these practices perpetuate the use of older, less efficient power plants
      and deter the capital investment in more efficient generating technologies, renewable energies and pollution
      control systems.
      The U.S. federal government along with many states are working to develop new energy policies, incentives
      and grants focused on energy conservation, fuel-efficiency standards, renewable energy projects, alternative
      transportation fuels and, green building design/construction. Today, residents and businesses alike can
      benefit financially as well as environmentally by taking advantage of existing tax credits, grants, green
      mortgages, solar & wind projects, and the purchase of energy-efficient appliances.
      Coal is a highly abundant domestic resource which promises to supply the United States with enough
      energy to meet our needs for the next 200 years. Coal however, in its current form, has the worst pollution
      profile of any electrical generation fuel and poses serious health and environmental risks. Given that 49% of
      today’s electricity in the U.S. is generated by coal-fired power plants, significant research & development in
      clean-coal technologies, and strict government pollution policies are required to keep coal a viable, long-
      term energy source.
      Nuclear power, although heavily debated as a ‘clean energy’ will continue to be instrumental on a global and
      U.S. basis to meet future electricity demands. Nuclear power offers low kWh costs, reliable electrical
      output, low societal costs and virtually zero greenhouse gas emissions.
      Wind power has achieved global compounded annual growth rates of 30%. Larger wind turbines and
      component economies of scale allow wind to be on grid parity with fossil fuel generators. However, wind
      farms need to overcome variable power output with more electrical storage capacity, need to be strategically
      placed in areas which do not effect migratory bird paths and require better marketing to overcome their
      negative aesthetics and sound perceptions.
                                                                                                                 – 11 –
                                           ©2007 Environmental Impact Initiative
EII


Executive Summary –(continued)
      Solar promises to offer the greatest energy potential of any electrical generation method. More solar energy
      hits the earth in 1 hour than the planet uses in an entire year. Harnessing that solar energy through
      photovoltaic and thermal cells requires increased R&D on materials and cell efficiencies. The U.S. as well as
      other governments are sharing in R&D expenses and offering financial incentives to early adopters to
      facilitate economies of scale for solar producers. The solar industry expects PV cells to be at electrical grid
      parity by 2012.
      Capturing and using methane gas from dairy farms, ranches, landfills, and sewage treatment facilities has a
      dual benefit: 1) methane gas accounts for about 18% of greenhouse gas emission and is 25 times more potent
      than carbon dioxide at trapping heat in the atmosphere, and 2) methane gas can be combusted to drive
      electrical generators or can be used to generate steam for industrial purposes.
      In the U.S., corn ethanol will increase in growth and popularity with continued government blender credits
      and import tariffs, but is not sustainable in the long-term. Corn ethanol has a high feedstock cost,
      inadequate farmable acres to meet future growth expectations, requires large water reserves, has quality
      issues, increases the cost of corn for livestock feed, and is not competitive to regular gasoline in price or btu
      value. Although still in the developmental stage, cellulosic and thermal-chemical ethanol promises to
      produce lower cost ethanol using a wide variety of municipal solid, agricultural, or forestry waste.
      Increased government fuel efficiency standards for automobiles, greater environmental awareness and
      higher conventional fuel prices will drive more hybrid adoption, the return of the electric car, and the slow
      evolution of the hydrogen fuel cell.
      The term “negawatt”, coined by Amory Lovins, means a unit of saved energy. Instead of looking for ways to
      generate more energy to meet our growing global demand, we instead look for ways to reduce our energy
      demands. This concept has sparked a wide variety of energy saving products, services and practices that can
      help home-owners, commercial building owners, and industrial spaces save money and the environment by
      reducing their overall energy or utility spend.
      The U.S. EPA-Energystar and U.S. Green Building Council’s LEED programs are changing the way that
      architects, builders, and construction suppliers design, build and operate new or renovated spaces.
                                                                                                                    – 12 –
                                           ©2007 Environmental Impact Initiative
EII


What is energy? And, why is it important?
en·er·gy [ énnərjee ] (plural en·er·gies) -1. ability to do things: the ability or power to work or
make an effort, 2. vigor: liveliness and forcefulness, 3. forceful effort: a vigorous effort or
action, 4. power supply or source: a supply or source of electrical, mechanical, or other form
of power, 5. physics capacity to do work: the capacity of a body or system to do work.
Energy is used in every aspect of modern day life whether its driving your car, turning on a
light, or preparing food, energy is important because we wouldn’t have the quality of life that
we so enjoy without it’s benefit.
The truth is that most American’s don’t think about energy, unless fuel prices increase
significantly enough to affect our purchasing decisions or change our behavior. However, it is
important to understand the ‘life cycle’ of the energy we use. This includes which energy
source or fuel we are consuming, where the fuel came from, how it was produced, how it was
supplied to us, what benefit do we receive from it, what waste or byproduct does it generate,
and what is the net affect on society, the environment, and our economy?
To demonstrate the life cycle of a few key energy sources, we will look at a simplified
selection of our most common energy sources: petroleum for motor fuel, coal for electricity,
and natural gas for heating. We will look at all major steps of these fuel sources to gain a
better understanding of the process and industry that is in place to provide us with the
comforts and quality of life that we enjoy.

                                                                                                – 13 –
                                    ©2007 Environmental Impact Initiative
EII-Where does energy come from?


Life cycle of gasoline
                                                                5Blender-distributors take
    Crude oil is discovered, 3
1                                  Refineries purify, distill
    drilled, and pumped from                                      the motor fuel and mix it
                                   and formulate a number
    deep sea platforms or                                         with detergents & octane 7
                                   of different fuels as well
                                                                                                Consumers pump the gas
    from land-based jack-                                         enhancers such as ethanol
                                   as petrochemicals
                                                                  to create different grades of into their vehicles and
    pumps
                                                                                                drive off
                                                                  gasoline


                  2   Crude oil is
                                            4
                      sent through               Motor fuels are                6 Tank trucks then
                      pipelines or               usually piped to large            transport the
                      delivered to               storage tanks or can              blended fuels to
                      refineries via             be transported via                multiple gas
                      oil freighters             railcars or tank trucks           stations
                                                 to storage tanks
Inputs: electricity, natural gas, motor fuels, energy intensive heavy equipment, massive logistics & infrastructure
Outputs: fossil fuel pollution, physical and residual destruction to ocean floor, land, aquifers, natural gas and
methane release or flare, petroleum vapors from distribution, storage and pumping, combustion of petroleum is
the single largest contributor to carbon dioxide emission in the United States
66% of U.S. oil is imported contributing $314 billion dollars to the U.S. deficit per year, the burning of petroleum
contributes to 25% of the smog in our cities, the U.S. spends $50bn per year to militarily secure oil supplies
                                                                                                                    – 14 –
                                                ©2007 Environmental Impact Initiative
EII-Where does energy come from?


Life cycle of coal-fired electrical generation
                                                                          4 Coal-fired power plants burn      6 Electricity
1                                                                           the coal in large boilers which     provides us
                                                        3 Coal is
    Coal is excavated from either                                           heats water into steam which        with the
                                                          transported
    underground coal mines or                                               then turns a large turbine          ability to run a
                                                          to power
    large topical strip mines                                               creating electricity                wide variety of
                                                          plants in
                                                                                                                appliances,
                                                          large
                                                                                                                equipment and
                                                          quantities
                                                                                                                products
                                                          via barges or
                                                          railcars
                                                          called unit
                                                          trains


                              2 Coal is then
                                   pulverized into
                                                                           5 Electricity is then carried
                                   smaller chunks and
                                                                             through a vast network of
                                   made ready for
                                                                             substations and power
                                   transport
                                                                             lines to our homes and
                                                                             businesses
    Inputs: electricity, natural gas, motor fuels, energy intensive heavy equipment, massive infrastructure &
    logistics, difficult and hazardous working conditions
    Outputs: sulfuric acid water run-off, sulfur dioxide leading to acid rain, nitrogen oxides, mercury, lead, arsenic
    along with other heavy metal pollution, coal is the second largest contributor to CO2 emissions in the U.S.
    Note: 49% of U.S. electricity is generated from coal-fired plants consuming 1 billion tons of coal per year, coal is
    domestically available and is a primary export of the United States.
                                                                                                                              – 15 –
                                                 ©2007 Environmental Impact Initiative
EII-Where does energy come from?


Life cycle of natural gas
1 Natural gas (NG)           3 Processing plants remove
 comes from similar                impurities from the gas and 5     Storage facilities
 underground wells                                                   hold the methane
                                   make the gas ready to be                                8 NG and LNG can be used to fuel
 like oil; exploration,                                              gas and make it
                                   compressed and moved
                                                                                             our ovens, stoves, furnaces, hot
 drilling and                                                        regionally available
                                   through pipelines, or they can
                                                                                             water heaters and automobiles
 production takes                                                    for use
                                   turn the gas into liquid fuel
 place in the ocean or             (LNG)                                           6 Gas meters
 on land
                                                                                      measure our
                                                                                      consumption


                   2NG is then
                                    4 Gas pipelines are compressed at 100 mile
                    piped or
                    shipped in bulk intervals, allowing the gas to travel long            7 Natural gas is used to
                                      distances, most of these pipes are
                    to a processing                                                  generate electricity as well as
                                      underground
                    plant                                                            for industrial heat
 Inputs: electricity, natural gas, motor fuels, energy intensive heavy equipment, large infrastructure & logistics
 Outputs: although cleaner than coal or petroleum, natural gas is still considered a fossil fuel which releases
 carbon dioxide, carbon monoxide, and methane gases. The exploration, production and distribution of
 natural gas is destructive to the ocean floor, land, forests, air and water.
                                                                                                                         – 16 –
                                                 ©2007 Environmental Impact Initiative
EII-Where does energy come from?


Section Review
The previous slides demonstrate three conventional fossil fuel supply chains or ‘life
cycles’. The supply chains for petroleum, coal and natural gas are energy intensive,
complex, span multiple continents, require massive amounts of capital cost, annual
maintenance, and logistics.

These supply chains are also prone to disruptions for a number of reasons: war, natural
phenomenon like hurricanes and floods, political embargoes or maneuvering, production
capacity constraints, safety violations, regulatory reasons, and of course natural resource
depletion.

In order to provide a growing global market with ample and stable supplies of energy at
affordable prices, the supply from these fossil fuel sources need to continue to grow in
line with global demand. To better understand what is driving global demand, and how
much more of these primary energy sources will be required, we need to look at global
economics.


                                                                                        – 17 –
                                   ©2007 Environmental Impact Initiative
EII-Why is energy demand increasing?


Macroeconomics
      The global population currently stands around 6.6 billion people and is growing at a rate of 1.3% or 78
      million people per year
      China and India (and other non-OECD nations), will grow their energy demands by 2.6% p.a. as they work
      towards a GDP growth rate of 5.3% vs. mature OECD economies whose energy demands are only increasing
      by .8% per year with GDP targets of 2.5%
      Global GDP per capita is approximately $9300 and growing at a rate of 4.1% per annum. As GDP increases
      so does demand for energy and energy sources per person. In comparison, global energy (in BTUs) per
      capita is 70MM whereas the U.S. is 284MM BTUs per person, this indicates that there is a lot more energy
      to be consumed per person as the majority of the world’s population achieves a higher GDP
      The shift in energy consumption demonstrates that OECD nations are moving from energy intensive
      industries to more services, and non-OECD nations are growing GDP through industrialization, which
      requires more energy and electricity generated from cheap sources
      Global energy demands will be led by industrial uses, transportation, residential and then commercial
      sectors; electrical generation for industrial uses requires the vast majority of coal & natural gas, while the
      transportation sector requires oil.
      Oil, Coal, Natural Gas, Nuclear and Renewable are today’s ranking of global energy sources. The EII
      believes that there will be a major shift from oil as the primary energy source to coal, and that wind will
      break out as the primary ‘renewable’ source in the short-term, followed by hydroelectric and then solar in
      the long-term
      OPEC has 77% of the world’s oil reserves, the former Soviet Union has 10%, whereas the U.S. only has 2%.
      However, the U.S. consumes 26% of global oil production making energy independence a major issue for the
      U.S. as well as other countries.
                                                                                                                       – 18 –
                                            ©2007 Environmental Impact Initiative
EII-Why is energy demand increasing? -Macroeconomics

The world population is growing by 78MM people per annum,
additional energy production is required to meet growing demand


                                                        Global population
                                                        estimated at 6.6 bn in 2007


                                                                               2007


                                                                                               – 19 –
                                                       ©2007 Environmental Impact Initiative
EII-Why is energy demand increasing? -Macroeconomics

Growing GDP, especially through the industrialization of Non-
OECD nations China & India = 1/3 Earth’s population

                                      14.0
                                                                                                                                             Non-OECD GDP
                                                                                                                                             Non-OECD Energy Demand
                                      12.0
     GDP & Energy Growth % per Year


                                                                                                                                             OECD GDP
                                                                          Non-OECD GDP &
                                                                          Energy Demand
                                                                                                                                             OECD Energy Demand
                                                                          “Cumulative Growth”
                                      10.0
                                                                                                                                          Global GDP/Energy Analysis:
                                       8.0                                                                                               •4.1% annual global GDP
                                                                                                                                          growth rate
                                                    OECD and Non-
                                                    OECD GDP
                                                                                                                                         •1.8% annual global Energy
                                                    growth from 1980
                                       6.0
                                                    base level                                                                            growth rate
                                                                                                                                         •Non-OECD GDP growth =
                                       4.0                                                                                                5.3%
                                                                                                                                         •Non-OECD Energy growth =
                                       2.0                                                                                                2.6%
                                                                                                                                         •OECD GDP growth = 2.5%
                                       0.0                                                                                               •OECD Energy growth = 0.8
                                             1980
                                                     1984

                                                            1988
                                                                   1992
                                                                          1996
                                                                                 2000

                                                                                        2004
                                                                                               2008
                                                                                                      2012
                                                                                                             2016

                                                                                                                    2020
                                                                                                                           2024
                                                                                                                                  2028


 Energy Information Administration, International Energy Outlook 2007
                                                                                                                                                                        – 20 –
                                                                                          ©2007 Environmental Impact Initiative
EII-Why is energy demand increasing? -Macroeconomics


Comparison of US, China and India GDP and carbon emissions per capita. As China and
India grow so will their energy demands and their pollution emissions

                                                                Carbon Dioxide Emissions & GDP Per Capita 2004

                                40.0

                                35.0


                                                                                                                                                                                                                         CO2 Emissions (Mt/Capita)
        GDP (Thsd USD/capita)


                                                                                                                                                                                                                                                          GDP per Capita
                                30.0

                                25.0
                                                                                                                                                                                                                                                     GDP per CapitaCapita
                                                                                                                                                                                                                                                      Emissions per
                                20.0
                                                                                                                                                                                                                                                     Emissions per capita
                                15.0                                                                                                                                                                                                                      Global GDP per
                                10.0                                                                                                                                                                                                                       capita average
                                 5.0

                                 0.0
                                                                                Japan


                                                                                                                                                                                                        India
                                                                                                                                                                                                                Africa
                                                                Australia/New
                                                       Canada


                                                                                        OECD Europe
                                                                                                      South Korea
                                                                                                                    Russia
                                                                                                                              Mexico


                                                                                                                                                                                   China
                                                                                                                                                              Other Non-
                                                                                                                                                                           Other


                                                                                                                                                                                           Other Non-
                                       United States


                                                                                                                                       Brazil
                                                                                                                                                Middle East


                                Energy Information Administration, Carbon Dioxide & GDP per capita by region, 2004

                                                                                                                                                                                                                                                                            – 21 –
                                                                                                                             ©2007 Environmental Impact Initiative
EII-Why is energy demand increasing? -Macroeconomics

Global energy use by sector –Industry leads, demonstrating more
energy required by industrializing nations: China & India

                                                  Energy by End Use Sector

                            300.0

                            250.0
         quadrillion btus


                                                                                                  Transportation
                            200.0
                                                                                                  Industrial
                            150.0
                                                                                                  Residential
                            100.0
                                                                                                  Commercial
                             50.0
                              0.0
                                       2004                         2015                   2030


            Energy Information Administration, International Energy Outlook 2007

*To put these figures into perspective, total global electricity demand is now 470.63 quadrillion btu’s or equal to
approx. 5,372,489 megawatts of power per year. This is equal to 7,163 average sized coal-fired power plants or
4,297 average nuclear plants. Our global electricity demand is expected to grow to 714.62 quad btu’s per annum
by the year 2030. This means that we need to increase our electrical supply by 52% over the next 23 years. Much
of which is occurring in China and India by adding 1 new 750MW coal-fired power plant per week!
                                                                                                                   – 22 –
                                                        ©2007 Environmental Impact Initiative
EII-Why is energy demand increasing? -Macroeconomics

 The transportation sector uses 60% of all oil produced, global
 demand requires an additional 580 million more barrels per year
                                                        Oil Use by Sector (Mtoe)

                      3500


                      3000


                      2500

                                                                                                      Transport
                      2000
                                                                                                      Industry
               Mtoe


                                                                                                      All Other Sectors
                      1500
                                                                                                      Non-energy Uses

                      1000


                       500


                         0
                                  2002                  2010              2020                 2030

                       Source: IEA WEO2004

    *To put this global demand figure into perspective, the world consumes 30.3 billion barrels of oil per year
    today, the U.S. consumes 7.7 billion barrels per year or 26% of the world’s total. By 2030, world demand is
    expected to grow to 43.07 billion barrels per year or 42%. The U.S. is expected to represent 24% of this
    total or 10.1 billion barrels per year.
                                                                                                                          – 23 –
                                                       ©2007 Environmental Impact Initiative
EII-Why is energy demand increasing? -Macroeconomics


Comparison of global energy supply from 2007 to 2030
                                                                                                                2030
                     2007 World Energy Breakdown %
                                                               Hydroelectric
                                                                                            Coal surpasses Oil as the primary energy
                                                                                        •
                                                                      5.8%                  source
                          Natural
                                             Nuclear
                                                                                            Natural Gas and Oil decrease, giving way to
                                                                                        •
                           Gas                                   Wind
                                              6.0%
                                                                                            growing alternative energies
                          23.1%                                 0.6%
                     Coal
                                                                                            Wind is now the dominate alternative
                                                                                        •
                                                                 BioFuels
                    26.8%                                                                   energy source, renewables represent 20.3%
                                                                  0.6%
                                                                                            of total
                                                               Geothermal
                                                                  0.1%                      More nuclear plants are established,
                                                                                        •
                              Oil
                                                              Solar
                                                                                            followed by Hydro and Solar electricity
                             37.0%        Other
                                                              0.0%
                                                                                            generation
                                          7.1%


                            2007                                                            2030 World Energy Breakdown %

           87.5% of the world’s energy comes
       •                                                                                                                        Hydroelectric
                                                                                                        Wind
           from fossil fuels                                                                                      Nuclear
                                                                                         Natural Gas                               4.1%
                                                                                                        12.0%      4.5%
                                                                                            20.7%
           Oil is dominate energy source
       •                                                                                                                               Solar
           mainly for transportation                                                                                                   3.4%
                                                                                             Oil
           Hydroelectric power generation
       •                                                                                                                         Geothermal
                                                                                            25.4%
           and Nuclear are the largest “clean                                                                                       0.4%
           energies”                                                                                                                BioFuels
                                                                                                       Coal
                                                                                                                     Hydrogen         0.2%
                                                                                                       29.1%
           Renewables only represent 7% of
       •                                                                                                               0.1%
           total energy supply
                                                                               Coghill Capital Research, Energy Generation Matrix 2007
                                                                                                                                            – 24 –
                                                       ©2007 Environmental Impact Initiative
EII-Why is energy demand increasing? -Macroeconomics


United States energy production by fuel type

                                           U.S. Energy Generation by Source 2006

                                    Renewable Petroleum
                                   (Solar/Wind) 2% Other (landfill
                                        2%              methane)
                                                                     1%
                               Hydroelectric                                                   Coal
                                   7%
                                                                                               Natural Gas
                                 Nuclear                                                       Nuclear
                                                                    Coal
                                  19%
                                                                                               Hydroelectric
                                                                    49%
                                                                                               Renewable (Solar/Wind)
                                                                                               Petroleum
                                 Natural Gas                                                   Other (landfill methane)
                                    20%


            Source: EIA, net Generation by Energy Source, 2006 Annual Review

      Today, fossil fuels represent 72% of the energy fuel used to power the U.S. What will
      be the leading energy source in 10, 20, 50 years from now? Coal?, Nuclear?, Solar?
      What are the political, industrial, and environmental impacts of changing energy
      sources?
                                                                                                                          – 25 –
                                                       ©2007 Environmental Impact Initiative
EII-Why is energy demand increasing? -Macroeconomics


Section Review
 Population growth creates an inherent demand on energy to feed, cloth, and shelter
 more people in the world. As emerging nations like China and India grow their
 economies through industrialization they will require more energy than OECD or
 industrialized nations. Furthermore, as China and India develop a middle class, these
 individuals now have the ability to purchase motorized vehicles which require
 gasoline, homes or apartments which require heat and electricity, and now have the
 disposable income to purchase more clothing, food, and consumables, all of which
 consume more energy.
 Currently, fossil fuels represent the largest portion (87.5%) of the world’s energy
 sources, and 72% of the United States energy sources. If we are to meet a growing
 world and U.S. demand, we need to locate, produce, distribute, and consume more
 fossil fuels, also known as hydrocarbons.
 In the following section, we will chemically define what a hydrocarbon is and why
 burning or combusting hydrocarbons are believed to cause unprecedented human and
 environmental health risks.


                                                                                               – 26 –
                                                       ©2007 Environmental Impact Initiative
Molecular Components and Weight of Dry Air
EII –How do hydrocarbons affect our environment?                                                                                       Molecular Mass-M   M in Dry Air
                                                                                                      Component       Component %
                                                                                                 Nitrogen (N2)               0.7809                 28.02         21.88
                                                                                                 Oxygen (O2)                 0.2095                 32.00         6.704
                                                                                                 Argon (Ar)                0.00933                  39.94         0.373
                                                                                                 Carbon Dioxide (CO2)        0.0003                 44.01         0.013

The chemistry of hydrocarbon combustion                                                          Hydrogen (H2)           0.0000005                   2.02              0
                                                                                                                                      Molecular Mass =           28.97


Pure Hydrocarbon (Methane) = CH4                                           Where 1 carbon is bonded with 4 hydrogen molecules
                                                                   H=1
                                                                                (M=16) where M – indicates molecular weight
                                                                 H = 1C=12H = 1

                                                                    H=1

Hydrocarbon chains link additional carbon molecules with more hydrogen molecules to form
straight, branched or ring structures = ethane (C2H6), propane (C3H8), kerosene (C12H26), etc…
Complete Combustion occurs when hydrocarbons are burned in the presence of excess oxygen,
resulting in carbon dioxide, water vapor, and the release of energy as heat and light.
                     H=1
                                              O=16                           C=12                O=16                            O=16
                                               O=16                      O=16
                 H = 1C=12H = 1                                                 O=16
                                              O=16                                            H=1                            H=1
                                                                                                          H=1                            H=1
                                                O=16
                      H=1
                                                                                                 H2O                             H2O
                                                                            CO2
                                               2O2
                    CH4                                                                          M = 18                         M = 18
                                                                            M = 44
                                               M = 64
                   M = 16
Incomplete Combustion occurs when insufficient oxygen is present, resulting in carbon monoxide,
straight carbon (or both), water vapor, and the release of energy as heat and light.
                                    H=1
                                                                                     C=12
                                                         O=16                                             O=16
                             H = 1C=12H = 1
                                                         O=16                                       H=1         H=1
                                                                                      O=16
                                    H=1
                                                                                                          H2O
                                                          O2                          CO
                                  CH4                                                                 M = 18
                                                        M = 32                       M = 28
                                  M = 16


*To summarize, combusting hydrocarbons breaks apart carbon and hydrogen molecules and allows them to be
bonded with other available molecules such as oxygen, sulfur, nitrogen, and other carbon or hydrogen molecules
to create entirely new chemical compounds.
                                                                                                                                                                 – 27 –
                                                         ©2007 Environmental Impact Initiative
EII –How do hydrocarbons affect our environment?


How does hydrocarbon combustion affect our environment?
Complex and naturally occurring hydrocarbons have been concealed underground for
millions of years in the form of coal, crude oil, and methane gas. Only in the past 200
years since the industrial revolution have we begun to excavate, produce and combust
these fossil fuels for electricity, motor fuel, and heat at increasing levels.
As we learned in the previous slide, hydrocarbon combustion results in the creation of
new chemical compounds. Free carbon molecules are combined with oxygen molecules
to form CO carbon monoxide –a toxic gas, or two oxygen molecules to form CO2 carbon
dioxide –which is believed to be the major contributor to the greenhouse effect.
Furthermore, water vapor (H2O M=18) and carbon monoxide (CO M=28) are lighter
than dry air (N,O,H M=29) and will rise, and carbon dioxide (CO2 M=44) and ozone
(O3 M=48) are heavier than dry air and will form a grey haze near the ground which we
call smog.
Other than burning very pure methane gas, hydrocarbons almost always contain
impurities. These impurities can range from mercury, lead and arsenic to low levels of
uranium and thorium or other naturally occurring radioactive isotopes. All of which are
considered carcinogens or mutagens and adversely affect humans and animals.
According to Oak Ridge National Laboratory, Americans living near coal-fired power
plants are exposed to higher radiation doses than those living near nuclear power plants.
Beside the carbon oxides discussed above, other chemical compositions resulting from
the burning of hydrocarbons include noxious and poison compounds like sulfur oxide &
nitrous oxide, both of which are federally regulated now by the United States. Ozone
(O3) is an indirect byproduct of hydrocarbon combustion and sunlight, resulting in a
powerful oxidizing agent as well as a leading cause of bronchial aggravation or asthma.
Although numerous byproducts come from the combustion of hydrocarbons, it is the
greenhouse gases that have stirred so much controversy over the past 10 years.
                                                                                           – 28 –
                                                   ©2007 Environmental Impact Initiative
EII –How do hydrocarbons affect our environment?


The Greenhouse effect
Greenhouse gases include water vapor, carbon dioxide, methane, nitrous oxide and ozone. These
greenhouse gases are the primary byproduct of hydrocarbon combustion.


         NACC/USGCP graphic Union of Concerned Scientists for Environmental Solutions

                                                                                            – 29 –
                                                   ©2007 Environmental Impact Initiative
EII –How do hydrocarbons affect our environment?

Scientists speculate that the Earth’s temperature will rise in
correlation to carbon dioxide levels in our atmosphere
Ice core samples dating back 400,000 years demonstrate the positive correlation between
atmospheric CO2 content and the Earth’s surface temperature


                                                                                              Red Line is Carbon
                                                                                              Dioxide Content (PPM)
                                                                                              Blue Line is Earth’s
                                                                                              surface temperature (C)


 Historical carbon dioxide record from the Vostok ice core samples, “Climate and atmospheric history of the past 420,000 years” 1999, Petit J.R., Jouzel J;
 .and Alexey Fedorov The Pliocene Paradox, Science 312, 1485-1489, June 2006 Yale


                                                                                                                                                              – 30 –
                                                          ©2007 Environmental Impact Initiative
EII –How do hydrocarbons affect our environment?

Greenhouse gases primarily come from electrical generation,
industrial processes, transportation and agricultural byproducts


  Emissions Database for Global Atmospheric Research, (EDGAR) version 3.2, 2000

                                                                                             – 31 –
                                                     ©2007 Environmental Impact Initiative
EII –How do hydrocarbons affect our environment?

A proliferation of headlines, articles and books inspire political
and scientific debate, global warming or just pollution?


                                                                                           – 32 –
                                                   ©2007 Environmental Impact Initiative
EII –How do hydrocarbons affect our environment?


United Nations Framework Convention on Climate Change
In 1992 the UNFCCC was created as an environmental treaty aimed at
reducing emissions of greenhouse gases to combat global warming.
Signatories to the treaty were split into three categories: 1) Annex I
(industrialized nations), 2) Annex II (developed countries which pay
for costs of developing countries) and, 3) Developing countries.
In 1997 the UNFCCC adopted the first legally binding protocol, named
after the place of signing Kyoto Japan. The Kyoto protocol bound
signatories to reducing their countries carbon emissions between 6-8%
below 1990 levels. Although the U.S. signed the protocol, it was not
sent to the U.S. Senate for ratification. The U.S. was concerned about
the impact to the U.S. economy, method of funding developing
countries, the fact that developing countries were not required to also
reduce their carbon emissions, and that the U.S. could not use
agricultural and forest ‘carbon sinks’ in its reduction program.
In 2001, the UNFCCC found resolution to many of these negotiations and agreed to 1) Flexible
mechanisms including carbon emissions trading, joint implementation of carbon offset projects and
Clean Development Mechanisms (CDM) which allow industrialized nations to fund emission
reduction activities in developing countries, 2) Agricultural and forest carbon sinks were allowed to
country specific caps, 3) Compliance procedures and mechanisms with consequences to countries
who do not meet emission limits, 4) Financing -3 new funds were created to provide assistance to
climate change programs.
The UNFCCC and the publicity and debate that the Kyoto protocol created inspired the world to
look at new energy policies, energy efficient products and services, environmental and human-health
impact of fossil fuels, damage to fragile ecosystems, sustainable packaging and product life-cycles, all
of this wrapped up into a global movement concerned about “GLOBAL WARMING”.
                                                                         WARMING
                                                                                                    – 33 –
                                                   ©2007 Environmental Impact Initiative
EII –How do hydrocarbons affect our environment?

                   CO2 emissions are expected to continue to rise unless we reduce
                   the combustion of hydrocarbons or find a way to sequester CO2
Billions of metric tonnes Co2


                                                                                                             27%


                                                                                                               19%


                                  Source: International Energy Agency, world outlook 2006
                                                                                                                     – 34 –
                                                                     ©2007 Environmental Impact Initiative
EII –How do hydrocarbons affect our environment?

Long-term effects of global warming according to the
Intergovernmental Panel on Climate Change second assessment:
        Increased global surface temperature causing the retreat of glaciers, melting of North Atlantic
        and Artic ice caps and the rise of sea level by 0.2 cm/year
        The slowing of the thermohaline –oceanic circulatory pump which regulates global sea
        temperatures and produces regular global weather patterns
        Increased severe weather patterns, droughts in some areas, floods in others, stronger and more
        frequent hurricanes
        Increased spread of disease and insects due to longer warming periods which allow the pests
        to survive longer, examples: dengue fever, malaria, west nile virus & mountain pine beetle
        Decreased permafrost increases biodegrading and methane release from typically frozen
        biomass such as peat bogs, which further aggravates global warming
        Acidification of the ocean as more CO2 is absorbed and changes the pH level of the water,
        effecting calcifying organisms such as: corals, mollusks, crustaceans, some of the lowest level
        species in our food chain
        Evaporation of wetlands and topical fresh water reserves –Florida everglades, and Africa’s
        lake chad are examples which will impact not only millions of people who depend on the
        water, fish, and vegetation growing from these reserves, but also the millions of animal species
        which depend upon these ecosystems
        Increased health risks including asthma and lung disease from ozone, and longer, more severe
        heat waves
        The Stern report on global warming released October 2006 estimated that global warming
        could cost as much as $9 trillion dollars through lost productivity, mass migration, insurance
        outlays, crop damage, land and property damage, healthcare costs and mortality

                                                                                                    – 35 –
                                                   ©2007 Environmental Impact Initiative
EII –How do hydrocarbons affect our environment?


The Societal Cost of Hydrocarbons
The burning of hydrocarbons has not only a high product cost for petroleum, natural gas, and coal,
but also includes a very high societal cost. Societal costs can be more difficult to calculate than
commodity costs and they vary from society to society. We will look at the societal cost of fossil
fuels broken down into three main categories: environmental, military, and healthcare costs.


     *Thick gray layer of smog
     over Eastern China, NASA
     Terra Satellite images 2005                                                           Beijing


                                                                                               Jinan


                                                                                                       Shanghai


                                                                                                                  – 36 –
                                                   ©2007 Environmental Impact Initiative
EII –How do hydrocarbons affect our environment?

The use of hydrocarbons have not only an economic product cost,
but also a very high societal cost to the entire population
Environmental Costs: Air, Water & Soil pollution regulation & clean-up


       Beijing before & after rainfall             Industrial waste pouring into the Yangtze river   Soil erosion and run-off in Iowa


U.S. Related Data:
      Regulation of air, water and soil pollution = $8.1 billion p.a.
   Oil pollution from motor vehicles causes $4.6 billion in damages to crops, forests, rivers,
lakes, buildings and monuments p.a.
   Air, water and soil pollution from electrical generation (coal and natural gas fired boilers)
costs between $14.8-90.3 billion each year
     1 gallon of spilled oil can contaminate 1 million gallons of fresh water
   1 MWh from a coal-fired generation plant releases 2,249 lbs. of CO2, 13 lbs. of sulfur
dioxide, 6 lbs. of nitrogen oxides, and various levels of toxic mercury and arsenic, depending
upon the purity of the coal
                                                                                                                                        – 37 –
                                                      ©2007 Environmental Impact Initiative
EII –How do hydrocarbons affect our environment?


 Societal Cost of Hydrocarbons
Military Costs: Strategic U.S. military bases ($49bn), oil & gas supply route security ($20bn),
strategic petroleum reserves ($30bn), War in Iraq has a financial cost of $275 million per day x 4
years= $401.5 billion dollars before any rebuilding or long-term health costs are applied


Healthcare Costs: Lung disease & asthma treatments caused by pollution ($16.1bn),         lead,
mercury and arsenic poisoning from coal fired plants causes mental retardation, a host of learning
disabilities, premature mortality, and has been linked to the growing number of autism cases in the
U.S. ($88-640bn), 760,000 Chinese die prematurely each year from air & water pollution ($99bn)


                                                                                                     – 38 –
                                                   ©2007 Environmental Impact Initiative
EII –How do hydrocarbons affect our environment?


So what are the societal costs of fossil fuels in the United States?

                                                                                                   Fossil Fuel Costs (billions USD)
                                                                                       Low                            Mid                               High
                                                                                            $49.00                             $75.00                           $100.00
 Military Base & Supply Route Security
                                                                                             $14.80                            $53.00                             $90.30
 Environmental Monitoring & Clean-up
                                                                                            $24.30                           $237.00                            $450.00
 Healthcare treatment & mortality from pollution
                                                                                             $88.10                          $365.00                            $640.30
                                        Total Fossil Fuels Costs

 Using the Mid range of societal costs above divided by the total quantity of fossil fuel sourced
 consumed in 2006, we can calculate the financial impact to these fuel sources:
                                      2006 Avg. Cost           Add Mid Societal Cost               Total Cost/Unit               Consumer Increase
                                                     $20.49                               $93.83                       $114.32 $0.0454 cents/kWh
           Coal (short ton)
                                                        $60                               $26.68                         $86.68 $1.54 per gallon
         Crude Oil (barrel)
                                                      $6.80                                $2.74                          $9.54 $0.0235 cents/kWh
        Natural Gas (mmcf)

The Mid range societal costs increase: (this is generation cost ONLY, no distribution or retail costs included)
  Coal fired electrical generation costs go from $0.026 cents to $0.0714 cents per kWh
  Natural gas electrical generation costs go from $0.0615 cents to $0.0851 cents per kWh
  Regular gallon of unleaded gasoline goes from $3.46 to $5.01 dollars per gallon
Sources: Intergovernmental Panel on Climate Change, Department of Resource Economics and Public Policy –University of Massachusetts, Ontario Ministry of Energy,
National Defense Council Foundation, and the Institute for the Analysis of Global Security we will consider the following costs of fossil fuels (in billions of US dollars)
                                                                                                                                                                       – 39 –
                                                               ©2007 Environmental Impact Initiative
EII –How do hydrocarbons affect our environment?

Importing 5 bbls of oil per year + economic loses + societal costs =
$10 per gallon

                                      Defense Spending                      Oil Supply Disruptions

                              $1                                       $1
                                                   39                                      34
                                     Jobs Lost Overseas                        Taxes Lost Overseas
                             $5                                         $0                 43
                                                   19
                                       Healthcare Costs                        Environmental Cost
                                                                        $1
                              $0                   51                                      21
                                                                 Total
                                                   $1                    07
                                                              0
                                 Source: National Defense Council Foundation & Institute for the
                                                   Analysis of Global Security

                                                                                                     – 40 –
                                                   ©2007 Environmental Impact Initiative
EII –How do hydrocarbons affect our environment?

Societal costs are allocated to the price of gasoline in other
countries through gas or carbon taxes, but U.S. has the lowest tax


                                 Automotive Gasoline -April 2007
                                          $/Gal. No-
              Country                        Tax               Tax Rate        Taxes      Total $/Gallon
 UK                                           2.21               205%           4.54          6.76
 Germany                                      2.32               190%           4.41          6.74
 Italy                                        2.51               157%           3.95          6.46
 France                                       2.33               174%           4.05          6.38
 Spain                                        2.47                111%          2.74          5.21
 Japan                                        2.23                86%           1.91          4.14
 Canada                                       2.46                42%           1.03          3.50
 USA                                          2.41              14-16%          0.40          2.81
   International Energy Agency –End-User Petroleum prices April 2007


                                                                                                           – 41 –
                                                      ©2007 Environmental Impact Initiative
EII –How do hydrocarbons affect our environment?


Section Review
The burning of fossil fuels (hydrocarbons) is the major contributor to global pollution. Of primary
concern to humans, plants and animals is the release of heavy metals such as mercury and
radioactive isotopes like uranium, which are known carcinogens and mutagens. As of 2005 the U.S.
set a mercury emission limit on generation facilities, but has yet to create a financial method (cap
and trade, tax or penalty) to enforce or influence mercury reduction. Successful emissions limits
(cap and trade system) have been set for nitrogen oxide (NOX) as well as sulfur dioxide (SO2) both
of which are responsible for acid rain. Greenhouse gases from the combustion of hydrocarbons is
believed to have adverse environmental effects such as: melting ice caps, extreme weather patterns,
methane release from melting permafrost and the increased lifespan and spread of certain pests.
The United Nations Framework Convention on Climate Change (UNFCCC) has organized an
intergovernmental panel on climate change to scientifically and politically address the effects of
global warming. The U.S. is the second largest carbon emitter in the world behind China. In the
U.S., petroleum combustion results in 2.6 trillion lbs. of carbon dioxide equivalent greenhouse
gases per year, representing 45% of our nation’s total. Coal emits 4.8 trillion lbs. or 35% and
natural gas (methane) represents 19% or 2.6 trillion lbs. per year. According to the EIA 2007
outlook, U.S. greenhouse gas emissions increased 25% over the past 17 years since 1990 and are
expected to continue to grow at a rate of 1.2% per year through 2030.
Fossil fuels carry a high societal cost, including large military costs to secure and protect oil
producing nations, healthcare costs associated premature mortality, lung disease and a host of
mental conditions, and finally the cost of monitoring and cleaning up water, soil and air related
pollution. In our base case analysis, U.S. societal costs amount to $365 billion dollars per year.
Associating these societal costs to fossil fuels is one reason why we believe hydrocarbons will
increase in fuel price in the future. In the next section we will explore several other reasons why
we believe fossil fuels will remain at relatively high prices in the future.

                                                                                                     – 42 –
                                                   ©2007 Environmental Impact Initiative
EII –Why is the cost of fossil fuels increasing?


Why is the cost of fossil fuels increasing?
     There are a number of reasons why we believe the cost for petroleum, coal and natural
     gas as our primary energy sources will continue to increase in the future:
     Global demand is increasing as we reviewed in the macroeconomics section
     Societal costs are being allocated to fossil fuels as we reviewed in the last section
     In the financial commodities market “energy” futures are linked by their btu value,
     thus as one commodity rises the others follow by their btu equivalent ratio
     Global supplies of conventional oil and natural gas are decreasing, thus these limited
     resources are depleting, we will look at peak oil and gas estimates
     The marginal cost (production and transporting) of supplying oil, gas and coal is
     increasing along with higher motor fuel and equipment costs
     Global oil production is at 95+% of capacity, any supply disruptions will result in
     outages and higher oil prices
     More countries are mandating carbon taxes or carbon caps, thus increasing the cost of
     operations which utilize fossil fuels and emit large quantities of carbon dioxide or
     other greenhouse gases
                                                                                             – 43 –
                                                   ©2007 Environmental Impact Initiative
EII –Why is the cost of fossil fuels increasing?


Historical prices of West Texas Intermediate crude oil
 *Note the historical price spikes from oil disruptions

                                                                                                      WTI Crude Oil Price
                                                   West Texas Intermediate Historical Prices
                                                                                                      Linear (WTI Crude Oil Price)
                                      90
                                                                                                      2005 Hurricanes
                                                                                                      Katrina and Rita
                                      80                                                              disrupt gulf coast oil
                                           1990 Iraq
                                                                                                      supply
                                           invasion of
                                      70   Kuwait
         USD/Barrel (2007 CPI adj.)


                                      60
                                                                                     Sept. 11, 2001
                                      50                                             Terrorist
                                                                                     Attack on U.S.
                                      40

                                      30

                                      20

                                      10

                                      0
                                          7
                                         88

                                         89

                                         90

                                         91

                                         92

                                         93

                                         94

                                         95

                                         96

                                         97

                                         98

                                         99

                                         00

                                         01

                                         02

                                         03

                                         04

                                         05

                                         06

                                         07
                                      19 8
                                      19

                                      19

                                      19

                                      19

                                      19

                                      19

                                      19

                                      19

                                      19

                                      19

                                      19

                                      19

                                      20

                                      20

                                      20

                                      20

                                      20

                                      20

                                      20

                                      20
       Source: Bloomberg USCRWTIC commodity prices 1987 -2007, CPI adjusted for inflation
                                                                                                                                     – 44 –
                                                           ©2007 Environmental Impact Initiative
EII –Why is the cost of fossil fuels increasing?


Historical prices of Nymex –Henry Hub natural gas
Natural gas has a btu value of 1,031,000 per mcf equal to 302 kWh/mcf. Whereas, oil has a btu value of 5,800,000
per barrel or 1700 kWh/brl. Natural gas historically traded at a ratio of 5.6:1 to crude oil. Any oil supply
disruptions would also adversely effect natural gas.


                                                         U.S. Natural Gas Prices
                                                   Nymex/Henry Hub Natural Gas Prices

                                                   Linear (Nymex/Henry Hub Natural Gas Prices)
                                          16
                                                                                            2005 Hurricanes Katrina and
                                                                                            Rita disrupt gulf coast NG
          USD per MMbtu (2007 CPI adj.)


                                                                Winter 2000-2001
                                          14
                                                                                            supply
                                                                California energy
                                                                crisis, pipeline
                                          12
                                                                explosion & cold
                                                                winter
                                          10

                                          8

                                          6

                                          4

                                          2

                                          0
                                             90
                                             91

                                             92

                                             93

                                             94

                                             95

                                             96

                                             97

                                             98

                                             99

                                             00

                                             01

                                             02

                                             03

                                             04

                                             05

                                             06

                                             07
                                          19
                                          19

                                          19

                                          19

                                          19

                                          19

                                          19

                                          19

                                          19

                                          19

                                          20

                                          20

                                          20

                                          20

                                          20

                                          20

                                          20

                                          20
    Source: Bloomberg Nymex/Henry Hub commodity prices 1990 -2007, CPI adjusted for inflation
                                                                                                                          – 45 –
                                                         ©2007 Environmental Impact Initiative
EII –Why is the cost of fossil fuels increasing?


Historical prices of Central Appalachian Coal
Although coal production and supply chain activities were not effected by either the California energy crisis or
hurricanes Katrina and Rita, the energy relationship with oil and natural gas, increased the price of coal as seen
below

                                                       U.S. Central Appalachian Coal Prices
                                                                       U.S. CAPP Price
                                                                       Linear (U.S. CAPP Price)
                                     80
                                                                                                    2005 Hurricanes Katrina and
                                                                                                    Rita, disrupted energy market,
                                     70                                                             rising oil and gas prices led to
       USD per ton (2007 CPI adj.)


                                                                                                    higher coal prices
                                     60
                                                                                    Winter 2000-2001
                                     50                                             California energy crisis

                                     40

                                     30

                                     20

                                     10

                                     0
                                     1990 1991 1992 1993 1994 1995 1996 1997 1998 1999 2000 2001 2002 2003 2004 2005 2006

          Source: Bloomberg CAPP Coal BUS index prices 1990 -2007, CPI adjusted for inflation
                                                                                                                                       – 46 –
                                                                 ©2007 Environmental Impact Initiative
Eii Overview & Energy Presentation.10.18.07

More Related Content

What's hot

Planning for Energy
Planning for EnergyPlanning for Energy
Planning for EnergyKevin Choi
 
Letter from Edison Electric Institute 12.4.02 (b)
Letter from Edison Electric Institute 12.4.02 (b)Letter from Edison Electric Institute 12.4.02 (b)
Letter from Edison Electric Institute 12.4.02 (b)
Obama White House
 
SiS Biofuels O Connell 2007
SiS Biofuels O Connell 2007SiS Biofuels O Connell 2007
SiS Biofuels O Connell 2007
guestb40d60
 
California changing the game on climate
California changing the game on climateCalifornia changing the game on climate
California changing the game on climateESTHHUB
 
July-August 2006 Roadrunner Newsletter, Kern-Kaweah Sierrra Club
July-August 2006 Roadrunner Newsletter, Kern-Kaweah Sierrra ClubJuly-August 2006 Roadrunner Newsletter, Kern-Kaweah Sierrra Club
July-August 2006 Roadrunner Newsletter, Kern-Kaweah Sierrra ClubKern-Kaweah Chapter, Sierrra Club
 
Letter to President Obama from Group of Anti-Fossil Fuel Nutters Asking the P...
Letter to President Obama from Group of Anti-Fossil Fuel Nutters Asking the P...Letter to President Obama from Group of Anti-Fossil Fuel Nutters Asking the P...
Letter to President Obama from Group of Anti-Fossil Fuel Nutters Asking the P...
Marcellus Drilling News
 
Integrated Energy Planning
Integrated Energy PlanningIntegrated Energy Planning
Integrated Energy Planning
Leonardo ENERGY
 
Nrt achieving-balance-challenges-eng
Nrt achieving-balance-challenges-engNrt achieving-balance-challenges-eng
Nrt achieving-balance-challenges-engNationalRoundTable
 
MEA Carbon Action Network 22nd September 2009 Northampton
MEA Carbon Action Network 22nd September 2009 NorthamptonMEA Carbon Action Network 22nd September 2009 Northampton
MEA Carbon Action Network 22nd September 2009 Northamptonguestcca051
 
Burns Park Green Energy Association
Burns Park Green Energy AssociationBurns Park Green Energy Association
Burns Park Green Energy Association
naekwon
 
SERA Email 1.21.03
SERA Email 1.21.03SERA Email 1.21.03
SERA Email 1.21.03
Obama White House
 
Unep green economy 16 may 2012
Unep green economy 16 may 2012Unep green economy 16 may 2012
Unep green economy 16 may 2012Greenology
 
Nuclear Energy White Paper
Nuclear Energy White PaperNuclear Energy White Paper
Nuclear Energy White PaperErika Barth
 
Green Buildings ! How much it would cost ?-م.56-مبادرة#تواصل_تطوير-أ.د.طارق...
Green Buildings !   How much it would cost ?-م.56-مبادرة#تواصل_تطوير-أ.د.طارق...Green Buildings !   How much it would cost ?-م.56-مبادرة#تواصل_تطوير-أ.د.طارق...
Green Buildings ! How much it would cost ?-م.56-مبادرة#تواصل_تطوير-أ.د.طارق...
Egyptian Engineers Association
 
FINAL Coffee Table Book Mar 26 KN4639 - Canada Presentation Final DPS 260312
FINAL Coffee Table Book Mar 26 KN4639 - Canada Presentation Final DPS 260312FINAL Coffee Table Book Mar 26 KN4639 - Canada Presentation Final DPS 260312
FINAL Coffee Table Book Mar 26 KN4639 - Canada Presentation Final DPS 260312Julie Scarcella
 
Ijciet 10 01_174-2
Ijciet 10 01_174-2Ijciet 10 01_174-2
Ijciet 10 01_174-2
IAEME Publication
 
Energy Conservation: Lessons Save Money and Save the Environment
Energy Conservation: Lessons Save Money and Save the Environment  Energy Conservation: Lessons Save Money and Save the Environment
Energy Conservation: Lessons Save Money and Save the Environment
ZY8
 
Sustainable housing and building green rcbor presentation 5 10-11
Sustainable housing and building green rcbor presentation 5 10-11Sustainable housing and building green rcbor presentation 5 10-11
Sustainable housing and building green rcbor presentation 5 10-11
Michael Shilale, AIA, LEED
 
M05 p02scitechinnovbody01
M05 p02scitechinnovbody01M05 p02scitechinnovbody01
M05 p02scitechinnovbody01Hitesh Mahajan
 

What's hot (19)

Planning for Energy
Planning for EnergyPlanning for Energy
Planning for Energy
 
Letter from Edison Electric Institute 12.4.02 (b)
Letter from Edison Electric Institute 12.4.02 (b)Letter from Edison Electric Institute 12.4.02 (b)
Letter from Edison Electric Institute 12.4.02 (b)
 
SiS Biofuels O Connell 2007
SiS Biofuels O Connell 2007SiS Biofuels O Connell 2007
SiS Biofuels O Connell 2007
 
California changing the game on climate
California changing the game on climateCalifornia changing the game on climate
California changing the game on climate
 
July-August 2006 Roadrunner Newsletter, Kern-Kaweah Sierrra Club
July-August 2006 Roadrunner Newsletter, Kern-Kaweah Sierrra ClubJuly-August 2006 Roadrunner Newsletter, Kern-Kaweah Sierrra Club
July-August 2006 Roadrunner Newsletter, Kern-Kaweah Sierrra Club
 
Letter to President Obama from Group of Anti-Fossil Fuel Nutters Asking the P...
Letter to President Obama from Group of Anti-Fossil Fuel Nutters Asking the P...Letter to President Obama from Group of Anti-Fossil Fuel Nutters Asking the P...
Letter to President Obama from Group of Anti-Fossil Fuel Nutters Asking the P...
 
Integrated Energy Planning
Integrated Energy PlanningIntegrated Energy Planning
Integrated Energy Planning
 
Nrt achieving-balance-challenges-eng
Nrt achieving-balance-challenges-engNrt achieving-balance-challenges-eng
Nrt achieving-balance-challenges-eng
 
MEA Carbon Action Network 22nd September 2009 Northampton
MEA Carbon Action Network 22nd September 2009 NorthamptonMEA Carbon Action Network 22nd September 2009 Northampton
MEA Carbon Action Network 22nd September 2009 Northampton
 
Burns Park Green Energy Association
Burns Park Green Energy AssociationBurns Park Green Energy Association
Burns Park Green Energy Association
 
SERA Email 1.21.03
SERA Email 1.21.03SERA Email 1.21.03
SERA Email 1.21.03
 
Unep green economy 16 may 2012
Unep green economy 16 may 2012Unep green economy 16 may 2012
Unep green economy 16 may 2012
 
Nuclear Energy White Paper
Nuclear Energy White PaperNuclear Energy White Paper
Nuclear Energy White Paper
 
Green Buildings ! How much it would cost ?-م.56-مبادرة#تواصل_تطوير-أ.د.طارق...
Green Buildings !   How much it would cost ?-م.56-مبادرة#تواصل_تطوير-أ.د.طارق...Green Buildings !   How much it would cost ?-م.56-مبادرة#تواصل_تطوير-أ.د.طارق...
Green Buildings ! How much it would cost ?-م.56-مبادرة#تواصل_تطوير-أ.د.طارق...
 
FINAL Coffee Table Book Mar 26 KN4639 - Canada Presentation Final DPS 260312
FINAL Coffee Table Book Mar 26 KN4639 - Canada Presentation Final DPS 260312FINAL Coffee Table Book Mar 26 KN4639 - Canada Presentation Final DPS 260312
FINAL Coffee Table Book Mar 26 KN4639 - Canada Presentation Final DPS 260312
 
Ijciet 10 01_174-2
Ijciet 10 01_174-2Ijciet 10 01_174-2
Ijciet 10 01_174-2
 
Energy Conservation: Lessons Save Money and Save the Environment
Energy Conservation: Lessons Save Money and Save the Environment  Energy Conservation: Lessons Save Money and Save the Environment
Energy Conservation: Lessons Save Money and Save the Environment
 
Sustainable housing and building green rcbor presentation 5 10-11
Sustainable housing and building green rcbor presentation 5 10-11Sustainable housing and building green rcbor presentation 5 10-11
Sustainable housing and building green rcbor presentation 5 10-11
 
M05 p02scitechinnovbody01
M05 p02scitechinnovbody01M05 p02scitechinnovbody01
M05 p02scitechinnovbody01
 

Similar to Eii Overview & Energy Presentation.10.18.07

The Power Point
The  Power PointThe  Power Point
The Power Point
guest7c9284
 
Stop Trashing the Climate: Zero Waste
Stop Trashing the Climate: Zero WasteStop Trashing the Climate: Zero Waste
Stop Trashing the Climate: Zero Waste
Fiona9864
 
Renewable Energy Strategies For The Indian Railways
Renewable Energy Strategies For The Indian Railways  Renewable Energy Strategies For The Indian Railways
Renewable Energy Strategies For The Indian Railways
QZ1
 
Green Team Project
Green Team ProjectGreen Team Project
Green Team Project
tnading
 
carbon_footprints_sustainable_solutions.ppt
carbon_footprints_sustainable_solutions.pptcarbon_footprints_sustainable_solutions.ppt
carbon_footprints_sustainable_solutions.ppt
Renu Lamba
 
Different Worlds Common Problems
Different Worlds Common ProblemsDifferent Worlds Common Problems
Different Worlds Common Problemsgcecs2009
 
Understanding Renewable Energy in Kenya
Understanding Renewable Energy in KenyaUnderstanding Renewable Energy in Kenya
Understanding Renewable Energy in Kenya
Grace Mwaura
 
Going Green and Save Earth
Going Green and Save EarthGoing Green and Save Earth
Going Green and Save Earth
jin88lin
 
Making The Case For Green
Making The Case For GreenMaking The Case For Green
Making The Case For Green
Sustainable Performance Institute
 
Introduction to Permaculture - FELC February 8th 2014
Introduction to Permaculture - FELC February 8th 2014Introduction to Permaculture - FELC February 8th 2014
Introduction to Permaculture - FELC February 8th 2014
Vince Kirchner
 
ALTERNATIVE ENERGY AS VEHICLE FOR SUSTAINABILITY AND SUSTAINABLE DEVELOPMENT
ALTERNATIVE ENERGY AS VEHICLE FOR SUSTAINABILITY AND SUSTAINABLE DEVELOPMENTALTERNATIVE ENERGY AS VEHICLE FOR SUSTAINABILITY AND SUSTAINABLE DEVELOPMENT
ALTERNATIVE ENERGY AS VEHICLE FOR SUSTAINABILITY AND SUSTAINABLE DEVELOPMENT
Prashant Mehta
 
Prepare a 4-6 page analysis by answering the questions below. Be s.docx
Prepare a 4-6 page analysis by answering the questions below. Be s.docxPrepare a 4-6 page analysis by answering the questions below. Be s.docx
Prepare a 4-6 page analysis by answering the questions below. Be s.docx
ChantellPantoja184
 
Energy Resources Full Concept
Energy Resources Full ConceptEnergy Resources Full Concept
Energy Resources Full Concept
Vaibhav Malviya
 
“Integrated Solutions in Sustainable Green Energy and Transportation”
“Integrated Solutions in Sustainable Green Energy and Transportation”“Integrated Solutions in Sustainable Green Energy and Transportation”
“Integrated Solutions in Sustainable Green Energy and Transportation”
Green Parking Council
 
GREEN TECHNOLOGY (2).pptx
GREEN TECHNOLOGY (2).pptxGREEN TECHNOLOGY (2).pptx
GREEN TECHNOLOGY (2).pptx
ShrutiGhelani2
 
Green movement
Green movementGreen movement
Green movement
godforsaken07
 

Similar to Eii Overview & Energy Presentation.10.18.07 (20)

The Power Point
The  Power PointThe  Power Point
The Power Point
 
Stop Trashing the Climate: Zero Waste
Stop Trashing the Climate: Zero WasteStop Trashing the Climate: Zero Waste
Stop Trashing the Climate: Zero Waste
 
Renewable Energy Strategies For The Indian Railways
Renewable Energy Strategies For The Indian Railways  Renewable Energy Strategies For The Indian Railways
Renewable Energy Strategies For The Indian Railways
 
Bda Barossa 8th April
Bda Barossa 8th AprilBda Barossa 8th April
Bda Barossa 8th April
 
Green Team Project
Green Team ProjectGreen Team Project
Green Team Project
 
carbon_footprints_sustainable_solutions.ppt
carbon_footprints_sustainable_solutions.pptcarbon_footprints_sustainable_solutions.ppt
carbon_footprints_sustainable_solutions.ppt
 
Different Worlds Common Problems
Different Worlds Common ProblemsDifferent Worlds Common Problems
Different Worlds Common Problems
 
Understanding Renewable Energy in Kenya
Understanding Renewable Energy in KenyaUnderstanding Renewable Energy in Kenya
Understanding Renewable Energy in Kenya
 
National guard presentation updated
National guard presentation updatedNational guard presentation updated
National guard presentation updated
 
Going Green and Save Earth
Going Green and Save EarthGoing Green and Save Earth
Going Green and Save Earth
 
Making The Case For Green
Making The Case For GreenMaking The Case For Green
Making The Case For Green
 
Introduction to Permaculture - FELC February 8th 2014
Introduction to Permaculture - FELC February 8th 2014Introduction to Permaculture - FELC February 8th 2014
Introduction to Permaculture - FELC February 8th 2014
 
Khosla9.25.07
Khosla9.25.07Khosla9.25.07
Khosla9.25.07
 
ALTERNATIVE ENERGY AS VEHICLE FOR SUSTAINABILITY AND SUSTAINABLE DEVELOPMENT
ALTERNATIVE ENERGY AS VEHICLE FOR SUSTAINABILITY AND SUSTAINABLE DEVELOPMENTALTERNATIVE ENERGY AS VEHICLE FOR SUSTAINABILITY AND SUSTAINABLE DEVELOPMENT
ALTERNATIVE ENERGY AS VEHICLE FOR SUSTAINABILITY AND SUSTAINABLE DEVELOPMENT
 
Prepare a 4-6 page analysis by answering the questions below. Be s.docx
Prepare a 4-6 page analysis by answering the questions below. Be s.docxPrepare a 4-6 page analysis by answering the questions below. Be s.docx
Prepare a 4-6 page analysis by answering the questions below. Be s.docx
 
Energy Resources Full Concept
Energy Resources Full ConceptEnergy Resources Full Concept
Energy Resources Full Concept
 
“Integrated Solutions in Sustainable Green Energy and Transportation”
“Integrated Solutions in Sustainable Green Energy and Transportation”“Integrated Solutions in Sustainable Green Energy and Transportation”
“Integrated Solutions in Sustainable Green Energy and Transportation”
 
GREEN TECHNOLOGY (2).pptx
GREEN TECHNOLOGY (2).pptxGREEN TECHNOLOGY (2).pptx
GREEN TECHNOLOGY (2).pptx
 
Green movement
Green movementGreen movement
Green movement
 
Training: Designing Sustainable Business (xvids)
Training: Designing Sustainable Business (xvids)Training: Designing Sustainable Business (xvids)
Training: Designing Sustainable Business (xvids)
 

Recently uploaded

Slack (or Teams) Automation for Bonterra Impact Management (fka Social Soluti...
Slack (or Teams) Automation for Bonterra Impact Management (fka Social Soluti...Slack (or Teams) Automation for Bonterra Impact Management (fka Social Soluti...
Slack (or Teams) Automation for Bonterra Impact Management (fka Social Soluti...
Jeffrey Haguewood
 
Epistemic Interaction - tuning interfaces to provide information for AI support
Epistemic Interaction - tuning interfaces to provide information for AI supportEpistemic Interaction - tuning interfaces to provide information for AI support
Epistemic Interaction - tuning interfaces to provide information for AI support
Alan Dix
 
Accelerate your Kubernetes clusters with Varnish Caching
Accelerate your Kubernetes clusters with Varnish CachingAccelerate your Kubernetes clusters with Varnish Caching
Accelerate your Kubernetes clusters with Varnish Caching
Thijs Feryn
 
GraphRAG is All You need? LLM & Knowledge Graph
GraphRAG is All You need? LLM & Knowledge GraphGraphRAG is All You need? LLM & Knowledge Graph
GraphRAG is All You need? LLM & Knowledge Graph
Guy Korland
 
PHP Frameworks: I want to break free (IPC Berlin 2024)
PHP Frameworks: I want to break free (IPC Berlin 2024)PHP Frameworks: I want to break free (IPC Berlin 2024)
PHP Frameworks: I want to break free (IPC Berlin 2024)
Ralf Eggert
 
Neuro-symbolic is not enough, we need neuro-*semantic*
Neuro-symbolic is not enough, we need neuro-*semantic*Neuro-symbolic is not enough, we need neuro-*semantic*
Neuro-symbolic is not enough, we need neuro-*semantic*
Frank van Harmelen
 
"Impact of front-end architecture on development cost", Viktor Turskyi
"Impact of front-end architecture on development cost", Viktor Turskyi"Impact of front-end architecture on development cost", Viktor Turskyi
"Impact of front-end architecture on development cost", Viktor Turskyi
Fwdays
 
Key Trends Shaping the Future of Infrastructure.pdf
Key Trends Shaping the Future of Infrastructure.pdfKey Trends Shaping the Future of Infrastructure.pdf
Key Trends Shaping the Future of Infrastructure.pdf
Cheryl Hung
 
Leading Change strategies and insights for effective change management pdf 1.pdf
Leading Change strategies and insights for effective change management pdf 1.pdfLeading Change strategies and insights for effective change management pdf 1.pdf
Leading Change strategies and insights for effective change management pdf 1.pdf
OnBoard
 
Search and Society: Reimagining Information Access for Radical Futures
Search and Society: Reimagining Information Access for Radical FuturesSearch and Society: Reimagining Information Access for Radical Futures
Search and Society: Reimagining Information Access for Radical Futures
Bhaskar Mitra
 
FIDO Alliance Osaka Seminar: Passkeys and the Road Ahead.pdf
FIDO Alliance Osaka Seminar: Passkeys and the Road Ahead.pdfFIDO Alliance Osaka Seminar: Passkeys and the Road Ahead.pdf
FIDO Alliance Osaka Seminar: Passkeys and the Road Ahead.pdf
FIDO Alliance
 
From Daily Decisions to Bottom Line: Connecting Product Work to Revenue by VP...
From Daily Decisions to Bottom Line: Connecting Product Work to Revenue by VP...From Daily Decisions to Bottom Line: Connecting Product Work to Revenue by VP...
From Daily Decisions to Bottom Line: Connecting Product Work to Revenue by VP...
Product School
 
GenAISummit 2024 May 28 Sri Ambati Keynote: AGI Belongs to The Community in O...
GenAISummit 2024 May 28 Sri Ambati Keynote: AGI Belongs to The Community in O...GenAISummit 2024 May 28 Sri Ambati Keynote: AGI Belongs to The Community in O...
GenAISummit 2024 May 28 Sri Ambati Keynote: AGI Belongs to The Community in O...
Sri Ambati
 
UiPath Test Automation using UiPath Test Suite series, part 4
UiPath Test Automation using UiPath Test Suite series, part 4UiPath Test Automation using UiPath Test Suite series, part 4
UiPath Test Automation using UiPath Test Suite series, part 4
DianaGray10
 
De-mystifying Zero to One: Design Informed Techniques for Greenfield Innovati...
De-mystifying Zero to One: Design Informed Techniques for Greenfield Innovati...De-mystifying Zero to One: Design Informed Techniques for Greenfield Innovati...
De-mystifying Zero to One: Design Informed Techniques for Greenfield Innovati...
Product School
 
Builder.ai Founder Sachin Dev Duggal's Strategic Approach to Create an Innova...
Builder.ai Founder Sachin Dev Duggal's Strategic Approach to Create an Innova...Builder.ai Founder Sachin Dev Duggal's Strategic Approach to Create an Innova...
Builder.ai Founder Sachin Dev Duggal's Strategic Approach to Create an Innova...
Ramesh Iyer
 
When stars align: studies in data quality, knowledge graphs, and machine lear...
When stars align: studies in data quality, knowledge graphs, and machine lear...When stars align: studies in data quality, knowledge graphs, and machine lear...
When stars align: studies in data quality, knowledge graphs, and machine lear...
Elena Simperl
 
FIDO Alliance Osaka Seminar: Passkeys at Amazon.pdf
FIDO Alliance Osaka Seminar: Passkeys at Amazon.pdfFIDO Alliance Osaka Seminar: Passkeys at Amazon.pdf
FIDO Alliance Osaka Seminar: Passkeys at Amazon.pdf
FIDO Alliance
 
Kubernetes & AI - Beauty and the Beast !?! @KCD Istanbul 2024
Kubernetes & AI - Beauty and the Beast !?! @KCD Istanbul 2024Kubernetes & AI - Beauty and the Beast !?! @KCD Istanbul 2024
Kubernetes & AI - Beauty and the Beast !?! @KCD Istanbul 2024
Tobias Schneck
 
Essentials of Automations: Optimizing FME Workflows with Parameters
Essentials of Automations: Optimizing FME Workflows with ParametersEssentials of Automations: Optimizing FME Workflows with Parameters
Essentials of Automations: Optimizing FME Workflows with Parameters
Safe Software
 

Recently uploaded (20)

Slack (or Teams) Automation for Bonterra Impact Management (fka Social Soluti...
Slack (or Teams) Automation for Bonterra Impact Management (fka Social Soluti...Slack (or Teams) Automation for Bonterra Impact Management (fka Social Soluti...
Slack (or Teams) Automation for Bonterra Impact Management (fka Social Soluti...
 
Epistemic Interaction - tuning interfaces to provide information for AI support
Epistemic Interaction - tuning interfaces to provide information for AI supportEpistemic Interaction - tuning interfaces to provide information for AI support
Epistemic Interaction - tuning interfaces to provide information for AI support
 
Accelerate your Kubernetes clusters with Varnish Caching
Accelerate your Kubernetes clusters with Varnish CachingAccelerate your Kubernetes clusters with Varnish Caching
Accelerate your Kubernetes clusters with Varnish Caching
 
GraphRAG is All You need? LLM & Knowledge Graph
GraphRAG is All You need? LLM & Knowledge GraphGraphRAG is All You need? LLM & Knowledge Graph
GraphRAG is All You need? LLM & Knowledge Graph
 
PHP Frameworks: I want to break free (IPC Berlin 2024)
PHP Frameworks: I want to break free (IPC Berlin 2024)PHP Frameworks: I want to break free (IPC Berlin 2024)
PHP Frameworks: I want to break free (IPC Berlin 2024)
 
Neuro-symbolic is not enough, we need neuro-*semantic*
Neuro-symbolic is not enough, we need neuro-*semantic*Neuro-symbolic is not enough, we need neuro-*semantic*
Neuro-symbolic is not enough, we need neuro-*semantic*
 
"Impact of front-end architecture on development cost", Viktor Turskyi
"Impact of front-end architecture on development cost", Viktor Turskyi"Impact of front-end architecture on development cost", Viktor Turskyi
"Impact of front-end architecture on development cost", Viktor Turskyi
 
Key Trends Shaping the Future of Infrastructure.pdf
Key Trends Shaping the Future of Infrastructure.pdfKey Trends Shaping the Future of Infrastructure.pdf
Key Trends Shaping the Future of Infrastructure.pdf
 
Leading Change strategies and insights for effective change management pdf 1.pdf
Leading Change strategies and insights for effective change management pdf 1.pdfLeading Change strategies and insights for effective change management pdf 1.pdf
Leading Change strategies and insights for effective change management pdf 1.pdf
 
Search and Society: Reimagining Information Access for Radical Futures
Search and Society: Reimagining Information Access for Radical FuturesSearch and Society: Reimagining Information Access for Radical Futures
Search and Society: Reimagining Information Access for Radical Futures
 
FIDO Alliance Osaka Seminar: Passkeys and the Road Ahead.pdf
FIDO Alliance Osaka Seminar: Passkeys and the Road Ahead.pdfFIDO Alliance Osaka Seminar: Passkeys and the Road Ahead.pdf
FIDO Alliance Osaka Seminar: Passkeys and the Road Ahead.pdf
 
From Daily Decisions to Bottom Line: Connecting Product Work to Revenue by VP...
From Daily Decisions to Bottom Line: Connecting Product Work to Revenue by VP...From Daily Decisions to Bottom Line: Connecting Product Work to Revenue by VP...
From Daily Decisions to Bottom Line: Connecting Product Work to Revenue by VP...
 
GenAISummit 2024 May 28 Sri Ambati Keynote: AGI Belongs to The Community in O...
GenAISummit 2024 May 28 Sri Ambati Keynote: AGI Belongs to The Community in O...GenAISummit 2024 May 28 Sri Ambati Keynote: AGI Belongs to The Community in O...
GenAISummit 2024 May 28 Sri Ambati Keynote: AGI Belongs to The Community in O...
 
UiPath Test Automation using UiPath Test Suite series, part 4
UiPath Test Automation using UiPath Test Suite series, part 4UiPath Test Automation using UiPath Test Suite series, part 4
UiPath Test Automation using UiPath Test Suite series, part 4
 
De-mystifying Zero to One: Design Informed Techniques for Greenfield Innovati...
De-mystifying Zero to One: Design Informed Techniques for Greenfield Innovati...De-mystifying Zero to One: Design Informed Techniques for Greenfield Innovati...
De-mystifying Zero to One: Design Informed Techniques for Greenfield Innovati...
 
Builder.ai Founder Sachin Dev Duggal's Strategic Approach to Create an Innova...
Builder.ai Founder Sachin Dev Duggal's Strategic Approach to Create an Innova...Builder.ai Founder Sachin Dev Duggal's Strategic Approach to Create an Innova...
Builder.ai Founder Sachin Dev Duggal's Strategic Approach to Create an Innova...
 
When stars align: studies in data quality, knowledge graphs, and machine lear...
When stars align: studies in data quality, knowledge graphs, and machine lear...When stars align: studies in data quality, knowledge graphs, and machine lear...
When stars align: studies in data quality, knowledge graphs, and machine lear...
 
FIDO Alliance Osaka Seminar: Passkeys at Amazon.pdf
FIDO Alliance Osaka Seminar: Passkeys at Amazon.pdfFIDO Alliance Osaka Seminar: Passkeys at Amazon.pdf
FIDO Alliance Osaka Seminar: Passkeys at Amazon.pdf
 
Kubernetes & AI - Beauty and the Beast !?! @KCD Istanbul 2024
Kubernetes & AI - Beauty and the Beast !?! @KCD Istanbul 2024Kubernetes & AI - Beauty and the Beast !?! @KCD Istanbul 2024
Kubernetes & AI - Beauty and the Beast !?! @KCD Istanbul 2024
 
Essentials of Automations: Optimizing FME Workflows with Parameters
Essentials of Automations: Optimizing FME Workflows with ParametersEssentials of Automations: Optimizing FME Workflows with Parameters
Essentials of Automations: Optimizing FME Workflows with Parameters
 

Eii Overview & Energy Presentation.10.18.07

  • 1. Environmental Impact Initiative (EII) Organization & Energy Industry Overview Managing Director David A. Champion Revision Date: October 18, 2007
  • 2. EII –Organization & Energy Industry Overview Contents Questions & Answers 2 Environmental Impact Initiative –Premise & Mission 5 Presentation Scope 7 Glossary of Terms & Acronyms 8 Executive Summary 9 What is energy? And, why is it important? 12 Where does energy come from? –The life cycle of gasoline, coal and natural gas 13 Why is energy demand increasing? –Macroeconomics 17 How do hydrocarbons affect our environment? 26 Why is the cost of fossil fuels increasing? 42 Fossil fuels are a limited natural resource 61 U.S. energy policy 69 Renewable energies (Wind, Solar, Hydro, Geothermal) 72 Improving existing technologies (Clean-Coal, Natural Gas, Nuclear, Waste-to-Energy) 99 Automobiles & Alternative fuels (Ethanol, Bio-diesel, Hydrogen) 121 Energy conservation 151 Carbon footprint & offsets 170 Conclusion 174 Sources & References 175 –2– ©2007 Environmental Impact Initiative
  • 3. EII Questions: 1. The United States represents 5% of the earth’s population; what percent of the world’s greenhouse gas emissions do we emit? 2. What percent of waste does America recycle? 3. How much carbon dioxide does 1 gallon of gasoline produce? 4. What is the federally mandated fuel economy standard in the U.S.? 5. If every car in the U.S. increased its fuel efficiency by 7.6 miles per gallon, we could stop importing oil from which global region? 6. If the United States became solely dependent upon its own domestic production of oil from current wells to fuel our economy, how long could we sustain our current consumption rates? 7. What costs more 1 gallon (8 x 16 oz. bottles) of filtered water, or one gallon of regular unleaded gasoline? 8. How many trees would the average U.S. household have to plant each year to absorb the amount of carbon dioxide they emit? 9. Where does our electricity come from in the United States? 10. How many children today have asthma in the United States? 11. How many of the contiguous 48 states is it NOT permissible to eat all types of fresh water fish due to high levels of mercury? 12. Two of the fastest growing renewable energy generation methods are Solar and Wind, where were these technologies invented? –3– ©2007 Environmental Impact Initiative
  • 4. EII Answers: 1. The United States emits 30% of the world’s greenhouse gases. The average U.S. household emits 41,800 lbs. of carbon dioxide or 5 times the average global household quantity. 2. According to the U.S. EPA, Americans dispose of 250 million tons of municipal solid waste per year (4.5 lbs. per person/per day) and recycle 23.8% of this waste and compost 8.4%. 3. 1 gallon of gasoline at 6.3 lbs. produces 19.4 lbs. of carbon dioxide, this is because when hydrocarbons burn, the carbon molecules are combined with two oxygen molecules to form CO2, which is 3 times heavier than the original gasoline. The average car burns its weight in CO2 every 4 months. 4. In 1987 the U.S. fuel economy was 22.1 miles per gallon (mpg) for light-duty vehicles and was reduced to 20.9mpg in 1997 and then 21.0mpg in 2006, remaining relatively unchanged for over 20 years. 5. 7.6 more miles/gal. on every car in the U.S. would result in independence from Middle East oil imports. 6. The U.S. holds about 680 million barrels of strategic oil reserves, produces 4.66MM barrels per day domestically, but consumes 21MM barrels per day resulting in only 40 days of domestically available oil. 7. The average U.S. price for a 16oz. bottle of purified water is $1.00 x 8 = $8.00/gallon or 2.5 times more than a gallon of gasoline. Americans consumed 8.3billion gallons of bottled water in 2006, costing $66.4bn dollars. 8. The average mature tree consumes about 48 lbs. of CO2 per annum. If the average U.S. household emits 41,800 lbs. of carbon dioxide, each household would need to plant 871 trees per year to be carbon neutral. 9. 49% of our electricity comes from coal-fired power plants, 20% from natural gas, 19.4% from nuclear, 7% hydroelectric, 2.4% from renewable energy sources such as, biofuels, waste to energy, solar and wind. 10. Asthma currently affects 6.2 million children and is the most common chronic childhood disorder, it is the leading cause of absenteeism in schools. 80% of asthmatic cases, especially in Black and Hispanic children takes place in industrial regions that do not meet U.S. EPA federal air pollution standards. 11. You cannot eat all types of fresh water fish in 44 states due to high levels of mercury. The burning of coal and mining causes the majority of mercury, lead, and arsenic poisoning in the United States. 12. Both solar and wind electrical generation were invented in the U.S.A., however both of these technologies are now predominantly supplied by German, Japanese, and Chinese companies. –4– ©2007 Environmental Impact Initiative
  • 5. EII The Environmental Impact Initiative -Premise The questions and answers on the previous pages are meant to be thought provoking and provide examples of the energy related challenges that exist today both globally and in the U.S. These challenges are summarized below: There exists today an uncertain and diminishing supply of conventional energy sources at affordable prices to meet a growing world demand. Fossil fuels used as the primary energy source, cause human and environmental harm. Poor waste management and a lack of sustainable business practices affect our natural resources such as water, soil, air, and forests. Animosity towards the U.S. based on our per capita energy use and pollution emissions will only increase unless we take a leadership role in environmental stewardship, sustainable product development, renewable energy projects and international energy policy. Be sure that these issues will define this new millennium. The solutions to these challenges rest in our ability to adopt energy efficient practices and products, in our ability to develop economically viable renewable energies, to produce alternative transportation vehicles and fuels, and in managing our waste and pollution emissions with the goal of protecting our valuable natural resources and progressing a sustainable energy future. The Environmental Impact Initiative (EII) was created to be the vehicle through which we communicate the above issues, research affordable and actionable solutions, and through our members and sponsors, we make these solutions a reality. –5– ©2007 Environmental Impact Initiative
  • 6. EII The Environmental Impact Initiative -Mission Mission Statement: To initiate environmental stewardship with businesses and residents by demonstrating the positive financial and social impacts of resource preservation, energy conservation, pollution minimization and waste management best-practices within the urban setting. Vision: Pollution controls, waste management, renewable energies, energy-efficient technologies, and environmental best-practices will protect our depleting natural resources, provide sustainable energy to the masses, and will yield both ecological as well as financial benefits to the cities in which we execute our mission. Guiding Principles: Lead by example, be a catalyst for positive environmental change at home and in your community Solutions must be financially and environmentally justified to be sustainable Tirelessly research and analyze new products, technologies and practices to establish best-in-class solutions Remain politically neutral as pollution, resource depletion, and improving our living environment equally impacts every person despite their political preference Focus on positive messages, benefits and actions Build an effective and active membership based upon these key traits: trust, honesty, diversity, mutual respect, complete communication, a shared vision, and a collaborative effort focused on results All funding and use of monies will be made transparent to sponsors and members Perform every task with a sense of urgency –6– ©2007 Environmental Impact Initiative
  • 7. EII EII: Research, Promote, Act Research: The environmental impact initiative will tirelessly research and analyze products, services, companies, and processes which will fulfill our mission statement. The EII will act as a resource for other institutions and clients, therefore must stay abreast of the latest environmental and energy trends. Research tools include various publications, industry or technology expert reviews, company specific meetings, research papers done by financial or academic institutions, and from meetings with other energy/environmental groups. Promote: Education and public awareness are at the forefront of long-term, sustainable changes and social movements. Clients must be aware of the issues and potential solutions in order to properly act. The use of billboards, newsprint, promotional products, and our website will be used to create awareness. Presentations at schools, businesses, and environmental events will help educate the public. Hosting large environmental seminars with expert discussion panels, company/product overviews, and subject specific breakout sessions will help promote the adoption and investment in our subject matter. A strong and diverse social network of EII members and sponsors will help spread the word. Act: Through our sponsors and members we will work to implement the services, products, technologies, processes and practices that we promote. Action can take many forms: volunteer work at an environmental community project, writing and implementing a best-in- class recycling program for a commercial office building, motivating residents or businesses to better insulate their homes or purchase energy-efficient appliances, working with target businesses to evaluate the implementation of solar panels on their property and working with city or state officials to influence policy, promote renewable projects, carbon offsets, energy- efficient products or purchasing fuel efficient vehicles. –7– ©2007 Environmental Impact Initiative
  • 8. EII Presentation Scope This presentation is designed to: Provide potential members and sponsors with an overview and purpose of the EII organization Articulate the EII view of the energy industry, current issues, and viable solutions Validate our view with factual data, detailed references, and expert advice Inspire our audience to make changes in their own lives and to be a positive example for others To recruit members and sponsors –8– ©2007 Environmental Impact Initiative
  • 9. EII Glossary of Terms & Acronyms AEO – Annual Energy Outlook LNG – Liquid Natural Gas Bbls – Billion Barrels of Oil MCF – Thousand Cubic Feet BTU – British Thermal Unit MTOE – Million Tonnes Oil Equivalence CO2 – Carbon Dioxide MW – MegaWatt CNG – Compressed Natural Gas NAP –Northern Appalachian Coal DOE – U.S. Department of Energy NG – Natural Gas EIA – U.S. Energy Information Administration Non-OECD – Non members of the OECD EII – Environmental Impact Initiative OECD – Organisation for Economic Co- operation & Development EPA – U.S. Environmental Protection Agency OPEC – Organization of the Petroleum EtOH - Ethanol Exporting Countries EU – European Union PTW – Pump to Wheels FC – Fuel Cell PV – PhotoVoltaic –solar cells FCV – Fuel Cell Vehicle R&D –Research & Development GDP – Gross Domestic Product RFG – ReFormulated Gasoline (regular gasoline GHG – Greenhouse Gas blended with ethanol) H or H2 - Hydrogen TCF – Trillion Cubic Feet HEV – Hybrid Electric Vehicle TW – Terawatts (1 trillion watts) ICE – Internal Combustion Engine USD – United States Dollar ICEV – Internal Combustion Engine Vehicle WTI – West Texas Intermediate –crude oil IEA – International Energy Agency designation kWh – KiloWatt Hour WTP – Well to Pump LDV –Light Duty Vehicle WTW – Well to Wheel –9– ©2007 Environmental Impact Initiative
  • 10. EII Executive Summary World energy demand is increasing at a rate of 1.8% per annum, due to global population growth, the industrialization of China and India, and the desire of industrialized nations to continue to grow their own gross domestic products. 87.5% of the world’s energy currently comes from the burning of hydrocarbons (fossil fuels). Electricity is primarily generated by coal and natural gas, whereas transportation fuels come from petroleum. As fossil fuels are burned and converted into energy, they release carbon dioxide as well as a variety of other harmful greenhouse gases and pollutants. Scientists and politicians around the world now believe that the continued use of fossil fuels negatively impacts human health, the environment as well as geo-political stability. As a result, hydrocarbons carry with them a very high societal cost. Fossil fuel prices will remain relatively high vs. historical values. Prices will be driven by increased global demand, resource depletion, marginal cost increases in extracting more difficult unconventional sources, higher refinement costs of heavier more sulfur laden oil, transporting fuels from greater distances, production constraints of petroleum providers and the additional cost of pollution controls. Fossil fuels are a limited natural resource. As these increasingly important and costly resources diminish we are seeing examples of protectionism, fascism, and war play out on the global stage. Energy independence needs to become a primary objective of the United States. Reducing our dependency upon foreign energy supplies, minimizing energy price fluctuations, and diversifying our energy portfolio means long-term economic stability for America. The United States will follow the rest of the world with some form of a carbon tax or carbon cap and trade proposal in efforts to reduce greenhouse gas emissions, but will most likely not mandate the change until the next presidential election in 2009 or until the next evolution of the Kyoto protocol envisioned by 2012. – 10 – ©2007 Environmental Impact Initiative
  • 11. EII Executive Summary –(continued) Federal and state governments as well as concerned citizen utility boards work to keep our gas prices and utility costs low by mandating utility price caps on electricity, maintaining low taxes on gasoline and other fuels, providing subsidies and tax incentives to offset the increased cost of fossil fuel discovery and production, and have grandfathered in older- more pollutive facilities which do not meet current U.S. EPA clean air standards. Inadvertently, these practices perpetuate the use of older, less efficient power plants and deter the capital investment in more efficient generating technologies, renewable energies and pollution control systems. The U.S. federal government along with many states are working to develop new energy policies, incentives and grants focused on energy conservation, fuel-efficiency standards, renewable energy projects, alternative transportation fuels and, green building design/construction. Today, residents and businesses alike can benefit financially as well as environmentally by taking advantage of existing tax credits, grants, green mortgages, solar & wind projects, and the purchase of energy-efficient appliances. Coal is a highly abundant domestic resource which promises to supply the United States with enough energy to meet our needs for the next 200 years. Coal however, in its current form, has the worst pollution profile of any electrical generation fuel and poses serious health and environmental risks. Given that 49% of today’s electricity in the U.S. is generated by coal-fired power plants, significant research & development in clean-coal technologies, and strict government pollution policies are required to keep coal a viable, long- term energy source. Nuclear power, although heavily debated as a ‘clean energy’ will continue to be instrumental on a global and U.S. basis to meet future electricity demands. Nuclear power offers low kWh costs, reliable electrical output, low societal costs and virtually zero greenhouse gas emissions. Wind power has achieved global compounded annual growth rates of 30%. Larger wind turbines and component economies of scale allow wind to be on grid parity with fossil fuel generators. However, wind farms need to overcome variable power output with more electrical storage capacity, need to be strategically placed in areas which do not effect migratory bird paths and require better marketing to overcome their negative aesthetics and sound perceptions. – 11 – ©2007 Environmental Impact Initiative
  • 12. EII Executive Summary –(continued) Solar promises to offer the greatest energy potential of any electrical generation method. More solar energy hits the earth in 1 hour than the planet uses in an entire year. Harnessing that solar energy through photovoltaic and thermal cells requires increased R&D on materials and cell efficiencies. The U.S. as well as other governments are sharing in R&D expenses and offering financial incentives to early adopters to facilitate economies of scale for solar producers. The solar industry expects PV cells to be at electrical grid parity by 2012. Capturing and using methane gas from dairy farms, ranches, landfills, and sewage treatment facilities has a dual benefit: 1) methane gas accounts for about 18% of greenhouse gas emission and is 25 times more potent than carbon dioxide at trapping heat in the atmosphere, and 2) methane gas can be combusted to drive electrical generators or can be used to generate steam for industrial purposes. In the U.S., corn ethanol will increase in growth and popularity with continued government blender credits and import tariffs, but is not sustainable in the long-term. Corn ethanol has a high feedstock cost, inadequate farmable acres to meet future growth expectations, requires large water reserves, has quality issues, increases the cost of corn for livestock feed, and is not competitive to regular gasoline in price or btu value. Although still in the developmental stage, cellulosic and thermal-chemical ethanol promises to produce lower cost ethanol using a wide variety of municipal solid, agricultural, or forestry waste. Increased government fuel efficiency standards for automobiles, greater environmental awareness and higher conventional fuel prices will drive more hybrid adoption, the return of the electric car, and the slow evolution of the hydrogen fuel cell. The term “negawatt”, coined by Amory Lovins, means a unit of saved energy. Instead of looking for ways to generate more energy to meet our growing global demand, we instead look for ways to reduce our energy demands. This concept has sparked a wide variety of energy saving products, services and practices that can help home-owners, commercial building owners, and industrial spaces save money and the environment by reducing their overall energy or utility spend. The U.S. EPA-Energystar and U.S. Green Building Council’s LEED programs are changing the way that architects, builders, and construction suppliers design, build and operate new or renovated spaces. – 12 – ©2007 Environmental Impact Initiative
  • 13. EII What is energy? And, why is it important? en·er·gy [ énnərjee ] (plural en·er·gies) -1. ability to do things: the ability or power to work or make an effort, 2. vigor: liveliness and forcefulness, 3. forceful effort: a vigorous effort or action, 4. power supply or source: a supply or source of electrical, mechanical, or other form of power, 5. physics capacity to do work: the capacity of a body or system to do work. Energy is used in every aspect of modern day life whether its driving your car, turning on a light, or preparing food, energy is important because we wouldn’t have the quality of life that we so enjoy without it’s benefit. The truth is that most American’s don’t think about energy, unless fuel prices increase significantly enough to affect our purchasing decisions or change our behavior. However, it is important to understand the ‘life cycle’ of the energy we use. This includes which energy source or fuel we are consuming, where the fuel came from, how it was produced, how it was supplied to us, what benefit do we receive from it, what waste or byproduct does it generate, and what is the net affect on society, the environment, and our economy? To demonstrate the life cycle of a few key energy sources, we will look at a simplified selection of our most common energy sources: petroleum for motor fuel, coal for electricity, and natural gas for heating. We will look at all major steps of these fuel sources to gain a better understanding of the process and industry that is in place to provide us with the comforts and quality of life that we enjoy. – 13 – ©2007 Environmental Impact Initiative
  • 14. EII-Where does energy come from? Life cycle of gasoline 5Blender-distributors take Crude oil is discovered, 3 1 Refineries purify, distill drilled, and pumped from the motor fuel and mix it and formulate a number deep sea platforms or with detergents & octane 7 of different fuels as well Consumers pump the gas from land-based jack- enhancers such as ethanol as petrochemicals to create different grades of into their vehicles and pumps drive off gasoline 2 Crude oil is 4 sent through Motor fuels are 6 Tank trucks then pipelines or usually piped to large transport the delivered to storage tanks or can blended fuels to refineries via be transported via multiple gas oil freighters railcars or tank trucks stations to storage tanks Inputs: electricity, natural gas, motor fuels, energy intensive heavy equipment, massive logistics & infrastructure Outputs: fossil fuel pollution, physical and residual destruction to ocean floor, land, aquifers, natural gas and methane release or flare, petroleum vapors from distribution, storage and pumping, combustion of petroleum is the single largest contributor to carbon dioxide emission in the United States 66% of U.S. oil is imported contributing $314 billion dollars to the U.S. deficit per year, the burning of petroleum contributes to 25% of the smog in our cities, the U.S. spends $50bn per year to militarily secure oil supplies – 14 – ©2007 Environmental Impact Initiative
  • 15. EII-Where does energy come from? Life cycle of coal-fired electrical generation 4 Coal-fired power plants burn 6 Electricity 1 the coal in large boilers which provides us 3 Coal is Coal is excavated from either heats water into steam which with the transported underground coal mines or then turns a large turbine ability to run a to power large topical strip mines creating electricity wide variety of plants in appliances, large equipment and quantities products via barges or railcars called unit trains 2 Coal is then pulverized into 5 Electricity is then carried smaller chunks and through a vast network of made ready for substations and power transport lines to our homes and businesses Inputs: electricity, natural gas, motor fuels, energy intensive heavy equipment, massive infrastructure & logistics, difficult and hazardous working conditions Outputs: sulfuric acid water run-off, sulfur dioxide leading to acid rain, nitrogen oxides, mercury, lead, arsenic along with other heavy metal pollution, coal is the second largest contributor to CO2 emissions in the U.S. Note: 49% of U.S. electricity is generated from coal-fired plants consuming 1 billion tons of coal per year, coal is domestically available and is a primary export of the United States. – 15 – ©2007 Environmental Impact Initiative
  • 16. EII-Where does energy come from? Life cycle of natural gas 1 Natural gas (NG) 3 Processing plants remove comes from similar impurities from the gas and 5 Storage facilities underground wells hold the methane make the gas ready to be 8 NG and LNG can be used to fuel like oil; exploration, gas and make it compressed and moved our ovens, stoves, furnaces, hot drilling and regionally available through pipelines, or they can water heaters and automobiles production takes for use turn the gas into liquid fuel place in the ocean or (LNG) 6 Gas meters on land measure our consumption 2NG is then 4 Gas pipelines are compressed at 100 mile piped or shipped in bulk intervals, allowing the gas to travel long 7 Natural gas is used to distances, most of these pipes are to a processing generate electricity as well as underground plant for industrial heat Inputs: electricity, natural gas, motor fuels, energy intensive heavy equipment, large infrastructure & logistics Outputs: although cleaner than coal or petroleum, natural gas is still considered a fossil fuel which releases carbon dioxide, carbon monoxide, and methane gases. The exploration, production and distribution of natural gas is destructive to the ocean floor, land, forests, air and water. – 16 – ©2007 Environmental Impact Initiative
  • 17. EII-Where does energy come from? Section Review The previous slides demonstrate three conventional fossil fuel supply chains or ‘life cycles’. The supply chains for petroleum, coal and natural gas are energy intensive, complex, span multiple continents, require massive amounts of capital cost, annual maintenance, and logistics. These supply chains are also prone to disruptions for a number of reasons: war, natural phenomenon like hurricanes and floods, political embargoes or maneuvering, production capacity constraints, safety violations, regulatory reasons, and of course natural resource depletion. In order to provide a growing global market with ample and stable supplies of energy at affordable prices, the supply from these fossil fuel sources need to continue to grow in line with global demand. To better understand what is driving global demand, and how much more of these primary energy sources will be required, we need to look at global economics. – 17 – ©2007 Environmental Impact Initiative
  • 18. EII-Why is energy demand increasing? Macroeconomics The global population currently stands around 6.6 billion people and is growing at a rate of 1.3% or 78 million people per year China and India (and other non-OECD nations), will grow their energy demands by 2.6% p.a. as they work towards a GDP growth rate of 5.3% vs. mature OECD economies whose energy demands are only increasing by .8% per year with GDP targets of 2.5% Global GDP per capita is approximately $9300 and growing at a rate of 4.1% per annum. As GDP increases so does demand for energy and energy sources per person. In comparison, global energy (in BTUs) per capita is 70MM whereas the U.S. is 284MM BTUs per person, this indicates that there is a lot more energy to be consumed per person as the majority of the world’s population achieves a higher GDP The shift in energy consumption demonstrates that OECD nations are moving from energy intensive industries to more services, and non-OECD nations are growing GDP through industrialization, which requires more energy and electricity generated from cheap sources Global energy demands will be led by industrial uses, transportation, residential and then commercial sectors; electrical generation for industrial uses requires the vast majority of coal & natural gas, while the transportation sector requires oil. Oil, Coal, Natural Gas, Nuclear and Renewable are today’s ranking of global energy sources. The EII believes that there will be a major shift from oil as the primary energy source to coal, and that wind will break out as the primary ‘renewable’ source in the short-term, followed by hydroelectric and then solar in the long-term OPEC has 77% of the world’s oil reserves, the former Soviet Union has 10%, whereas the U.S. only has 2%. However, the U.S. consumes 26% of global oil production making energy independence a major issue for the U.S. as well as other countries. – 18 – ©2007 Environmental Impact Initiative
  • 19. EII-Why is energy demand increasing? -Macroeconomics The world population is growing by 78MM people per annum, additional energy production is required to meet growing demand Global population estimated at 6.6 bn in 2007 2007 – 19 – ©2007 Environmental Impact Initiative
  • 20. EII-Why is energy demand increasing? -Macroeconomics Growing GDP, especially through the industrialization of Non- OECD nations China & India = 1/3 Earth’s population 14.0 Non-OECD GDP Non-OECD Energy Demand 12.0 GDP & Energy Growth % per Year OECD GDP Non-OECD GDP & Energy Demand OECD Energy Demand “Cumulative Growth” 10.0 Global GDP/Energy Analysis: 8.0 •4.1% annual global GDP growth rate OECD and Non- OECD GDP •1.8% annual global Energy growth from 1980 6.0 base level growth rate •Non-OECD GDP growth = 4.0 5.3% •Non-OECD Energy growth = 2.0 2.6% •OECD GDP growth = 2.5% 0.0 •OECD Energy growth = 0.8 1980 1984 1988 1992 1996 2000 2004 2008 2012 2016 2020 2024 2028 Energy Information Administration, International Energy Outlook 2007 – 20 – ©2007 Environmental Impact Initiative
  • 21. EII-Why is energy demand increasing? -Macroeconomics Comparison of US, China and India GDP and carbon emissions per capita. As China and India grow so will their energy demands and their pollution emissions Carbon Dioxide Emissions & GDP Per Capita 2004 40.0 35.0 CO2 Emissions (Mt/Capita) GDP (Thsd USD/capita) GDP per Capita 30.0 25.0 GDP per CapitaCapita Emissions per 20.0 Emissions per capita 15.0 Global GDP per 10.0 capita average 5.0 0.0 Japan India Africa Australia/New Canada OECD Europe South Korea Russia Mexico China Other Non- Other Other Non- United States Brazil Middle East Energy Information Administration, Carbon Dioxide & GDP per capita by region, 2004 – 21 – ©2007 Environmental Impact Initiative
  • 22. EII-Why is energy demand increasing? -Macroeconomics Global energy use by sector –Industry leads, demonstrating more energy required by industrializing nations: China & India Energy by End Use Sector 300.0 250.0 quadrillion btus Transportation 200.0 Industrial 150.0 Residential 100.0 Commercial 50.0 0.0 2004 2015 2030 Energy Information Administration, International Energy Outlook 2007 *To put these figures into perspective, total global electricity demand is now 470.63 quadrillion btu’s or equal to approx. 5,372,489 megawatts of power per year. This is equal to 7,163 average sized coal-fired power plants or 4,297 average nuclear plants. Our global electricity demand is expected to grow to 714.62 quad btu’s per annum by the year 2030. This means that we need to increase our electrical supply by 52% over the next 23 years. Much of which is occurring in China and India by adding 1 new 750MW coal-fired power plant per week! – 22 – ©2007 Environmental Impact Initiative
  • 23. EII-Why is energy demand increasing? -Macroeconomics The transportation sector uses 60% of all oil produced, global demand requires an additional 580 million more barrels per year Oil Use by Sector (Mtoe) 3500 3000 2500 Transport 2000 Industry Mtoe All Other Sectors 1500 Non-energy Uses 1000 500 0 2002 2010 2020 2030 Source: IEA WEO2004 *To put this global demand figure into perspective, the world consumes 30.3 billion barrels of oil per year today, the U.S. consumes 7.7 billion barrels per year or 26% of the world’s total. By 2030, world demand is expected to grow to 43.07 billion barrels per year or 42%. The U.S. is expected to represent 24% of this total or 10.1 billion barrels per year. – 23 – ©2007 Environmental Impact Initiative
  • 24. EII-Why is energy demand increasing? -Macroeconomics Comparison of global energy supply from 2007 to 2030 2030 2007 World Energy Breakdown % Hydroelectric Coal surpasses Oil as the primary energy • 5.8% source Natural Nuclear Natural Gas and Oil decrease, giving way to • Gas Wind 6.0% growing alternative energies 23.1% 0.6% Coal Wind is now the dominate alternative • BioFuels 26.8% energy source, renewables represent 20.3% 0.6% of total Geothermal 0.1% More nuclear plants are established, • Oil Solar followed by Hydro and Solar electricity 37.0% Other 0.0% generation 7.1% 2007 2030 World Energy Breakdown % 87.5% of the world’s energy comes • Hydroelectric Wind from fossil fuels Nuclear Natural Gas 4.1% 12.0% 4.5% 20.7% Oil is dominate energy source • Solar mainly for transportation 3.4% Oil Hydroelectric power generation • Geothermal 25.4% and Nuclear are the largest “clean 0.4% energies” BioFuels Coal Hydrogen 0.2% 29.1% Renewables only represent 7% of • 0.1% total energy supply Coghill Capital Research, Energy Generation Matrix 2007 – 24 – ©2007 Environmental Impact Initiative
  • 25. EII-Why is energy demand increasing? -Macroeconomics United States energy production by fuel type U.S. Energy Generation by Source 2006 Renewable Petroleum (Solar/Wind) 2% Other (landfill 2% methane) 1% Hydroelectric Coal 7% Natural Gas Nuclear Nuclear Coal 19% Hydroelectric 49% Renewable (Solar/Wind) Petroleum Natural Gas Other (landfill methane) 20% Source: EIA, net Generation by Energy Source, 2006 Annual Review Today, fossil fuels represent 72% of the energy fuel used to power the U.S. What will be the leading energy source in 10, 20, 50 years from now? Coal?, Nuclear?, Solar? What are the political, industrial, and environmental impacts of changing energy sources? – 25 – ©2007 Environmental Impact Initiative
  • 26. EII-Why is energy demand increasing? -Macroeconomics Section Review Population growth creates an inherent demand on energy to feed, cloth, and shelter more people in the world. As emerging nations like China and India grow their economies through industrialization they will require more energy than OECD or industrialized nations. Furthermore, as China and India develop a middle class, these individuals now have the ability to purchase motorized vehicles which require gasoline, homes or apartments which require heat and electricity, and now have the disposable income to purchase more clothing, food, and consumables, all of which consume more energy. Currently, fossil fuels represent the largest portion (87.5%) of the world’s energy sources, and 72% of the United States energy sources. If we are to meet a growing world and U.S. demand, we need to locate, produce, distribute, and consume more fossil fuels, also known as hydrocarbons. In the following section, we will chemically define what a hydrocarbon is and why burning or combusting hydrocarbons are believed to cause unprecedented human and environmental health risks. – 26 – ©2007 Environmental Impact Initiative
  • 27. Molecular Components and Weight of Dry Air EII –How do hydrocarbons affect our environment? Molecular Mass-M M in Dry Air Component Component % Nitrogen (N2) 0.7809 28.02 21.88 Oxygen (O2) 0.2095 32.00 6.704 Argon (Ar) 0.00933 39.94 0.373 Carbon Dioxide (CO2) 0.0003 44.01 0.013 The chemistry of hydrocarbon combustion Hydrogen (H2) 0.0000005 2.02 0 Molecular Mass = 28.97 Pure Hydrocarbon (Methane) = CH4 Where 1 carbon is bonded with 4 hydrogen molecules H=1 (M=16) where M – indicates molecular weight H = 1C=12H = 1 H=1 Hydrocarbon chains link additional carbon molecules with more hydrogen molecules to form straight, branched or ring structures = ethane (C2H6), propane (C3H8), kerosene (C12H26), etc… Complete Combustion occurs when hydrocarbons are burned in the presence of excess oxygen, resulting in carbon dioxide, water vapor, and the release of energy as heat and light. H=1 O=16 C=12 O=16 O=16 O=16 O=16 H = 1C=12H = 1 O=16 O=16 H=1 H=1 H=1 H=1 O=16 H=1 H2O H2O CO2 2O2 CH4 M = 18 M = 18 M = 44 M = 64 M = 16 Incomplete Combustion occurs when insufficient oxygen is present, resulting in carbon monoxide, straight carbon (or both), water vapor, and the release of energy as heat and light. H=1 C=12 O=16 O=16 H = 1C=12H = 1 O=16 H=1 H=1 O=16 H=1 H2O O2 CO CH4 M = 18 M = 32 M = 28 M = 16 *To summarize, combusting hydrocarbons breaks apart carbon and hydrogen molecules and allows them to be bonded with other available molecules such as oxygen, sulfur, nitrogen, and other carbon or hydrogen molecules to create entirely new chemical compounds. – 27 – ©2007 Environmental Impact Initiative
  • 28. EII –How do hydrocarbons affect our environment? How does hydrocarbon combustion affect our environment? Complex and naturally occurring hydrocarbons have been concealed underground for millions of years in the form of coal, crude oil, and methane gas. Only in the past 200 years since the industrial revolution have we begun to excavate, produce and combust these fossil fuels for electricity, motor fuel, and heat at increasing levels. As we learned in the previous slide, hydrocarbon combustion results in the creation of new chemical compounds. Free carbon molecules are combined with oxygen molecules to form CO carbon monoxide –a toxic gas, or two oxygen molecules to form CO2 carbon dioxide –which is believed to be the major contributor to the greenhouse effect. Furthermore, water vapor (H2O M=18) and carbon monoxide (CO M=28) are lighter than dry air (N,O,H M=29) and will rise, and carbon dioxide (CO2 M=44) and ozone (O3 M=48) are heavier than dry air and will form a grey haze near the ground which we call smog. Other than burning very pure methane gas, hydrocarbons almost always contain impurities. These impurities can range from mercury, lead and arsenic to low levels of uranium and thorium or other naturally occurring radioactive isotopes. All of which are considered carcinogens or mutagens and adversely affect humans and animals. According to Oak Ridge National Laboratory, Americans living near coal-fired power plants are exposed to higher radiation doses than those living near nuclear power plants. Beside the carbon oxides discussed above, other chemical compositions resulting from the burning of hydrocarbons include noxious and poison compounds like sulfur oxide & nitrous oxide, both of which are federally regulated now by the United States. Ozone (O3) is an indirect byproduct of hydrocarbon combustion and sunlight, resulting in a powerful oxidizing agent as well as a leading cause of bronchial aggravation or asthma. Although numerous byproducts come from the combustion of hydrocarbons, it is the greenhouse gases that have stirred so much controversy over the past 10 years. – 28 – ©2007 Environmental Impact Initiative
  • 29. EII –How do hydrocarbons affect our environment? The Greenhouse effect Greenhouse gases include water vapor, carbon dioxide, methane, nitrous oxide and ozone. These greenhouse gases are the primary byproduct of hydrocarbon combustion. NACC/USGCP graphic Union of Concerned Scientists for Environmental Solutions – 29 – ©2007 Environmental Impact Initiative
  • 30. EII –How do hydrocarbons affect our environment? Scientists speculate that the Earth’s temperature will rise in correlation to carbon dioxide levels in our atmosphere Ice core samples dating back 400,000 years demonstrate the positive correlation between atmospheric CO2 content and the Earth’s surface temperature Red Line is Carbon Dioxide Content (PPM) Blue Line is Earth’s surface temperature (C) Historical carbon dioxide record from the Vostok ice core samples, “Climate and atmospheric history of the past 420,000 years” 1999, Petit J.R., Jouzel J; .and Alexey Fedorov The Pliocene Paradox, Science 312, 1485-1489, June 2006 Yale – 30 – ©2007 Environmental Impact Initiative
  • 31. EII –How do hydrocarbons affect our environment? Greenhouse gases primarily come from electrical generation, industrial processes, transportation and agricultural byproducts Emissions Database for Global Atmospheric Research, (EDGAR) version 3.2, 2000 – 31 – ©2007 Environmental Impact Initiative
  • 32. EII –How do hydrocarbons affect our environment? A proliferation of headlines, articles and books inspire political and scientific debate, global warming or just pollution? – 32 – ©2007 Environmental Impact Initiative
  • 33. EII –How do hydrocarbons affect our environment? United Nations Framework Convention on Climate Change In 1992 the UNFCCC was created as an environmental treaty aimed at reducing emissions of greenhouse gases to combat global warming. Signatories to the treaty were split into three categories: 1) Annex I (industrialized nations), 2) Annex II (developed countries which pay for costs of developing countries) and, 3) Developing countries. In 1997 the UNFCCC adopted the first legally binding protocol, named after the place of signing Kyoto Japan. The Kyoto protocol bound signatories to reducing their countries carbon emissions between 6-8% below 1990 levels. Although the U.S. signed the protocol, it was not sent to the U.S. Senate for ratification. The U.S. was concerned about the impact to the U.S. economy, method of funding developing countries, the fact that developing countries were not required to also reduce their carbon emissions, and that the U.S. could not use agricultural and forest ‘carbon sinks’ in its reduction program. In 2001, the UNFCCC found resolution to many of these negotiations and agreed to 1) Flexible mechanisms including carbon emissions trading, joint implementation of carbon offset projects and Clean Development Mechanisms (CDM) which allow industrialized nations to fund emission reduction activities in developing countries, 2) Agricultural and forest carbon sinks were allowed to country specific caps, 3) Compliance procedures and mechanisms with consequences to countries who do not meet emission limits, 4) Financing -3 new funds were created to provide assistance to climate change programs. The UNFCCC and the publicity and debate that the Kyoto protocol created inspired the world to look at new energy policies, energy efficient products and services, environmental and human-health impact of fossil fuels, damage to fragile ecosystems, sustainable packaging and product life-cycles, all of this wrapped up into a global movement concerned about “GLOBAL WARMING”. WARMING – 33 – ©2007 Environmental Impact Initiative
  • 34. EII –How do hydrocarbons affect our environment? CO2 emissions are expected to continue to rise unless we reduce the combustion of hydrocarbons or find a way to sequester CO2 Billions of metric tonnes Co2 27% 19% Source: International Energy Agency, world outlook 2006 – 34 – ©2007 Environmental Impact Initiative
  • 35. EII –How do hydrocarbons affect our environment? Long-term effects of global warming according to the Intergovernmental Panel on Climate Change second assessment: Increased global surface temperature causing the retreat of glaciers, melting of North Atlantic and Artic ice caps and the rise of sea level by 0.2 cm/year The slowing of the thermohaline –oceanic circulatory pump which regulates global sea temperatures and produces regular global weather patterns Increased severe weather patterns, droughts in some areas, floods in others, stronger and more frequent hurricanes Increased spread of disease and insects due to longer warming periods which allow the pests to survive longer, examples: dengue fever, malaria, west nile virus & mountain pine beetle Decreased permafrost increases biodegrading and methane release from typically frozen biomass such as peat bogs, which further aggravates global warming Acidification of the ocean as more CO2 is absorbed and changes the pH level of the water, effecting calcifying organisms such as: corals, mollusks, crustaceans, some of the lowest level species in our food chain Evaporation of wetlands and topical fresh water reserves –Florida everglades, and Africa’s lake chad are examples which will impact not only millions of people who depend on the water, fish, and vegetation growing from these reserves, but also the millions of animal species which depend upon these ecosystems Increased health risks including asthma and lung disease from ozone, and longer, more severe heat waves The Stern report on global warming released October 2006 estimated that global warming could cost as much as $9 trillion dollars through lost productivity, mass migration, insurance outlays, crop damage, land and property damage, healthcare costs and mortality – 35 – ©2007 Environmental Impact Initiative
  • 36. EII –How do hydrocarbons affect our environment? The Societal Cost of Hydrocarbons The burning of hydrocarbons has not only a high product cost for petroleum, natural gas, and coal, but also includes a very high societal cost. Societal costs can be more difficult to calculate than commodity costs and they vary from society to society. We will look at the societal cost of fossil fuels broken down into three main categories: environmental, military, and healthcare costs. *Thick gray layer of smog over Eastern China, NASA Terra Satellite images 2005 Beijing Jinan Shanghai – 36 – ©2007 Environmental Impact Initiative
  • 37. EII –How do hydrocarbons affect our environment? The use of hydrocarbons have not only an economic product cost, but also a very high societal cost to the entire population Environmental Costs: Air, Water & Soil pollution regulation & clean-up Beijing before & after rainfall Industrial waste pouring into the Yangtze river Soil erosion and run-off in Iowa U.S. Related Data: Regulation of air, water and soil pollution = $8.1 billion p.a. Oil pollution from motor vehicles causes $4.6 billion in damages to crops, forests, rivers, lakes, buildings and monuments p.a. Air, water and soil pollution from electrical generation (coal and natural gas fired boilers) costs between $14.8-90.3 billion each year 1 gallon of spilled oil can contaminate 1 million gallons of fresh water 1 MWh from a coal-fired generation plant releases 2,249 lbs. of CO2, 13 lbs. of sulfur dioxide, 6 lbs. of nitrogen oxides, and various levels of toxic mercury and arsenic, depending upon the purity of the coal – 37 – ©2007 Environmental Impact Initiative
  • 38. EII –How do hydrocarbons affect our environment? Societal Cost of Hydrocarbons Military Costs: Strategic U.S. military bases ($49bn), oil & gas supply route security ($20bn), strategic petroleum reserves ($30bn), War in Iraq has a financial cost of $275 million per day x 4 years= $401.5 billion dollars before any rebuilding or long-term health costs are applied Healthcare Costs: Lung disease & asthma treatments caused by pollution ($16.1bn), lead, mercury and arsenic poisoning from coal fired plants causes mental retardation, a host of learning disabilities, premature mortality, and has been linked to the growing number of autism cases in the U.S. ($88-640bn), 760,000 Chinese die prematurely each year from air & water pollution ($99bn) – 38 – ©2007 Environmental Impact Initiative
  • 39. EII –How do hydrocarbons affect our environment? So what are the societal costs of fossil fuels in the United States? Fossil Fuel Costs (billions USD) Low Mid High $49.00 $75.00 $100.00 Military Base & Supply Route Security $14.80 $53.00 $90.30 Environmental Monitoring & Clean-up $24.30 $237.00 $450.00 Healthcare treatment & mortality from pollution $88.10 $365.00 $640.30 Total Fossil Fuels Costs Using the Mid range of societal costs above divided by the total quantity of fossil fuel sourced consumed in 2006, we can calculate the financial impact to these fuel sources: 2006 Avg. Cost Add Mid Societal Cost Total Cost/Unit Consumer Increase $20.49 $93.83 $114.32 $0.0454 cents/kWh Coal (short ton) $60 $26.68 $86.68 $1.54 per gallon Crude Oil (barrel) $6.80 $2.74 $9.54 $0.0235 cents/kWh Natural Gas (mmcf) The Mid range societal costs increase: (this is generation cost ONLY, no distribution or retail costs included) Coal fired electrical generation costs go from $0.026 cents to $0.0714 cents per kWh Natural gas electrical generation costs go from $0.0615 cents to $0.0851 cents per kWh Regular gallon of unleaded gasoline goes from $3.46 to $5.01 dollars per gallon Sources: Intergovernmental Panel on Climate Change, Department of Resource Economics and Public Policy –University of Massachusetts, Ontario Ministry of Energy, National Defense Council Foundation, and the Institute for the Analysis of Global Security we will consider the following costs of fossil fuels (in billions of US dollars) – 39 – ©2007 Environmental Impact Initiative
  • 40. EII –How do hydrocarbons affect our environment? Importing 5 bbls of oil per year + economic loses + societal costs = $10 per gallon Defense Spending Oil Supply Disruptions $1 $1 39 34 Jobs Lost Overseas Taxes Lost Overseas $5 $0 43 19 Healthcare Costs Environmental Cost $1 $0 51 21 Total $1 07 0 Source: National Defense Council Foundation & Institute for the Analysis of Global Security – 40 – ©2007 Environmental Impact Initiative
  • 41. EII –How do hydrocarbons affect our environment? Societal costs are allocated to the price of gasoline in other countries through gas or carbon taxes, but U.S. has the lowest tax Automotive Gasoline -April 2007 $/Gal. No- Country Tax Tax Rate Taxes Total $/Gallon UK 2.21 205% 4.54 6.76 Germany 2.32 190% 4.41 6.74 Italy 2.51 157% 3.95 6.46 France 2.33 174% 4.05 6.38 Spain 2.47 111% 2.74 5.21 Japan 2.23 86% 1.91 4.14 Canada 2.46 42% 1.03 3.50 USA 2.41 14-16% 0.40 2.81 International Energy Agency –End-User Petroleum prices April 2007 – 41 – ©2007 Environmental Impact Initiative
  • 42. EII –How do hydrocarbons affect our environment? Section Review The burning of fossil fuels (hydrocarbons) is the major contributor to global pollution. Of primary concern to humans, plants and animals is the release of heavy metals such as mercury and radioactive isotopes like uranium, which are known carcinogens and mutagens. As of 2005 the U.S. set a mercury emission limit on generation facilities, but has yet to create a financial method (cap and trade, tax or penalty) to enforce or influence mercury reduction. Successful emissions limits (cap and trade system) have been set for nitrogen oxide (NOX) as well as sulfur dioxide (SO2) both of which are responsible for acid rain. Greenhouse gases from the combustion of hydrocarbons is believed to have adverse environmental effects such as: melting ice caps, extreme weather patterns, methane release from melting permafrost and the increased lifespan and spread of certain pests. The United Nations Framework Convention on Climate Change (UNFCCC) has organized an intergovernmental panel on climate change to scientifically and politically address the effects of global warming. The U.S. is the second largest carbon emitter in the world behind China. In the U.S., petroleum combustion results in 2.6 trillion lbs. of carbon dioxide equivalent greenhouse gases per year, representing 45% of our nation’s total. Coal emits 4.8 trillion lbs. or 35% and natural gas (methane) represents 19% or 2.6 trillion lbs. per year. According to the EIA 2007 outlook, U.S. greenhouse gas emissions increased 25% over the past 17 years since 1990 and are expected to continue to grow at a rate of 1.2% per year through 2030. Fossil fuels carry a high societal cost, including large military costs to secure and protect oil producing nations, healthcare costs associated premature mortality, lung disease and a host of mental conditions, and finally the cost of monitoring and cleaning up water, soil and air related pollution. In our base case analysis, U.S. societal costs amount to $365 billion dollars per year. Associating these societal costs to fossil fuels is one reason why we believe hydrocarbons will increase in fuel price in the future. In the next section we will explore several other reasons why we believe fossil fuels will remain at relatively high prices in the future. – 42 – ©2007 Environmental Impact Initiative
  • 43. EII –Why is the cost of fossil fuels increasing? Why is the cost of fossil fuels increasing? There are a number of reasons why we believe the cost for petroleum, coal and natural gas as our primary energy sources will continue to increase in the future: Global demand is increasing as we reviewed in the macroeconomics section Societal costs are being allocated to fossil fuels as we reviewed in the last section In the financial commodities market “energy” futures are linked by their btu value, thus as one commodity rises the others follow by their btu equivalent ratio Global supplies of conventional oil and natural gas are decreasing, thus these limited resources are depleting, we will look at peak oil and gas estimates The marginal cost (production and transporting) of supplying oil, gas and coal is increasing along with higher motor fuel and equipment costs Global oil production is at 95+% of capacity, any supply disruptions will result in outages and higher oil prices More countries are mandating carbon taxes or carbon caps, thus increasing the cost of operations which utilize fossil fuels and emit large quantities of carbon dioxide or other greenhouse gases – 43 – ©2007 Environmental Impact Initiative
  • 44. EII –Why is the cost of fossil fuels increasing? Historical prices of West Texas Intermediate crude oil *Note the historical price spikes from oil disruptions WTI Crude Oil Price West Texas Intermediate Historical Prices Linear (WTI Crude Oil Price) 90 2005 Hurricanes Katrina and Rita 80 disrupt gulf coast oil 1990 Iraq supply invasion of 70 Kuwait USD/Barrel (2007 CPI adj.) 60 Sept. 11, 2001 50 Terrorist Attack on U.S. 40 30 20 10 0 7 88 89 90 91 92 93 94 95 96 97 98 99 00 01 02 03 04 05 06 07 19 8 19 19 19 19 19 19 19 19 19 19 19 19 20 20 20 20 20 20 20 20 Source: Bloomberg USCRWTIC commodity prices 1987 -2007, CPI adjusted for inflation – 44 – ©2007 Environmental Impact Initiative
  • 45. EII –Why is the cost of fossil fuels increasing? Historical prices of Nymex –Henry Hub natural gas Natural gas has a btu value of 1,031,000 per mcf equal to 302 kWh/mcf. Whereas, oil has a btu value of 5,800,000 per barrel or 1700 kWh/brl. Natural gas historically traded at a ratio of 5.6:1 to crude oil. Any oil supply disruptions would also adversely effect natural gas. U.S. Natural Gas Prices Nymex/Henry Hub Natural Gas Prices Linear (Nymex/Henry Hub Natural Gas Prices) 16 2005 Hurricanes Katrina and Rita disrupt gulf coast NG USD per MMbtu (2007 CPI adj.) Winter 2000-2001 14 supply California energy crisis, pipeline 12 explosion & cold winter 10 8 6 4 2 0 90 91 92 93 94 95 96 97 98 99 00 01 02 03 04 05 06 07 19 19 19 19 19 19 19 19 19 19 20 20 20 20 20 20 20 20 Source: Bloomberg Nymex/Henry Hub commodity prices 1990 -2007, CPI adjusted for inflation – 45 – ©2007 Environmental Impact Initiative
  • 46. EII –Why is the cost of fossil fuels increasing? Historical prices of Central Appalachian Coal Although coal production and supply chain activities were not effected by either the California energy crisis or hurricanes Katrina and Rita, the energy relationship with oil and natural gas, increased the price of coal as seen below U.S. Central Appalachian Coal Prices U.S. CAPP Price Linear (U.S. CAPP Price) 80 2005 Hurricanes Katrina and Rita, disrupted energy market, 70 rising oil and gas prices led to USD per ton (2007 CPI adj.) higher coal prices 60 Winter 2000-2001 50 California energy crisis 40 30 20 10 0 1990 1991 1992 1993 1994 1995 1996 1997 1998 1999 2000 2001 2002 2003 2004 2005 2006 Source: Bloomberg CAPP Coal BUS index prices 1990 -2007, CPI adjusted for inflation – 46 – ©2007 Environmental Impact Initiative