Chapter2;THEORY OF DEMANDAND
SUPPLY
2.1 Definition and law of demand
Definition;
Demand refers to the desire and ability to consume
certain quantities at certain prices.
The law of demand ;
The law of demand states that there is inverse
relationship between quantity demand and price of the
commodity other factors being constant.
2.
Cont…
a higher priceinduces a reduction in quantity demanded
and a lower price induces an increase in quantity
demanded, ceteris paribus.
Ceteris paribus is a Latin word which means ‘’other things
being constant’’. The law of demand works if all other
factors that affect demand are held constant.
3.
Determinants of demand
1.price is the most important determinant of the quantity
demanded, It is expected as the price rises the quantity
demand falls and vice versa. there are also various
factors which determine it. These determinants are:-.
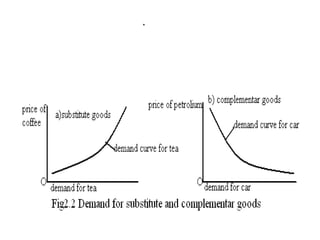
2. Price of substituted and complementary goods
The demand for a commodity depends also on the levels
of the price of its substitute and complementary good.
Substituted/related commodities are goods that are
consumed in place.
4.
Cont…
If Goodsare substitute for each other changes in the
price of one affects the demand for the other in the
same direction. Eg. Tea & coffee, Pepsi and coca, bread
and injera.
However, Complementary goods are goods that are
consumed together. For example gun &gun powder,
camera & film, petroleum & vehicle.
6.
Cont…
3. Consumer’s income
People with higher disposable income spend
larger amount on goods & services than those
with lower income.
But since consumer’s income-demand analysis
depends on the type of the good, we look this
income -demand analysis with related to
different categories of goods.
7.
Cont…
Inferior goods:-Are goodswhich are given low value /
class/ by the society .
The demand for such goods may initially increases with
the increase in income up to a certain limit. But it
decreases when income increases beyond that limit.
Normal goods:-Technically normal goods are those
goods which are demanded in increase quantities as
consumer’s income increases.
8.
Normal goods aredivided into luxuries and necessities.
i. Essential consumer goods / basic goods/:-Are goods
which are essentially consumed by almost all parts of the
society. E.g. food grains, cooking oil, sugar, salt etc .The
quantity demand of such goods increases with the increase
in consumer’s income only up to a certain limit.
once their basic needs are satisfied, further income
increases don’t lead to much higher consumption of such
goods. So, the marginal utility (extra satisfaction) from
consuming more of these goods decreases as income rises.
9.
ii. Prestige orluxury goods: -Are goods which are mostly
consumed by the rich section of society .E.g. designer
clothes, jewelry, high-end cars, luxury vacations. Demand
for such goods arises only beyond a certain level of
consumer’s income. Demand for luxury goods only
appears after income exceeds a certain threshold
once people have satisfied their basic needs and start
seeking products that provide pleasure, comfort, or
prestige.
A person with very low income won’t prioritize buying
a luxury car, but once income rises beyond basic needs,
they begin to demand such goods.
10.
Cont…
4. Consumer’s futureincome
Consumer’s future income has positive relationship with
demand. That means if the consumer expects future
income, he consumes more today and vice versa.
5. Consumer’s expected price
It has also positive relationship with demand. That is if
consumer expected price of goods increases in the
future, his today’s demand for that good increases &
vice versa.
11.
Cont…
6. Consumers preferences
It also plays an important role in determining the
demand for a product.
consumer can change his or her preference for
many different reasons.
For example change in moral perception or
fashion, advertising , observing other consumers
and so on.
12.
Cont…
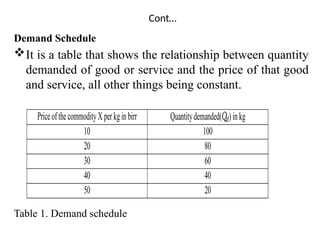
Demand Schedule
It isa table that shows the relationship between quantity
demanded of good or service and the price of that good
and service, all other things being constant.
Table 1. Demand schedule
PriceofthecommodityXperkginbirr Quantitydemanded(𝑄𝑑)inkg
10 100
20 80
30 60
40 40
50 20
13.
Cont…
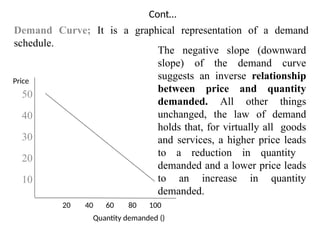
Demand Curve; Itis a graphical representation of a demand
schedule.
50
40
30
20
10
20 40 60 80 100
Quantity demanded ()
Price
The negative slope (downward
slope) of the demand curve
suggests an inverse relationship
between price and quantity
demanded. All other things
unchanged, the law of demand
holds that, for virtually all goods
and services, a higher price leads
to a reduction in quantity
demanded and a lower price leads
to an increase in quantity
demanded.
14.
Cont…
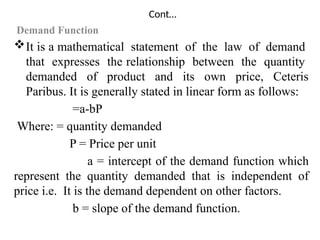
Demand Function
It isa mathematical statement of the law of demand
that expresses the relationship between the quantity
demanded of product and its own price, Ceteris
Paribus. It is generally stated in linear form as follows:
=a-bP
Where: = quantity demanded
P = Price per unit
a = intercept of the demand function which
represent the quantity demanded that is independent of
price i.e. It is the demand dependent on other factors.
b = slope of the demand function.
15.
Cont…
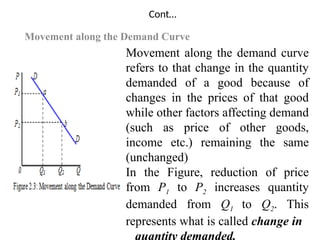
Movement along theDemand Curve
Movement along the demand curve
refers to that change in the quantity
demanded of a good because of
changes in the prices of that good
while other factors affecting demand
(such as price of other goods,
income etc.) remaining the same
(unchanged)
In the Figure, reduction of price
from P1 to P2 increases quantity
demanded from Q1 to Q2. This
represents what is called change in
quantity demanded.
16.
Cont…
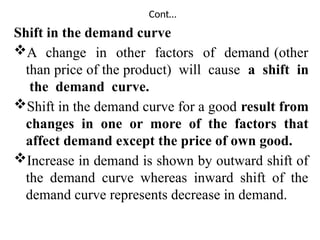
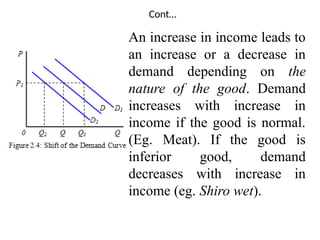
Shift in thedemand curve
A change in other factors of demand (other
than price of the product) will cause a shift in
the demand curve.
Shift in the demand curve for a good result from
changes in one or more of the factors that
affect demand except the price of own good.
Increase in demand is shown by outward shift of
the demand curve whereas inward shift of the
demand curve represents decrease in demand.
17.
Cont…
An increase inincome leads to
an increase or a decrease in
demand depending on the
nature of the good. Demand
increases with increase in
income if the good is normal.
(Eg. Meat). If the good is
inferior good, demand
decreases with increase in
income (eg. Shiro wet).
18.
2.2 Definition, lawand determinants of supply
Definition: Supply refers to the quantities that producers
are willing and able to supply at alternative prices, ceteris
paribus.
The Law of Supply: states that the quantity supplied of a
good or service is a positive function of price, ceteris
paribus.
Determinants of supply
1. Price of the product (P): That the higher the price
in the market the more the produce is usually to
produce for sale other factors remaining constant.
19.
2. Prices ofFactors of Production:
This change in the cost of production will change the
quantity that suppliers are willing to offer at any price.
An increase in factor prices should decrease the quantity
suppliers will offer at any price. A reduction in factor
prices increases the quantity suppliers will offer at any
price.
3. Producers’ Expectations
If the sellers expect that future price will rise, there will
be holding of goods to sell it later when the price is
higher. Thus, there will be a decrease in supply. The
reverse is also true.
20.
Cont…
4. Price ofother goods the firm can produce
To produce one good or service means forgoing
the production of another. If a large commercial
farm produces both teff and wheat.
If the price of teff rises in the market, it is likely
to shift all resources (land, labor and machines)
to the production of teff and less wheat will be
produced.
Consequently, the supply of wheat will decrease
even if its price is unchanged.
21.
Cont…
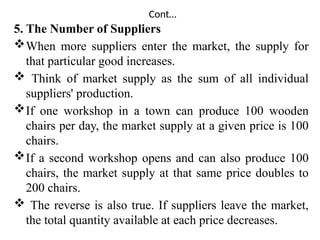
5. The Numberof Suppliers
When more suppliers enter the market, the supply for
that particular good increases.
Think of market supply as the sum of all individual
suppliers' production.
If one workshop in a town can produce 100 wooden
chairs per day, the market supply at a given price is 100
chairs.
If a second workshop opens and can also produce 100
chairs, the market supply at that same price doubles to
200 chairs.
The reverse is also true. If suppliers leave the market,
the total quantity available at each price decreases.
22.
Cont…
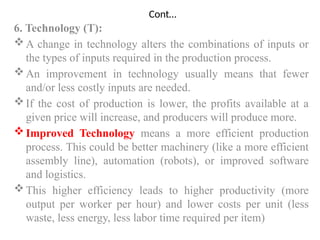
6. Technology (T):
Achange in technology alters the combinations of inputs or
the types of inputs required in the production process.
An improvement in technology usually means that fewer
and/or less costly inputs are needed.
If the cost of production is lower, the profits available at a
given price will increase, and producers will produce more.
Improved Technology means a more efficient production
process. This could be better machinery (like a more efficient
assembly line), automation (robots), or improved software
and logistics.
This higher efficiency leads to higher productivity (more
output per worker per hour) and lower costs per unit (less
waste, less energy, less labor time required per item)
23.
Cont…
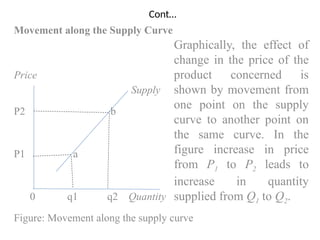
Movement along theSupply Curve
Price
Supply
P2 b
P1 a
0 q1 q2 Quantity
Figure: Movement along the supply curve
Graphically, the effect of
change in the price of the
product concerned is
shown by movement from
one point on the supply
curve to another point on
the same curve. In the
figure increase in price
from P1 to P2 leads to
increase in quantity
supplied from Q1 to Q2.
24.
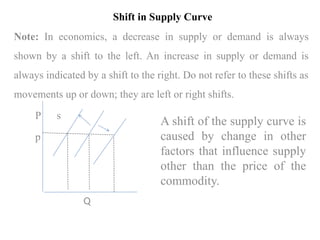
Shift in SupplyCurve
Note: In economics, a decrease in supply or demand is always
shown by a shift to the left. An increase in supply or demand is
always indicated by a shift to the right. Do not refer to these shifts as
movements up or down; they are left or right shifts.
P s
p
Q
A shift of the supply curve is
caused by change in other
factors that influence supply
other than the price of the
commodity.
25.
2.3 Market Equilibrium
“Equilibrium”is perceived as the condition where the
quantity demanded is equal to the quantity supplied.
Once equilibrium is reached at the point of equality of
the demand curve with the supply curve, it remains there
as long as demand and supply remain unchanged.
26.
Cont…
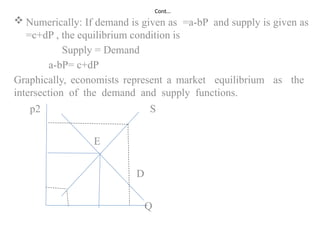
Numerically: Ifdemand is given as =a-bP and supply is given as
=c+dP , the equilibrium condition is
Supply = Demand
a-bP= c+dP
Graphically, economists represent a market equilibrium as the
intersection of the demand and supply functions.
p2 S
E
D
Q
27.
Cont…
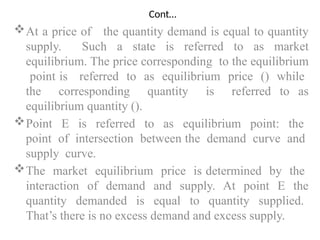
At a priceof the quantity demand is equal to quantity
supply. Such a state is referred to as market
equilibrium. The price corresponding to the equilibrium
point is referred to as equilibrium price () while
the corresponding quantity is referred to as
equilibrium quantity ().
Point E is referred to as equilibrium point: the
point of intersection between the demand curve and
supply curve.
The market equilibrium price is determined by the
interaction of demand and supply. At point E the
quantity demanded is equal to quantity supplied.
That’s there is no excess demand and excess supply.
28.
Cont…
E.g. supposethe market demand curve for maize is
given by the equation Qd= 500- 4P, while the market
supply curve for maize is described by the equation Qs
= -100 + 2P. At what price and quantity is the market
for maize in equilibrium?
Solution: At equilibrium, the quantity supplied equals
the quantity demanded, and we can use this relationship
to solve for P.
Qd = Qs; 500-4P= -100+2P
600=6P
P=100 br.
29.
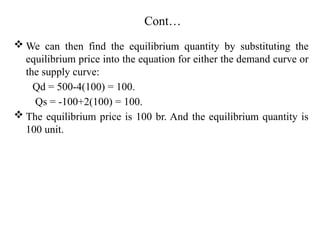
Cont…
We canthen find the equilibrium quantity by substituting the
equilibrium price into the equation for either the demand curve or
the supply curve:
Qd = 500-4(100) = 100.
Qs = -100+2(100) = 100.
The equilibrium price is 100 br. And the equilibrium quantity is
100 unit.
30.
2.5 Elasticity’s ofDemand and Supply of agricultural
commodities and their determinants
The law of demand and supply states only the nature of
relationship between the change in the price of a
commodity and the quantity demanded and supplied
respectively the law does not quantity the relationship.
The quantitative relationship is measured by the
elasticity of demand and elasticity of supply.
Definition: Elasticity is a measure of the sensitivity or
responsiveness of quantity demanded or quantity
supplied to changes in price.
31.
Cont…
Elasticity of demand
Inexamining demand, it would be interesting to
measure how quantity demanded responds to
changes in price .
Price elasticity of demand measures the
responsiveness of quantity demanded to changes
in output price, ceteris paribus.
The price elasticity of demand () is defined to
be the percentage change in quantity demanded
divided by the percentage change in price.
32.
Cont…
where Qis change in quantity and P is change in
price.
Rearranging,
The sign of the elasticity of demand is generally
negative, since demand curves invariably have a
negative slope. In elasticity, we consider the absolute
value of the coefficients.
Q
P
P
Q
33.
Cont…
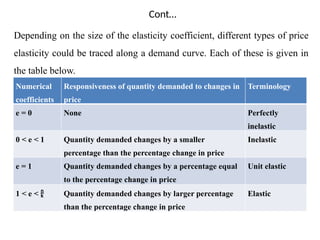
Depending on thesize of the elasticity coefficient, different types of price
elasticity could be traced along a demand curve. Each of these is given in
the table below.
Table 2.: Elasticity Coefficients
Numerical
coefficients
Responsiveness of quantity demanded to changes in
price
Terminology
e = 0 None Perfectly
inelastic
0 < e < 1 Quantity demanded changes by a smaller
percentage than the percentage change in price
Inelastic
e = 1 Quantity demanded changes by a percentage equal
to the percentage change in price
Unit elastic
1 < e < Quantity demanded changes by larger percentage
than the percentage change in price
Elastic
34.
Cont…
e.g. 1, supposethat when the price of a good is
10br , the quantity demanded is 50 units and that
when the price increases to 12br , the quantity
demanded decreases to 45 units. Then the price
elasticity of demand is;
= * = * = * = -0.5; which implies that the DD is
inelastic since |EP | < 1.
This suggests that a 1% increase in price will
reduce the quantity demanded by 0.5%.
35.
Cont…
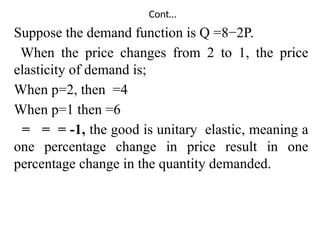
Suppose the demandfunction is Q =8−2P.
When the price changes from 2 to 1, the price
elasticity of demand is;
When p=2, then =4
When p=1 then =6
= = = -1, the good is unitary elastic, meaning a
one percentage change in price result in one
percentage change in the quantity demanded.
36.
Cont…
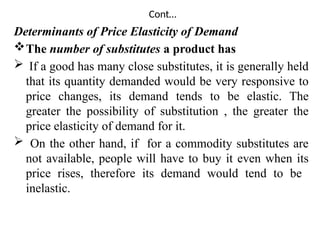
Determinants of PriceElasticity of Demand
The number of substitutes a product has
If a good has many close substitutes, it is generally held
that its quantity demanded would be very responsive to
price changes, its demand tends to be elastic. The
greater the possibility of substitution , the greater the
price elasticity of demand for it.
On the other hand, if for a commodity substitutes are
not available, people will have to buy it even when its
price rises, therefore its demand would tend to be
inelastic.
37.
Cont…
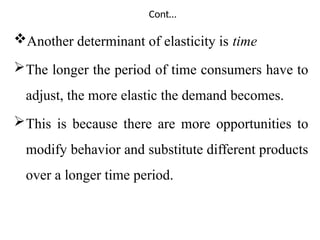
Another determinant ofelasticity is time
The longer the period of time consumers have to
adjust, the more elastic the demand becomes.
This is because there are more opportunities to
modify behavior and substitute different products
over a longer time period.
38.
Cont…
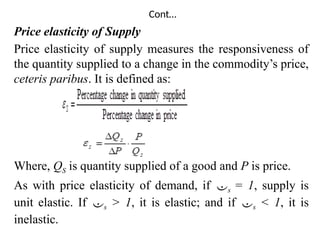
Price elasticity ofSupply
Price elasticity of supply measures the responsiveness of
the quantity supplied to a change in the commodity’s price,
ceteris paribus. It is defined as:
Where, QS is quantity supplied of a good and P is price.
As with price elasticity of demand, if s = 1, supply is
unit elastic. If s > 1, it is elastic; and if s < 1, it is
inelastic.
39.
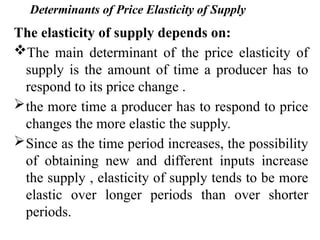
Determinants of PriceElasticity of Supply
The elasticity of supply depends on:
The main determinant of the price elasticity of
supply is the amount of time a producer has to
respond to its price change .
the more time a producer has to respond to price
changes the more elastic the supply.
Since as the time period increases, the possibility
of obtaining new and different inputs increase
the supply , elasticity of supply tends to be more
elastic over longer periods than over shorter
periods.
40.
Cont…
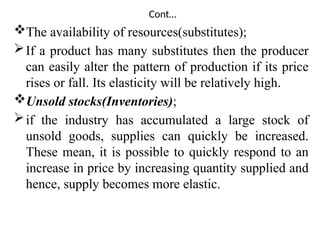
The availability ofresources(substitutes);
If a product has many substitutes then the producer
can easily alter the pattern of production if its price
rises or fall. Its elasticity will be relatively high.
Unsold stocks(Inventories);
if the industry has accumulated a large stock of
unsold goods, supplies can quickly be increased.
These mean, it is possible to quickly respond to an
increase in price by increasing quantity supplied and
hence, supply becomes more elastic.
41.
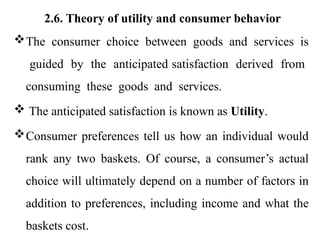
2.6. Theory ofutility and consumer behavior
The consumer choice between goods and services is
guided by the anticipated satisfaction derived from
consuming these goods and services.
The anticipated satisfaction is known as Utility.
Consumer preferences tell us how an individual would
rank any two baskets. Of course, a consumer’s actual
choice will ultimately depend on a number of factors in
addition to preferences, including income and what the
baskets cost.
42.
Cont…
consumer behavior ismeant how consumers decide on
the basket of goods and services they consume. It is
essentially decision-making behavior. We shall see this
consumer behavior analysis using cardinal and ordinal
utility analysis.
The cardinal utility approach
Utility is assumed to be measured quantitatively in
units called Utils.
With a cardinal measurement, we not only know the
preference of the consumers of basket A to basket D, but
We can make a quantitative statement.
43.
Cont…
The cardinal approachis based on the following
assumptions:
1.The consumer is rational - this means that the
consumer’s objective to maximize utility subject to a
given level income.
2. Utility is cardinal - this means that utility is
measurable quantitatively.
3. Marginal utility depends on the quantity of a
commodity consumed – that the more the units are
consumed the more the total utility.
4. Diminishing marginal utility- the additional utility
derived from consuming an extra unit of product gets
smaller and smaller.
44.
Cont…
Total Utility (TU)
It refers to the total amount of satisfaction a consumer
gets from consuming or possessing some specific
quantities of a commodity at a particular time.
As the consumer consumes more of a good per time
period, his/her total utility increases.
However, there is a saturation point for that commodity
in which the consumer will not be capable of enjoying
any greater satisfaction from it.
45.
Cont…
Marginal Utility (MU)
It refers to the additional (extra) utility obtained from
consuming an additional unit of a commodity.
In other words, marginal utility is the change in total
utility resulting from the consumption of one more unit
of a product per unit of time. Mathematically, the
formula for marginal utility is:
Where: TU is the change in Total Utility, and Q is
change in the amount of product consumed.
46.
Cont…
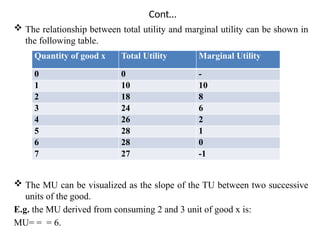
The relationshipbetween total utility and marginal utility can be shown in
the following table.
The MU can be visualized as the slope of the TU between two successive
units of the good.
E.g. the MU derived from consuming 2 and 3 unit of good x is:
MU= = = 6.
Quantity of good x Total Utility Marginal Utility
0 0 -
1 10 10
2 18 8
3 24 6
4 26 2
5 28 1
6 28 0
7 27 -1
47.
Cont…
The Law ofDiminishing Marginal Utility
It is believed that as a person consumes more and
more of a (homogeneous) good in a given period of
time, that eventually the total utility (TU) derived from
that good will increase at a decreasing rate: the point of
diminishing marginal utility (MU) will be reached.
In other words, as a consumer takes more units of
goods, the extra satisfaction that he drives from an extra
unit of the good goes on failing.
48.
Cont…
Ordinalist Approach
In thestudy of cardinal utility analysis we have assumed
that utility is measurable. This approach suffers from a
number of weaknesses; the most important weakness of
this old approach was related to its cardinal
measurement of utility.
To overcome this difficulty the modern economists have
developed an alternative approach based on in
difference curve analysis.
The indifference curve analysis does not deny the
existence of utility but makes use of it in different way.
It states that utility is measurable only in principle but
its magnitude cannot be assigned in real number.
49.
Cont…
In general theconcept of ordinal utility is based on the
following assumptions.
1) It may not be possible for consumer to express his
utility in quantative terms. But it is always possible for
him to tell which of any two goods he prefers.
2) In view of assumption 2, the consumer can order all the
commodities he consumes in the order of their preference.
The consumer level of satisfaction is represented by
an Indifference curve.
50.
Cont…
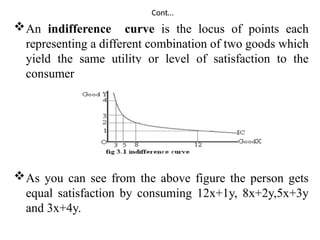
An indifference curveis the locus of points each
representing a different combination of two goods which
yield the same utility or level of satisfaction to the
consumer .
As you can see from the above figure the person gets
equal satisfaction by consuming 12x+1y, 8x+2y,5x+3y
and 3x+4y.


![谷歌留痕技术 [ 𝙩𝙤𝙥 𝟮𝟯𝟯. 𝙘 𝙤𝙢 ]](https://cdn.slidesharecdn.com/ss_thumbnails/top233-260130174328-3833018c-thumbnail.jpg?width=640&height=640&fit=bounds)


