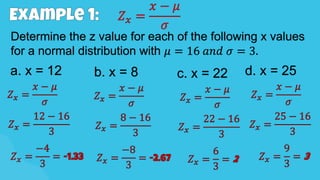
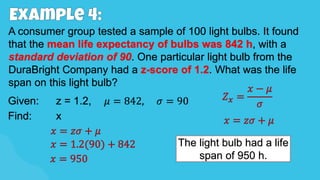
The document contains examples of calculating z-scores from given means and standard deviations for normal distributions. It provides the z-scores that correspond to specific raw scores in several examples, and calculates areas under the normal curve for given ranges of z-scores or raw scores. It also calculates the percentage of students that would score below or between certain values based on the mean and standard deviation of their test scores.


![NORMAL DISTRIBUTION FIN [Autosaved].pptx](https://cdn.slidesharecdn.com/ss_thumbnails/normaldistributionfinautosaved-250706062357-4c5756a9-thumbnail.jpg?width=640&height=640&fit=bounds)