This document discusses leverage points for reducing air pollutant emissions from road transport. It examines vehicle and fuel characteristics like fuel type and efficiency, emission controls, and vehicle age. It also looks at factors related to vehicle ownership and use, including location of travel, time of day, speed of travel, and vehicle load. Reducing emissions requires improvements in fuels, vehicle technology, traffic management, and urban planning to encourage more efficient modes of transport.
The document discusses progressing towards fair and efficient transport pricing in the European Union. It outlines several upcoming Commission proposals and studies that aim to better internalize external costs, especially for road transport. These initiatives include revising legislation around road tolls and vehicle taxes to further cost internalization policies. The Commission intends to carefully consider introducing elements of efficient pricing strategies in these proposals, while balancing internal market functions and complementary measures.
This document discusses electronic fee collection (EFC) systems for transport payment. It outlines existing single-lane toll systems in Europe and challenges with multi-lane tolling at high speeds. Three main EFC technologies are described: microwave, infrared, and GSM/GPS. Exception handling and vehicle classification are difficult technical problems. Transaction processing bandwidth limitations could be addressed by expanding the available spectrum. Legal and institutional challenges also exist for introducing tolling on previously untolled roads. Ensuring interoperability of EFC systems across borders is a key priority.
This document discusses the potential for introducing a kilometre tax on vehicles based on electronic odometers or tachographs to more accurately charge for road use compared to existing fuel tax systems. It notes that if costs of electronic systems decrease, applying such taxes to private vehicles could also be considered. The technical devices used for kilometre taxes may evolve over time and could eventually coincide with future electronic road pricing systems. The document also discusses modulating existing charges in other modes like rail and aviation based on environmental impacts.
A triumph of failed ideas: European models of capitalism in the crisisLeft Streamed
Europe has adopted German-style labor market and economic policies in response to the crisis, focusing on wage moderation, increased flexibility, and weakened collective bargaining. However, these "structural reforms" have failed to boost growth and have spread unemployment, with the German model itself now showing cracks as domestic demand and wages drop. Promoting the German approach risks damaging European social models and failing to address the real problems fueling the crisis.
The document discusses why transport externalities matter and how they can be reduced. It makes three key points:
1) When market prices do not reflect all costs to society, individual transportation decisions do not maximize benefits to society as a whole. Pricing that internalizes external costs is needed for an efficient system.
2) Transport externalities impair efficient resource allocation. For example, if pollution costs are not charged, demand will be "too high" for polluting vehicles and "too low" for cleaner ones.
3) Government measures are needed to internalize external costs by ensuring transportation users pay full social costs. This provides incentives to reduce problems and leads to more desirable societal outcomes compared to unpr
This document discusses using different fiscal instruments to reduce NOx emissions from cars in a cost-effective manner. It finds that incentives targeting multiple factors are more cost-effective than those targeting just a few factors. Increasing fuel taxes is an ineffective way to reduce NOx emissions. Increasing existing circulation taxes induces people to scrap old, polluting cars. Basing circulation taxes on emission factors produces larger NOx reductions at lower costs by encouraging cleaner vehicle technology. A circulation tax accounting for both emissions and mileage provides more choices and achieves further NOx reductions at the same cost. Taxing actual emissions could optimize reductions but is difficult to implement.
This document contains two annexes related to estimating external costs of transport. Annex 10 provides data on the external costs of different modes of transport in the EU-15 in 1991. It estimates costs from accidents, noise, and air pollution/climate change. The total external costs were estimated at 209 billion ECU for passenger transport and 63 billion ECU for freight. Annex 11 lists studies that the European Commission plans to launch to further analyze issues related to internalizing external transport costs. This includes studies on pricing policies, infrastructure costs, and the economic impacts of transport sector activities.
The document discusses the effectiveness of using prices to influence transportation behavior. It finds that price elasticities, which measure the responsiveness of demand to price changes, are generally higher than previously believed. For example, a 10% increase in fuel prices can reduce traffic by 3% in the long run. Road pricing and tax differentiation between fuels and vehicles can significantly impact choices and markets shares through relatively small price adjustments.
This document summarizes evidence on external costs of transport and proposes principles for policies to internalize these external costs. It finds that road transport accounts for over 90% of total external costs and costs per vehicle km are much higher for road than rail or shipping. Urban traffic has very high external costs. The document recommends transitioning towards transport pricing systems that reflect full social costs through gradually implementing charges linked to externalities over time.
The document describes Andy Technology's design for new low greenhouse gas emitting technologies for sustainable transportation and power plants. It claims that Andy Technology's designs can double speed while using 1/3 the fuel, leading to 600% greater fuel efficiency and reductions in CO2 emissions of 33-66% compared to standard transport and power generation. Details are provided on potential fuel savings and emissions reductions from applying Andy Technology's designs to vehicles, ships, ferries, and power plants.
1) The document discusses a scenario model called "4see" that examines how the UK could reduce its dependency on oil by 2030 through proactive steps in the transport sector.
2) The scenario aims to be socially and technically feasible, economically affordable, and politically acceptable while using official statistics and reputable data sources.
3) The model focuses on cars and trucks, examining stock and flow data on vehicle numbers, fuel consumption, and distance traveled to project trends and impacts of policy changes on oil use through 2030.
This document discusses the calculation of pavement thickness. It provides traffic load plans, soil bearing capacity data from CBR tests, and calculations to determine the equivalent single axle loads and traffic over the design life. Based on the soil CBR values and traffic loads, curves are generated to determine the 90% CBR values for different segments. Using these 90% CBR values, the soil bearing capacity is calculated. Finally, the document outlines the steps to determine the required pavement thickness based on the soil bearing capacity and traffic parameters.
This document summarizes an economic study on strengthening disaster risk management and rural resilience in Cambodia. It includes:
- Traffic studies that were conducted on rural roads from July to December 2016 to estimate annual average daily traffic volumes. Data is presented on traffic counts, passenger car units, and traffic volumes for 32 rural roads.
- An explanation of the economic evaluation approach, which calculates the net benefits of "with project" and "without project" scenarios by considering avoided losses and development co-benefits from disaster risk reduction.
- Details on how costs such as road reconstruction, maintenance, and vehicle operating costs are estimated, as well as potential benefits like reduced travel time and healthcare expenditures. The analysis will estimate metrics like
16.00 Updates to CURED and CREAM Emissions Models.pdfIES / IAQM
- The document describes updates made to the CURED and CREAM emissions models, which predict emissions of NOx, PM, and NH3 from road vehicles.
- For CURED, the updates include incorporating projections of electric vehicle uptake from the Transport Analysis Guidance, and a new approach for calculating non-exhaust PM emissions. Comparisons show CURED estimates of NOx and PM emissions are slightly lower than the Emissions Factors Toolkit.
- For CREAM, updates include incorporating the same electric vehicle projections as CURED and updated ammonia emission factors. Comparisons show higher estimated ammonia emissions than the previous version, especially with inclusion of cold starts.
Quantifying the impact of micro vehicles on trips, vehicle miles traveled (VMT) and the present value of transportation. Presentation at the second Micromobility Summit, Techfestival, Copenhagen, September 5, 2018.
Piloting the global protocol for community scale greenhouse gas emissions in ...icarb
This document summarizes greenhouse gas emissions data for Lochaber, Scotland from various sectors including stationary fuels, electricity, transportation, waste, industrial processes, livestock, and Rio Tinto Alcan and Aggregate Industries. It provides greenhouse gas emissions in tonnes of CO2 equivalent for each sector and subsector, along with the data sources used which include UK government agencies, local councils, utilities and surveys. The total emissions for Lochaber are estimated to be 348,649 tonnes of CO2 equivalent.
Strong international traffic in February 2010 drove overall global traffic growth of 6.8%. International traffic rose 9% while domestic traffic increased 4.8%. Growth was seen across all regions despite harsh winter weather negatively impacting some areas. International freight also saw exceptional growth over 30% reflecting pent-up demand from the economic recovery. The results show continued signs of recovery in global air traffic.
This document summarizes an article from the International Journal of Mechanical Engineering and Technology that implements graphical-analytical and software methods to determine vehicle speeds in three road accident cases. Technical details of the vehicles involved and road conditions are provided. For each accident, the graphical-analytical method is used to calculate vehicle speeds before collision based on momentum conservation. Results are compared to those from PC Crash software simulations. Speeds from the two methods show small deviations. The summary concludes that the graphical-analytical method provides quite accurate speed estimates, especially when data is limited, making it advantageous for accident analysis.
The document provides instructions for assembling and disassembling components of the power train on a D6N track-type tractor, including:
- Assembling the final drive by installing bearings, seals, and other components into hubs and carriers in a specific order and using various tools.
- Removing and installing the left final drive, steering differential, and brake by removing bolts and other fasteners, then lifting out the assembly using lifting brackets and forcing screws.
- Disassembling the steering differential and brake by removing bolts and washers, then using link brackets, spring pins, and other tools to separate individual components.
The document provides instructions for assembling and disassembling components of the power train on a D6N track-type tractor, including:
- Assembling the final drive by installing bearings, seals, and other components into hubs and carriers in a specific order and using various tools.
- Removing and installing the left final drive, steering differential, and brake by removing bolts and lifting out the assembly using lifting brackets and forcing screws.
- Disassembling the steering differential and brake by removing bolts and washers, leveraging link brackets and other tools.
The document provides instructions for assembling and disassembling components of the final drive, steering differential, and brake for a D6N track-type tractor. It describes in detail the steps to assemble the final drive components, such as installing bearings and seals. It also outlines the procedure to disassemble components of the steering differential and brake, including removing bolts, gears, and shafts. Tools required are listed for both assembly and disassembly.
This document provides traffic data for AEA (Association of European Airlines) member airlines for June 2010. Key points include:
- Total passenger traffic was 31.2 million, a 3.2% increase from the previous year. Freight traffic was 2.9 million tons, an 11.7% increase.
- For international short and medium haul flights, passenger traffic was 16.9 million, a 3.9% increase, while freight traffic was 206 million tons, a 1.2% decrease.
- The top airlines by passengers were Air France, British Airways, and Iberia. Cargolux led in freight traffic with 415,000 tons carried.
This document provides instructions for assembling and disassembling a torque converter. It outlines 51 steps for assembling the various components in the proper order, including installing bearings, seals, springs, and fasteners. It also describes removing the transmission and separating it from the bevel gears, noting the weight of the components. The document is an service repair manual for a track-type tractor power train.
The document provides instructions for separating a transmission and bevel gears from a track-type tractor. The procedure involves disconnecting harness assemblies, installing lifting tools to the transmission housing and gears, and using a lifting device to remove the assembly from the tractor by removing mounting bolts. Safety precautions are noted and multiple illustrations are provided to support the step-by-step instructions.
This document discusses methods for assigning a monetary value to the external costs of transport in order to implement policies aimed at internalizing these costs. It describes several valuation methods and their advantages and disadvantages, including the damage function approach, avoidance costs approach, hedonic pricing approaches, and contingent valuation/stated preferences approach. It notes that contingent valuation tends to provide the highest monetary values since it aims to measure people's total willingness to pay and includes non-market impacts, though it is also the most expensive to conduct.
The document discusses transport pricing in Brussels. It finds that:
1) Without policy changes, peak travel speeds would drop from 38 km/hr to 23 km/hr by 2005 due to increased traffic.
2) Implementing efficient pricing that accounts for external costs could reduce peak car traffic by 21.8% and increase public transit use by 19.5%, cutting air pollution by 50% and providing annual benefits of 150 million ECU.
3) Pricing options could include road pricing and emission fees, or more conventional approaches like fuel taxes, which still provide sizable benefits compared to taking no action.
This document discusses market-based incentives that Sweden has implemented to reduce air pollution from transport, including:
- Differentiated fuel taxes based on environmental characteristics to promote cleaner fuels.
- Differential vehicle taxes based on emission classes to stimulate sales of lower-emitting vehicles.
- An environmental tax on domestic airline emissions to induce changes to more efficient engines.
- A car scrapping charge and premium to increase the ratio of scrapped cars to new cars sold.
The measures have generally been effective in promoting cleaner fuels and vehicles in Sweden.
The document discusses the current policy approach to reducing transport-related air pollution in the EU, which has largely followed a regulatory approach through product standards and rules to meet air quality standards. It notes that while effective, this approach has limitations given the significant variations in causes and effects of air pollution across different regions and cities in Europe. Economic instruments could provide more flexibility to address this differentiation. Specifically, the document examines alternatives like adjusting taxes on fuels and vehicles to better reflect their environmental performance to further internalize the costs of air pollution.
The document discusses the costs of air pollution from transport in the European Union. It finds that:
1) Transport accounts for a major share (around 30-69%) of key air pollutants in most EU countries. Road transport is the largest contributor to transport emissions.
2) While regulations have reduced per-vehicle emissions by 90% since 1970, total emissions of some pollutants continue to rise due to increased traffic.
3) The external costs of air pollution from transport are estimated at around 0.4% of GDP across EU countries, though this figure may underestimate health costs. Local air pollution imposes health and economic damages.
The document discusses potential economic instruments to better align transportation charges with costs related to heavy goods vehicles (HGVs) in the EU. It suggests revising taxes and permits for HGVs outlined in the Eurovignette directive to allow more differentiation based on infrastructure costs and vehicle characteristics. It also proposes investigating an electronic kilometer charge for HGVs that could vary based on axle weight, vehicle type, time, and location to more closely link charges with road damage costs. The Commission intends to study possibilities and advantages of transitioning to an electronic kilometer charge system for HGVs.
The document discusses how infrastructure and congestion costs are currently charged for in the EU. It notes that no country explicitly charges for congestion, though some toll systems vary rates by peak periods. Infrastructure costs are recovered through annual vehicle taxes and fuel duties. There are significant differences between member states in these rates. The document argues for developing telematics-based pricing systems to allow charges to be differentiated based on costs which vary by vehicle, time, and location. This would better link charges to costs. In the short-term, it recommends aligning road haulage charges across member states and improving how the current system accommodates cost differentiation.
The document discusses congestion costs from traffic in Europe. It notes that congestion has doubled in the Netherlands over the past decade and costs 0.7 billion ECU annually, or 0.25% of GDP. Congestion is concentrated in urban areas during peak hours. An efficient solution would be to introduce differentiated congestion charges that vary by time and location to reflect the full social costs of transportation. This would provide incentives to reduce unnecessary trips and maximize infrastructure usage, while also generating revenues to invest in expanding capacity.
This document discusses infrastructure costs and congestion in transportation. It makes three key points:
1) Infrastructure and congestion costs are increasing significantly in the EU. Current transportation charges often do not reflect the true costs of infrastructure provision or congestion.
2) Ideal transportation cost charges would link fees to marginal costs, recover total infrastructure costs, and be transparent. Marginal cost pricing incentives reduce costs, while full cost recovery prevents subsidies.
3) Congestion arises when infrastructure exceeds capacity, wasting time for all users. Individuals only consider their own time losses, not those imposed on others, leading to overuse of infrastructure. Congestion charges can correct this market failure.
The document discusses the need for policy action to address transport externalities. It notes that while transport provides many benefits, it also imposes significant costs through congestion, accidents, air pollution, and noise. These external costs are estimated to be up to 5% of GDP across EU countries. The document argues that transport policy needs to be rebalanced to better account for these externalities, through the use of pricing mechanisms and other measures. This will help ensure transport users pay the real costs of their activities.
This document discusses transport externalities such as congestion, accidents, and air pollution costs and proposes pricing policies to better align prices with real transport costs. It notes that these externalities currently cost the EU around 250 billion euros annually, with over 90% related to road transport. The document explores using price signals through measures like road tolls and differentiated taxes to reduce negative impacts while making the transport system more efficient and fair. It argues for a community-wide discussion to ensure consistency across policies set at national and EU levels.
This document discusses options for incorporating external costs of transport into pricing in the European Union. It explores ways to make transport pricing more efficient and fair by internalizing costs related to infrastructure use, congestion, accidents, air pollution, and noise. The goal is to launch a broad discussion on using market-based instruments and regulations to reduce transport problems and reflect the full costs of transport activities on society and the environment.
Industrial Tech SW: Category Renewal and CreationChristian Dahlen
Every industrial revolution has created a new set of categories and a new set of players.
Multiple new technologies have emerged, but Samsara and C3.ai are only two companies which have gone public so far.
Manufacturing startups constitute the largest pipeline share of unicorns and IPO candidates in the SF Bay Area, and software startups dominate in Germany.
Easily Verify Compliance and Security with Binance KYCAny kyc Account
Use our simple KYC verification guide to make sure your Binance account is safe and compliant. Discover the fundamentals, appreciate the significance of KYC, and trade on one of the biggest cryptocurrency exchanges with confidence.
Starting a business is like embarking on an unpredictable adventure. It’s a journey filled with highs and lows, victories and defeats. But what if I told you that those setbacks and failures could be the very stepping stones that lead you to fortune? Let’s explore how resilience, adaptability, and strategic thinking can transform adversity into opportunity.
[To download this presentation, visit:
https://www.oeconsulting.com.sg/training-presentations]
This PowerPoint compilation offers a comprehensive overview of 20 leading innovation management frameworks and methodologies, selected for their broad applicability across various industries and organizational contexts. These frameworks are valuable resources for a wide range of users, including business professionals, educators, and consultants.
Each framework is presented with visually engaging diagrams and templates, ensuring the content is both informative and appealing. While this compilation is thorough, please note that the slides are intended as supplementary resources and may not be sufficient for standalone instructional purposes.
This compilation is ideal for anyone looking to enhance their understanding of innovation management and drive meaningful change within their organization. Whether you aim to improve product development processes, enhance customer experiences, or drive digital transformation, these frameworks offer valuable insights and tools to help you achieve your goals.
INCLUDED FRAMEWORKS/MODELS:
1. Stanford’s Design Thinking
2. IDEO’s Human-Centered Design
3. Strategyzer’s Business Model Innovation
4. Lean Startup Methodology
5. Agile Innovation Framework
6. Doblin’s Ten Types of Innovation
7. McKinsey’s Three Horizons of Growth
8. Customer Journey Map
9. Christensen’s Disruptive Innovation Theory
10. Blue Ocean Strategy
11. Strategyn’s Jobs-To-Be-Done (JTBD) Framework with Job Map
12. Design Sprint Framework
13. The Double Diamond
14. Lean Six Sigma DMAIC
15. TRIZ Problem-Solving Framework
16. Edward de Bono’s Six Thinking Hats
17. Stage-Gate Model
18. Toyota’s Six Steps of Kaizen
19. Microsoft’s Digital Transformation Framework
20. Design for Six Sigma (DFSS)
To download this presentation, visit:
https://www.oeconsulting.com.sg/training-presentations
Call8328958814 satta matka Kalyan result satta guessing➑➌➋➑➒➎➑➑➊➍
Satta Matka Kalyan Main Mumbai Fastest Results
Satta Matka ❋ Sattamatka ❋ New Mumbai Ratan Satta Matka ❋ Fast Matka ❋ Milan Market ❋ Kalyan Matka Results ❋ Satta Game ❋ Matka Game ❋ Satta Matka ❋ Kalyan Satta Matka ❋ Mumbai Main ❋ Online Matka Results ❋ Satta Matka Tips ❋ Milan Chart ❋ Satta Matka Boss❋ New Star Day ❋ Satta King ❋ Live Satta Matka Results ❋ Satta Matka Company ❋ Indian Matka ❋ Satta Matka 143❋ Kalyan Night Matka..
IMPACT Silver is a pure silver zinc producer with over $260 million in revenue since 2008 and a large 100% owned 210km Mexico land package - 2024 catalysts includes new 14% grade zinc Plomosas mine and 20,000m of fully funded exploration drilling.
The 10 Most Influential Leaders Guiding Corporate Evolution, 2024.pdfthesiliconleaders
In the recent edition, The 10 Most Influential Leaders Guiding Corporate Evolution, 2024, The Silicon Leaders magazine gladly features Dejan Štancer, President of the Global Chamber of Business Leaders (GCBL), along with other leaders.
How to Implement a Real Estate CRM SoftwareSalesTown
To implement a CRM for real estate, set clear goals, choose a CRM with key real estate features, and customize it to your needs. Migrate your data, train your team, and use automation to save time. Monitor performance, ensure data security, and use the CRM to enhance marketing. Regularly check its effectiveness to improve your business.
Best practices for project execution and deliveryCLIVE MINCHIN
A select set of project management best practices to keep your project on-track, on-cost and aligned to scope. Many firms have don't have the necessary skills, diligence, methods and oversight of their projects; this leads to slippage, higher costs and longer timeframes. Often firms have a history of projects that simply failed to move the needle. These best practices will help your firm avoid these pitfalls but they require fortitude to apply.
Understanding User Needs and Satisfying ThemAggregage
https://www.productmanagementtoday.com/frs/26903918/understanding-user-needs-and-satisfying-them
We know we want to create products which our customers find to be valuable. Whether we label it as customer-centric or product-led depends on how long we've been doing product management. There are three challenges we face when doing this. The obvious challenge is figuring out what our users need; the non-obvious challenges are in creating a shared understanding of those needs and in sensing if what we're doing is meeting those needs.
In this webinar, we won't focus on the research methods for discovering user-needs. We will focus on synthesis of the needs we discover, communication and alignment tools, and how we operationalize addressing those needs.
Industry expert Scott Sehlhorst will:
• Introduce a taxonomy for user goals with real world examples
• Present the Onion Diagram, a tool for contextualizing task-level goals
• Illustrate how customer journey maps capture activity-level and task-level goals
• Demonstrate the best approach to selection and prioritization of user-goals to address
• Highlight the crucial benchmarks, observable changes, in ensuring fulfillment of customer needs
The APCO Geopolitical Radar - Q3 2024 The Global Operating Environment for Bu...APCO
The Radar reflects input from APCO’s teams located around the world. It distils a host of interconnected events and trends into insights to inform operational and strategic decisions. Issues covered in this edition include:
Storytelling is an incredibly valuable tool to share data and information. To get the most impact from stories there are a number of key ingredients. These are based on science and human nature. Using these elements in a story you can deliver information impactfully, ensure action and drive change.
Building Your Employer Brand with Social MediaLuanWise
Presented at The Global HR Summit, 6th June 2024
In this keynote, Luan Wise will provide invaluable insights to elevate your employer brand on social media platforms including LinkedIn, Facebook, Instagram, X (formerly Twitter) and TikTok. You'll learn how compelling content can authentically showcase your company culture, values, and employee experiences to support your talent acquisition and retention objectives. Additionally, you'll understand the power of employee advocacy to amplify reach and engagement – helping to position your organization as an employer of choice in today's competitive talent landscape.
𝐔𝐧𝐯𝐞𝐢𝐥 𝐭𝐡𝐞 𝐅𝐮𝐭𝐮𝐫𝐞 𝐨𝐟 𝐄𝐧𝐞𝐫𝐠𝐲 𝐄𝐟𝐟𝐢𝐜𝐢𝐞𝐧𝐜𝐲 𝐰𝐢𝐭𝐡 𝐍𝐄𝐖𝐍𝐓𝐈𝐃𝐄’𝐬 𝐋𝐚𝐭𝐞𝐬𝐭 𝐎𝐟𝐟𝐞𝐫𝐢𝐧𝐠𝐬
Explore the details in our newly released product manual, which showcases NEWNTIDE's advanced heat pump technologies. Delve into our energy-efficient and eco-friendly solutions tailored for diverse global markets.
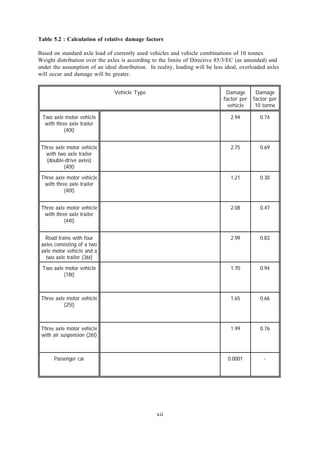
1. Table 5.2 : Calculation of relative damage factors
Based on standard axle load of currently used vehicles and vehicle combinations of 10 tonnes.
Weight distribution over the axles is according to the limits of Directive 85/3/EC (as amended) and
under the assumption of an ideal distribution. In reality, loading will be less ideal, overloaded axles
will occur and damage will be greater.
Vehicle Type Damage Damage
factor per factor per
vehicle 10 tonne
Two axle motor vehicle 2.94 0.74
with three axle trailer
(40t)
Three axle motor vehicle 2.75 0.69
with two axle trailer
(double-drive axles)
(40t)
Three axle motor vehicle 1.21 0.30
with three axle trailer
(40t)
Three axle motor vehicle 2.08 0.47
with three axle trailer
(44t)
Road trains with four 2.99 0.83
axles consisting of a two
axle motor vehicle and a
two axle trailer (36t)
Two axle motor vehicle 1.70 0.94
(18t)
Three axle motor vehicle 1.65 0.66
(25t)
Three axle motor vehicle 1.99 0.76
with air suspension (26t)
Passenger car 0.0001 -
xii
2. Annex 6 : Road accident statistics
Selected Risk Values for the Year 1993 (with exception of footnotes (1), (2), (3) and (4))
n° Killed Killed per Killed per Killed KILLED PER 100 000 POPULATION
109 pass. GNP per 10³
kms ECU
Total 0-14 years 15-24 25-64 65 years OUTSIDE MOTOR
GNP per
years years and more URBAN WAYS
capita
AREAS
B 1660 18 10 11 16.5 3.4 31.4 16.6 17.9 - 9.4
DK 559 8 5 6 10.8 3.6 15.8 8.8 21.2 17.3 3.5
D 9949 12 7 7 12.3 3.4 26.9 11.4 13.2 - 6.4
GR 2249 118 37 37 20.4 3.8 32.2 20.6 26.0 - -
E 6378 27 14 20 16.3 3.9 25.3 17.3 15.4 - -
F 9568 14 9 10 16.6 3.7 31.3 16.9 18.7 - 8.1
IRL 431 - 11 12 12.1 4.0 20.3 10.8 17.6 13.2 -
I 7110 10 8 8 12.6 2.3 20.50 10.9 15.7 - 11.9(2)
L 76 10 10 19.2 10.0 43.7 16.7 20.8 - -
NL 1252 8 5 5 8.2 3.2 13.9 6.5 16.0 10.9 3.1
A 1437 21 10 12 16.2 3.8 32.8 14.8 20.3 30.7(3) 11.2
P 2727 31 37 44 32.9(1) 9.5(1) 51.8(1) 32.8(1) 39.0(1) - 39.3(4)
FIN 484 8 5 6 9.6 3.1 15.3 8.7 17.0 13.0 1.7
S 632 6 3 4 7.3 1.6 10.6 6.7 12.4 - -
UK 3957 6 5 6 6.8 2.5 11.8 5.9 10.8 10.0(1) 3.1
Source : Statistics supplied by Member States for DG VII / ECMT/ UN
(1) based on 1992 figures (2) based on 1991 figures
(3) based on 1988 figures (4) based on 1989 figures
xiii
3. Annex 7 : External accident costs
Studies show that the transport user is quot;willing to payquot; a higher cost to reduce the risk in traffic than
the quot;hardquot; costs discussed in Chapter 5 (i.e. health care, lost consumption etc.). Some Member States
have introduced a quot;risk valuequot; component in the accident evaluations for cost-benefit assessments.
Using these studies, we can conclude that road users could have a willingness to pay of over 100
Billion ECU in order to reduce all the accidents in the Union during one year. Thus, taking into
account the total costs associated with injury causing road accidents alone - ie. the costs of medical
care, the individual's replacement and/or reintegration into society and the workplace, production losses,
the valuation of risk reduction - society as whole seems to have a willingness-to-pay to reduce all the
accidents in the Union of some 150 Billion ECU p.a. Fatalities constitute 36% of the total cost and
severe injuries 45%. Not all of these costs are however external.
It is not straightforward to determine which part of these costs are not taken into account by individual
transport users (and are quot;externalquot;) and should, therefore, be imputed to them. Some costs of accidents
- such as material damage - are paid through the insurance system, reflected in premiums and are
therefore already internalised.
At the same time it is clear that a significant part of the hard costs (i.e. lost production) are fully
external. Studies also suggest that the accident costs of pedestrians and cyclists are mostly external.
But determining which part of the quot;human griefquot; costs of killed and injured motorists are external
requires information on the extent to which increases in traffic levels raise accident risks. The stronger
this relation is, the higher are the external costs, because making an additional trip would lead to a
significant increase in accident rates for all other road users. In the absence of detailed studies on this
matter, the external part could probably be put at, at least, half of the total quot;human valuequot; costs. This
would suggest an external cost of some 1.5% of GDP in the Union, given that total costs amount to
some 2.5% of GDP. More research on this matter is, however, needed.
xiv
4. Annex 8 : Leverage points for reducing air pollutant emissions from road transport
VEHICLE AND FUEL CHARACTERISTICS
1. Fuel type Fuel quality influences the emission factors (grams/litre) of pollutants
such as the lead or benzene content in gasoline or the sulphur content
in diesel
2. Fuel efficiency
(litres per Lower fuel consumption per kilometre reduces global climate change
kilometre) directly. Diesel vehicles are more fuel efficient than gasoline vehicles
but diesel fuel has a higher carbon content than gasoline. The impact of
fuel efficiency per kilometre on other forms of pollution is unclear and
probably very small
3. Emission controls Other things equal, vehicles equipped with emission controls (e.g.
catalytic converter, particulates trap, exhaust gas recirculation) have
(vehicle
substantially lower emission factors than vehicles without emission
technology)
controls.
Other things equal, older vehicles tend to have higher emission factors
4. Age
than new vehicles due to the normal deterioration of the engine and the
emission controls
VEHICLE OWNERSHIP AND USE
5. Location Pollution costs are higher in urban areas (including city access) because
of the higher population density and exposure compared to non-urban
(rural and intercity) areas. The exception are emissions which have the
same potential impact irrespective of location (e.g. CO 2).
6. Time of day Driving in peak-hour congested traffic increases the average emission
factors of primary pollutants and CO 2.
Improvements in speeds reduce emission factors of CO and VOCs but
7. Speed
can increase the emission factors of NOx.
Other things equal a vehicle with a higher load emits more pollutants
8. Load
per kilometre than a vehicle with less load.
Cold-start emissions per kilometre are much higher than running or
9. Average trip
evaporative emissions and thus represent a large proportion of total
length and annual
emissions in short trips. Other things equal, 4 trips of 5 kms each
distance driven
produce higher emissions than 1 trip of 20 kms. Other things equal,
the more distance a vehicle is driven the more pollution it generates.
A smaller fleet will bring down emissions. A larger share of less
10. Size and
polluting vehicles has the same effect.
composition of
vehicle fleet
Other things equal, a well maintained vehicle with a tuned up engine
11. Vehicle
pollutes less than a badly maintained vehicle or a vehicle with emission
maintenance
controls that have been tampered with.
xv