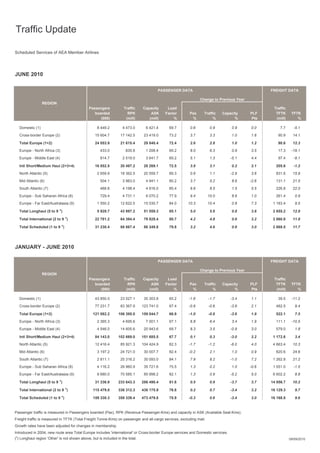
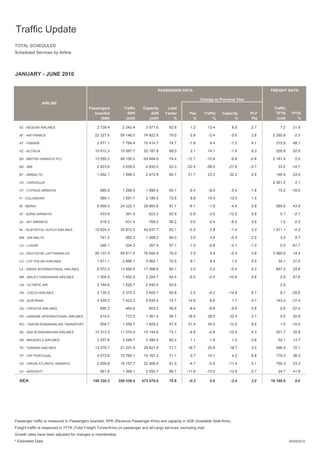
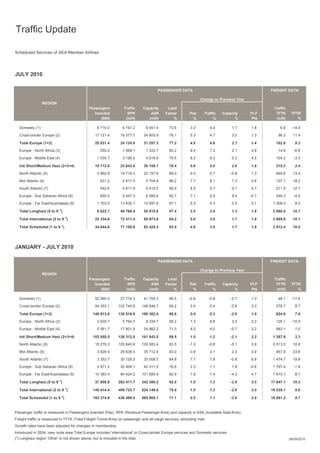
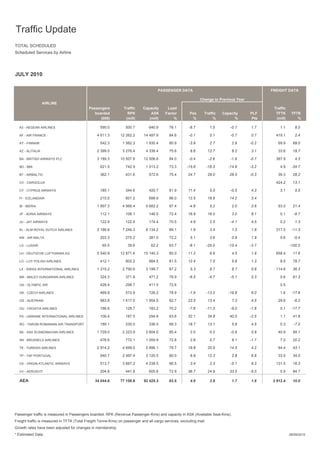
SlideShare a Scribd company logo
This Press Release has not yet been released.

Tables attached overleaf or download the data from the website


                                        -1-
Traffic Update

Scheduled Services of AEA Member Airlines


JUNE 2010

                                                                                        PASSENGER DATA                                          FREIGHT DATA

                                                                                                               Change to Previous Year
                 REGION
                                              Passengers            Traffic     Capacity     Load                                                Traffic
                                                 boarded              RPK           ASK     Factor      Pax      Traffic    Capacity     PLF      TFTK      TFTK
                                                    (000)            (mill)        (mill)       %        %            %           %       Pts     (mill)       %

  Domestic (1)                                      8 449.2         4 473.0       6 421.4     69.7      0.6           0.9         0.9    0.0         7.7     -5.1
  Cross-border Europe (2)                         15 604.7        17 142.5       23 419.0    73.2       3.7           3.3         1.0    1.6       90.9      14.1

  Total Europe (1+2)                              24 053.9        21 615.4       29 840.4     72.4      2.6           2.8         1.0    1.2       98.6      12.3
  Europe - North Africa (3)                           433.0           835.8       1 208.4     69.2      8.0           6.3         0.9    3.5       17.3     -19.1
  Europe - Middle East (4)                            814.7         2 519.0       3 641.7     69.2      5.1           1.3         -5.1   4.4       97.4      -9.1

  Intl Short/Medium Haul (2+3+4)                  16 852.5        20 497.2       28 269.1     72.5      3.9           3.1         0.2    2.1      205.6      -1.2

  North Atlantic (5)                                2 659.9       18 362.5       20 559.7     89.3      0.6           1.1         -2.9   3.6      831.6      15.9
  Mid Atlantic (6)                                    504.1         3 963.0       4 941.1     80.2      3.7           5.2         8.6    -2.6     131.1      21.5

  South Atlantic (7)                                  468.8         4 198.4       4 916.0     85.4      9.6           8.5         1.5    5.5      226.8      22.0

  Europe - Sub Saharan Africa (8)                     729.4         4 731.1       6 070.2     77.9      9.4          10.0         8.6    1.0      261.4       0.9
  Europe - Far East/Australasia (9)                 1 550.2       12 622.5       15 030.7     84.0     10.3          10.4         0.8    7.3     1 183.4      9.5

  Total Longhaul (5 to 9 x)                         5 928.7       43 897.2       51 559.3     85.1      5.0           5.6         0.8    3.8     2 655.2     12.9

  Total International (2 to 9 x)                  22 781.2        64 394.4       79 828.4     80.7      4.2           4.8         0.6    3.2     2 860.8     11.8
                                x
  Total Scheduled (1 to 9 )                       31 230.4        68 867.4       86 249.8     79.8      3.2           4.6         0.6    3.0     2 868.5     11.7


JANUARY - JUNE 2010

                                                                                        PASSENGER DATA                                          FREIGHT DATA

                                                                                                               Change to Previous Year
                 REGION
                                              Passengers            Traffic     Capacity     Load                                                Traffic
                                                 boarded              RPK           ASK     Factor      Pax      Traffic    Capacity     PLF      TFTK      TFTK
                                                    (000)            (mill)        (mill)       %        %            %           %       Pts     (mill)       %

  Domestic (1)                                    43 850.5        23 027.1       35 303.8     65.2      -1.6         -1.7         -3.4   1.1       39.5     -11.2

  Cross-border Europe (2)                         77 231.7        83 367.9      123 741.0    67.4       -0.6         -0.6         -3.6   2.1      482.5       9.4

  Total Europe (1+2)                             121 082.2       106 395.0      159 044.7     66.9      -1.0         -0.8         -3.6   1.9      522.1       7.5
  Europe - North Africa (3)                         2 365.3         4 695.6       7 001.1     67.1      6.8           6.4         3.4    1.9      111.1     -10.5

  Europe - Middle East (4)                          4 546.0       14 605.6       20 943.6     69.7      8.3           3.5         -0.9   3.0      579.0       1.8

  Intl Short/Medium Haul (2+3+4)                  84 143.0       102 669.0      151 685.5     67.7      0.1           0.3         -3.0   2.2     1 172.6      3.4
  North Atlantic (5)                              12 416.4        85 921.3      104 424.9     82.3      -1.7         -1.2         -6.0   4.0     4 663.4     10.3
  Mid Atlantic (6)                                  3 197.2       24 721.0       30 007.7     82.4      -0.2          2.1         1.0    0.9      820.6      24.6

  South Atlantic (7)                                2 811.1       25 316.2       30 093.0     84.1      7.9           8.2         -1.0   7.2     1 262.8     21.2
  Europe - Sub Saharan Africa (8)                   4 116.2       26 960.9       35 721.6     75.5      1.3           0.2         1.0    -0.6    1 551.0     -1.5
  Europe - Far East/Australasia (9)                 8 680.0       70 585.1       85 998.2     82.1      1.3           0.9         -5.2   5.0     6 602.2      8.8
                            x
  Total Longhaul (5 to 9 )                        31 336.9       233 643.3      286 490.4     81.6      0.5           0.9         -3.7   3.7    14 956.7     10.2

  Total International (2 to 9 x)                 115 479.8       336 312.3      438 175.9     76.8      0.2           0.7         -3.4   3.2    16 129.3      9.7
                                x
  Total Scheduled (1 to 9 )                      159 330.3       359 339.4      473 479.8     75.9      -0.3          0.6         -3.4   3.0    16 168.8      9.6


Passenger traffic is measured in Passengers boarded (Pax), RPK (Revenue Passenger-Kms) and capacity in ASK (Available Seat-Kms).
Freight traffic is measured in TFTK (Total Freight Tonne-Kms) on passenger and all-cargo services, excluding mail.
Growth rates have been adjusted for changes in membership.
Introduced in 2004, new route area Total Europe includes 'international' or Cross-border Europe services and Domestic services.
(x) Longhaul region 'Other' is not shown above, but is included in the total.                                                                              09/09/2010
Traffic Update
TOTAL SCHEDULED
Scheduled Services by Airline


JUNE 2010

                                                                                     PASSENGER DATA                                             FREIGHT DATA

                                                                                                               Change to Previous Year
                  AIRLINE
                                            Passengers           Traffic    Capacity       Load                                                  Traffic
                                               boarded             RPK          ASK       Factor        Pax      Traffic     Capacity    PLF      TFTK      TFTK
                                                  (000)           (mill)       (mill)         %          %            %            %      Pts     (mill)       %

  A3 - AEGEAN AIRLINES                             485.4          417.4         600.0       69.6      -16.7           -2.3       -2.1    -0.1        1.0     22.5

  AF - AIR FRANCE                                4 335.5       10 987.0      13 374.8       82.1        0.1           2.4        -1.2    2.9      401.6      -2.7

  AY - FINNAIR                                     541.4        1 432.0       1 883.3       76.0        2.2          11.6        5.8     4.0       66.5      70.1

  AZ - ALITALIA                                  2 095.0        2 982.2       4 131.6       72.2        7.5          16.7        6.8     6.1       39.1      35.9

  BA - BRITISH AIRWAYS PLC                       2 556.1        8 776.4      11 328.6       77.5      -12.5          -11.1       -8.5    -2.3     385.7       8.1

  BD - BMI                                         592.7          662.5         963.9       68.7      -11.4          -16.7      -14.4    -1.9        4.6    -45.2

  BT - AIRBALTIC                                   334.1          384.8         539.2       71.4       32.6          37.9       36.4     0.8       35.1      38.0

  CV - CARGOLUX                                      0.0            0.0           0.0        0.0        0.0           0.0        0.0     0.0      414.6      13.4

  CY - CYPRUS AIRWAYS                              147.5          280.7         403.7       69.5        4.1           0.5        0.8     -0.2        2.6      8.2

  FI - ICELANDAIR                                  174.1          492.0         615.5       79.9       15.3          23.5       18.4     3.3         0.0      0.0

  IB - IBERIA                                    1 756.2        4 436.9       5 203.3       85.3        -4.9          2.1        -0.6    2.2       93.8      38.3

  JP - ADRIA AIRWAYS                                92.8           84.8         124.7       68.0        2.6           0.5       -11.3    8.0         0.1      2.9

  JU - JAT AIRWAYS                                  87.4           88.7         144.1       61.6        -2.3          -0.4      -10.6    6.3         0.2     51.1

  KL - KLM ROYAL DUTCH AIRLINES                  2 053.0        6 749.6       7 789.7       86.6        6.2           9.7        3.4     4.9      305.4     -13.2

  KM - AIR MALTA                                   166.1          231.6         342.6       67.6        5.3           4.4        -2.0    4.1         0.6    -14.4

  LG - LUXAIR                                       66.5           38.6          61.4       62.8        -2.0         -15.5      -13.0    -1.9        0.0   -100.0

  LH - DEUTSCHE LUFTHANSA AG                     5 330.8       11 915.2      14 264.1       83.5       12.7           9.9        2.3     5.7      669.2      16.0

  LO - LOT POLISH AIRLINES                         381.7          721.1         905.8       79.6        7.7           9.1        4.5     3.3         7.4     58.6

  LX - SWISS INTERNATIONAL AIRLINES              1 209.3        2 586.1       3 057.6       84.6        -2.1         10.6        8.2     1.8      110.4      33.3

  MA - MALEV HUNGARIAN AIRLINES                    282.5          322.3         455.9       70.7        -5.3          -2.1       -5.7    2.6         0.5     64.7

  OA - OLYMPIC AIR                                 385.9          262.3         406.9       64.5        0.0           0.0        0.0     0.0         0.5      0.0

  OK - CZECH AIRLINES                              403.3          458.3         672.8       68.1        -5.0         -16.0      -18.2    1.9         1.6    -11.1

  OS - AUSTRIAN                                    936.7        1 466.5       1 846.8       79.4       25.5          17.9        6.4     7.8       20.9     -32.1

  OU - CROATIA AIRLINES                            162.0          112.2         175.3       64.0        -6.6         -10.0       -5.5    -3.2        0.1     -5.4

  PS - UKRAINE INTERNATIONAL AIRLINES               91.9          154.9         285.1       54.3       31.1          31.6       47.2     -6.4        1.0     34.1

  RO - TAROM ROMANIAN AIR TRANSPORT                175.9          205.1         330.5       62.1       26.5          22.8       11.2     5.8         0.3     -2.1

  SK - SAS SCANDINAVIAN AIRLINES                 2 081.4        2 298.3       2 857.3       80.4        -1.5          -1.1       -5.1    3.3       40.3      64.7

  SN - BRUSSELS AIRLINES                           447.9          629.2         980.9       64.1        3.6           2.8        1.7     0.7         9.1     16.4

  TK - TURKISH AIRLINES                          2 468.7        3 908.4       5 292.2       73.9       13.7          18.5       13.6     3.0       83.6      62.8

  TP - TAP PORTUGAL                                759.3        1 987.5       2 766.0       71.9       13.9          24.8       22.3     1.5       33.3      57.0

  VS - VIRGIN ATLANTIC AIRWAYS                     485.5        3 472.2       3 968.9       87.5        5.4           4.6        -2.6    6.0      134.4      38.6

  VV - AEROSVIT                                    143.7          322.7         477.6       67.6       13.6           9.6       13.8     -2.6        4.8     57.7

  AEA                                           31 230.4       68 867.4      86 249.8       79.8        3.2           4.6        0.6     3.0     2 868.5     11.7


Passenger traffic is measured in Passengers boarded, RPK (Revenue Passenger-Kms) and capacity in ASK (Available Seat-Kms).
Freight traffic is measured in TFTK (Total Freight Tonne-Kms) on passenger and all-cargo services, excluding mail.
Growth rates have been adjusted for changes in membership.
* Estimated Data                                                                                                                                           09/09/2010
Traffic Update
TOTAL SCHEDULED
Scheduled Services by Airline


JANUARY - JUNE 2010

                                                                                     PASSENGER DATA                                             FREIGHT DATA

                                                                                                               Change to Previous Year
                  AIRLINE
                                            Passengers           Traffic    Capacity       Load                                                  Traffic
                                               boarded             RPK          ASK       Factor        Pax      Traffic     Capacity    PLF      TFTK      TFTK
                                                  (000)           (mill)       (mill)         %          %            %            %      Pts     (mill)       %

  A3 - AEGEAN AIRLINES                           2 728.4        2 242.4       3 571.0       62.8        1.2          13.4        8.5     2.7         7.2     21.9

  AF - AIR FRANCE                               22 327.6       59 146.0      74 822.6       79.0        -3.9          -2.4       -5.6    2.6     2 280.8     -2.3

  AY - FINNAIR                                   2 971.1        7 784.4      10 414.7       74.7        -1.9          4.4        -1.3    4.1      315.8      48.1

  AZ - ALITALIA                                 10 612.3       15 097.7      22 187.8       68.0        3.1          14.1        -1.4    9.3      205.8      52.5

  BA - BRITISH AIRWAYS PLC                      13 555.2       48 150.0      64 684.6       74.4      -12.7          -10.9       -9.8    -0.9    2 181.4      5.5

  BD - BMI                                       2 823.6        3 059.6       4 835.0       63.3      -22.4          -26.0      -21.6    -3.7      33.0     -14.7

  BT - AIRBALTIC                                 1 452.1        1 599.3       2 472.9       64.7       21.7          23.2       22.2     0.5      146.9      23.4

  CV - CARGOLUX                                      0.0            0.0           0.0        0.0        0.0           0.0        0.0     0.0     2 361.2      3.1

  CY - CYPRUS AIRWAYS                              685.5        1 296.0       1 990.4       65.1        -5.4          -8.0       -5.4    -1.8      15.2     -19.0

  FI - ICELANDAIR                                  589.1        1 591.7       2 186.0       72.8        9.8          15.4       13.0     1.5         0.0      0.0

  IB - IBERIA                                    9 568.0       24 232.7      29 665.6       81.7        -6.1          -1.0       -4.4    2.8      569.6      43.8

  JP - ADRIA AIRWAYS                               433.6          391.9         623.3       62.9        -2.6          -3.5      -12.5    5.9         0.7     -2.7

  JU - JAT AIRWAYS                                 418.3          431.4         768.0       56.2        0.0           0.4        -6.0    3.6         1.0      0.3

  KL - KLM ROYAL DUTCH AIRLINES                 10 624.3       35 812.5      43 637.7       82.1        -0.3          2.8        -1.4    3.3     1 911.1     -4.3

  KM - AIR MALTA                                   741.2          982.3       1 488.2       66.0        3.0           3.6        -0.3    2.5         3.5      5.7

  LG - LUXAIR                                      346.1          204.3         357.9       57.1        -1.5          -5.8       -4.1    -1.0        0.0    -91.7

  LH - DEUTSCHE LUFTHANSA AG                    26 137.4       59 811.0      76 694.9       78.0        2.5           3.4        -0.3    2.8     3 580.6     14.4

  LO - LOT POLISH AIRLINES                       1 811.1        2 886.1       3 982.1       72.5        8.1           9.4        1.0     5.5       34.1      31.5

  LX - SWISS INTERNATIONAL AIRLINES              6 572.4       13 695.8      17 088.6       80.1        2.0           5.2        -0.4    4.3      647.0      23.6

  MA - MALEV HUNGARIAN AIRLINES                  1 304.9        1 452.9       2 254.7       64.4        -5.0          -2.4      -10.9    5.6         2.6     51.6

  OA - OLYMPIC AIR                               2 144.6        1 526.7       2 440.0       62.6        0.0           0.0        0.0     0.0         2.9      0.0

  OK - CZECH AIRLINES                            2 135.3        2 375.3       3 609.7       65.8        2.5           -5.2      -14.9    6.7         8.7    -25.8

  OS - AUSTRIAN                                  4 539.2        7 423.3       9 935.4       74.7       14.6           8.6        1.7     4.7      142.4     -12.4

  OU - CROATIA AIRLINES                            695.2          454.8         803.2       56.6        -8.4          -8.9       -9.9    0.6         0.8    -22.4

  PS - UKRAINE INTERNATIONAL AIRLINES              414.0          772.5       1 361.4       56.7       18.4          28.5       22.4     2.7         5.5     20.9

  RO - TAROM ROMANIAN AIR TRANSPORT                904.7        1 059.7       1 829.2       57.9       31.4          34.0       12.0     9.5         1.5    -15.0

  SK - SAS SCANDINAVIAN AIRLINES                10 313.3       11 074.9      15 144.6       73.1        -4.8          -4.8      -10.4    4.3      201.7      35.8

  SN - BRUSSELS AIRLINES                         2 257.8        3 246.7       5 390.4       60.2        1.1           1.9        1.0     0.6       52.1      13.7

  TK - TURKISH AIRLINES                         13 079.7       21 231.8      29 621.8       71.7       18.7          25.9       19.7     3.5      496.4      72.1

  TP - TAP PORTUGAL                              4 072.8       10 780.1      15 161.2       71.1        5.7          15.1        4.2     6.8      179.3      36.3

  VS - VIRGIN ATLANTIC AIRWAYS                   2 509.8       18 157.7      22 406.4       81.0        -4.7          -5.5      -11.4    5.1      755.3      23.3

  VV - AEROSVIT                                    561.8        1 368.1       2 050.7       66.7      -11.6          -13.0      -13.9    0.7       24.7      41.8

  AEA                                         159 330.3       359 339.4    473 479.8        75.9        -0.3          0.6        -3.4    3.0    16 168.8      9.6


Passenger traffic is measured in Passengers boarded, RPK (Revenue Passenger-Kms) and capacity in ASK (Available Seat-Kms).
Freight traffic is measured in TFTK (Total Freight Tonne-Kms) on passenger and all-cargo services, excluding mail.
Growth rates have been adjusted for changes in membership.
* Estimated Data                                                                                                                                           09/09/2010
Traffic Update

Scheduled Services of AEA Member Airlines


JULY 2010

                                                                                        PASSENGER DATA                                          FREIGHT DATA

                                                                                                               Change to Previous Year
                 REGION
                                              Passengers            Traffic     Capacity     Load                                                Traffic
                                                 boarded              RPK           ASK     Factor      Pax      Traffic    Capacity     PLF      TFTK      TFTK
                                                    (000)            (mill)        (mill)       %        %            %           %       Pts     (mill)       %

  Domestic (1)                                      8 710.0         4 747.2       6 451.5     73.6      3.2          4.0          1.7    1.6         6.6    -14.0
  Cross-border Europe (2)                         17 121.4        19 377.7       24 805.8    78.1       5.3          4.7          3.0    1.3       96.2      11.4

  Total Europe (1+2)                              25 831.4        24 124.9       31 257.3     77.2      4.6          4.6          2.7    1.4      102.8       9.3
  Europe - North Africa (3)                           555.4         1 069.1       1 333.7     80.2      9.4          7.3          2.1    3.9       14.9      -6.8
  Europe - Middle East (4)                          1 035.7         3 196.2       4 018.6     79.5      9.2          6.2          0.2    4.5      104.2      -3.3

  Intl Short/Medium Haul (2+3+4)                  18 712.6        23 643.0       30 158.1     78.4      5.6          5.0          2.6    1.8      215.3       2.4

  North Atlantic (5)                                2 862.8       19 719.3       22 157.6     89.0      0.4          0.7          -0.8   1.3      849.6      13.4
  Mid Atlantic (6)                                    631.2         4 917.5       5 704.8     86.2      7.1          8.1          7.3    0.6      137.1      18.2

  South Atlantic (7)                                  542.6         4 811.8       5 415.5     88.9      6.5          5.7          0.1    4.7      211.9      12.7

  Europe - Sub Saharan Africa (8)                     855.0         5 447.3       6 589.6     82.7      7.1          5.5          6.4    -0.7     246.3      -4.5
  Europe - Far East/Australasia (9)                 1 703.5       13 839.1       15 897.8     87.1      5.3          4.3          0.5    3.1     1 208.5      8.0

  Total Longhaul (5 to 9 x)                         6 622.1       48 768.4       55 815.8     87.4      3.5          3.4          1.3    1.8     2 690.5     10.7

  Total International (2 to 9 x)                  25 334.6        72 411.4       85 973.8     84.2      5.0          3.9          1.7    1.8     2 905.8     10.1
                                x
  Total Scheduled (1 to 9 )                       34 044.6        77 158.6       92 425.3     83.5      4.6          3.9          1.7    1.8     2 912.4     10.0


JANUARY - JULY 2010

                                                                                        PASSENGER DATA                                          FREIGHT DATA

                                                                                                               Change to Previous Year
                 REGION
                                              Passengers            Traffic     Capacity     Load                                                Traffic
                                                 boarded              RPK           ASK     Factor      Pax      Traffic    Capacity     PLF      TFTK      TFTK
                                                    (000)            (mill)        (mill)       %        %            %           %       Pts     (mill)       %

  Domestic (1)                                    52 560.5        27 774.3       41 755.3     66.5      -0.9         -0.8         -2.7   1.3       46.1     -11.6

  Cross-border Europe (2)                         94 353.1       102 745.6      148 546.7    69.2       0.4          0.4          -2.6   2.0      578.7       9.7

  Total Europe (1+2)                             146 913.6       130 519.9      190 302.0     68.6      0.0          0.2          -2.6   1.9      624.9       7.8
  Europe - North Africa (3)                         2 920.7         5 764.7       8 334.7     69.2      7.3          6.6          3.2    2.2      126.1     -10.0

  Europe - Middle East (4)                          5 581.7       17 801.8       24 962.2     71.3      8.5          4.0          -0.7   3.2      683.1       1.0

  Intl Short/Medium Haul (2+3+4)                 102 855.5       126 312.0      181 843.5     69.5      1.0          1.2          -2.1   2.2     1 387.9      3.3
  North Atlantic (5)                              15 279.3       105 640.6      126 582.4     83.5      -1.3         -0.8         -5.1   3.6     5 513.0     10.8
  Mid Atlantic (6)                                  3 828.4       29 638.5       35 712.4     83.0      0.9          3.1          2.0    0.9      957.8      23.6

  South Atlantic (7)                                3 353.7       30 128.0       35 508.5     84.8      7.7          7.8          -0.8   6.8     1 474.7     19.9
  Europe - Sub Saharan Africa (8)                   4 971.2       32 408.1       42 311.2     76.6      2.3          1.1          1.8    -0.6    1 797.4     -1.9
  Europe - Far East/Australasia (9)               10 383.4        84 424.2      101 895.9     82.9      1.9          1.4          -4.3   4.7     7 810.7      8.7
                            x
  Total Longhaul (5 to 9 )                        37 958.9       282 411.7      342 306.2     82.5      1.0          1.3          -2.9   3.5    17 647.1     10.3

  Total International (2 to 9 x)                 140 814.4       408 723.7      524 149.8     78.0      1.0          1.3          -2.6   3.0    19 035.1      9.8
                                x
  Total Scheduled (1 to 9 )                      193 374.9       436 498.0      565 905.1     77.1      0.5          1.1          -2.6   2.9    19 081.2      9.7


Passenger traffic is measured in Passengers boarded (Pax), RPK (Revenue Passenger-Kms) and capacity in ASK (Available Seat-Kms).
Freight traffic is measured in TFTK (Total Freight Tonne-Kms) on passenger and all-cargo services, excluding mail.
Growth rates have been adjusted for changes in membership.
Introduced in 2004, new route area Total Europe includes 'international' or Cross-border Europe services and Domestic services.
(x) Longhaul region 'Other' is not shown above, but is included in the total.                                                                              08/09/2010
Traffic Update
TOTAL SCHEDULED
Scheduled Services by Airline


JULY 2010

                                                                                     PASSENGER DATA                                             FREIGHT DATA

                                                                                                               Change to Previous Year
                  AIRLINE
                                            Passengers           Traffic    Capacity       Load                                                  Traffic
                                               boarded             RPK          ASK       Factor        Pax      Traffic     Capacity    PLF      TFTK      TFTK
                                                  (000)           (mill)       (mill)         %          %            %            %      Pts     (mill)       %

  A3 - AEGEAN AIRLINES                             595.0          500.7         640.9       78.1        -8.7          1.5        -0.7    1.7         1.1      8.0

  AF - AIR FRANCE                                4 611.3       12 262.2      14 497.9       84.6        -0.1          0.1        -0.7    0.7      419.1       2.4

  AY - FINNAIR                                     542.3        1 562.3       1 930.4       80.9        -3.9          2.7        2.9     -0.2      69.9      69.0

  AZ - ALITALIA                                  2 399.0        3 276.4       4 336.4       75.6        8.6          12.7        8.2     3.1       33.6      19.7

  BA - BRITISH AIRWAYS PLC                       3 189.3       10 507.8      12 506.6       84.0        -0.4          -2.6       -1.9    -0.7     387.9       4.3

  BD - BMI                                         621.5          742.9       1 013.2       73.3      -15.8          -18.3      -14.8    -3.2        4.9    -34.7

  BT - AIRBALTIC                                   362.1          431.6         572.6       75.4       24.7          28.0       28.5     -0.3      39.3      28.2

  CV - CARGOLUX                                      0.0            0.0           0.0        0.0        0.0           0.0        0.0     0.0      424.2      13.1

  CY - CYPRUS AIRWAYS                              185.1          344.6         420.7       81.9       11.4           5.0        -0.5    4.3         3.1      5.5

  FI - ICELANDAIR                                  215.5          601.2         698.9       86.0       12.5          18.9       14.2     3.4         0.0      0.0

  IB - IBERIA                                    1 897.3        4 966.4       5 682.2       87.4        -4.8          5.2        2.0     2.6       93.0      21.4

  JP - ADRIA AIRWAYS                               112.1          106.1         146.5       72.4       16.8          16.0        3.0     8.1         0.1     -8.7

  JU - JAT AIRWAYS                                 122.9          122.9         174.4       70.5        4.8           2.5        -4.1    4.5         0.2      1.3

  KL - KLM ROYAL DUTCH AIRLINES                  2 186.6        7 246.3       8 134.2       89.1        1.9           3.4        1.3     1.8      317.0     -11.3

  KM - AIR MALTA                                   203.3          275.2         381.0       72.2        5.1           3.6        0.9     1.9         0.6     -5.4

  LG - LUXAIR                                       65.5           39.6          62.2       63.7        -8.1         -20.0      -15.4    -3.7        0.0   -100.0

  LH - DEUTSCHE LUFTHANSA AG                     5 540.9       12 871.6      15 140.3       85.0       11.2           6.9        4.5     1.9      658.4      11.6

  LO - LOT POLISH AIRLINES                         412.1          802.2         984.5       81.5       12.4           7.5        5.8     1.3         8.5     79.7

  LX - SWISS INTERNATIONAL AIRLINES              1 315.2        2 790.6       3 199.7       87.2        5.3           9.7        8.7     0.8      114.6      36.3

  MA - MALEV HUNGARIAN AIRLINES                    324.3          371.8         471.2       78.9        -6.5          -4.7       -5.1    0.3         0.6     61.3

  OA - OLYMPIC AIR                                 428.4          298.7         411.5       72.6        0.0           0.0        0.0     0.0         0.5      0.0

  OK - CZECH AIRLINES                              469.9          572.9         726.2       78.9        -1.9         -13.2      -19.8    6.0         1.6    -17.6

  OS - AUSTRIAN                                    983.8        1 617.0       1 954.5       82.7       23.5          13.4        7.3     4.5       29.6      -9.2

  OU - CROATIA AIRLINES                            186.6          128.7         183.2       70.2        -7.8         -11.3       -9.0    -1.8        0.1    -17.7

  PS - UKRAINE INTERNATIONAL AIRLINES              106.4          187.5         294.9       63.6       32.1          34.8       40.0     -2.5        1.1     41.6

  RO - TAROM ROMANIAN AIR TRANSPORT                189.1          230.0         336.5       68.3       18.7          13.1        5.8     4.5         0.3     -7.0

  SK - SAS SCANDINAVIAN AIRLINES                 1 729.0        2 223.9       2 604.0       85.4        2.0           0.2        -0.9    0.9       40.9      95.1

  SN - BRUSSELS AIRLINES                           476.6          772.1       1 059.9       72.8        2.6           5.7        8.1     -1.7        7.0     20.2

  TK - TURKISH AIRLINES                          2 914.2        4 699.0       5 896.1       79.7       19.8          20.9       14.5     4.2       84.4      43.1

  TP - TAP PORTUGAL                                940.7        2 497.4       3 120.5       80.0        6.9          12.3        2.8     6.8       33.5      34.0

  VS - VIRGIN ATLANTIC AIRWAYS                     513.7        3 667.2       4 238.5       86.5        3.4           2.3        -5.1    6.3      131.5      16.3

  VV - AEROSVIT                                    204.8          441.8         605.8       72.9       36.7          24.9       33.5     -5.0        5.9     94.7

  AEA                                           34 044.6       77 158.6      92 425.3       83.5        4.6           3.9        1.7     1.8     2 912.4     10.0


Passenger traffic is measured in Passengers boarded, RPK (Revenue Passenger-Kms) and capacity in ASK (Available Seat-Kms).
Freight traffic is measured in TFTK (Total Freight Tonne-Kms) on passenger and all-cargo services, excluding mail.
Growth rates have been adjusted for changes in membership.
* Estimated Data                                                                                                                                           08/09/2010
Traffic Update
TOTAL SCHEDULED
Scheduled Services by Airline


JANUARY - JULY 2010

                                                                                     PASSENGER DATA                                             FREIGHT DATA

                                                                                                               Change to Previous Year
                  AIRLINE
                                            Passengers           Traffic    Capacity       Load                                                  Traffic
                                               boarded             RPK          ASK       Factor        Pax      Traffic     Capacity    PLF      TFTK      TFTK
                                                  (000)           (mill)       (mill)         %          %            %            %      Pts     (mill)       %

  A3 - AEGEAN AIRLINES                           3 323.4        2 743.1       4 211.9       65.1        -0.7         11.1        7.0     2.4         8.2     19.9

  AF - AIR FRANCE                               26 938.8       71 408.2      89 320.5       79.9        -3.3          -2.0       -4.8    2.3     2 699.9     -1.6

  AY - FINNAIR                                   3 513.4        9 346.7      12 345.1       75.7        -2.2          4.1        -0.6    3.5      385.7      51.5

  AZ - ALITALIA                                 13 011.3       18 374.1      26 524.1       69.3        4.1          13.9        0.0     8.4      239.4      46.9

  BA - BRITISH AIRWAYS PLC                      16 744.4       58 657.8      77 191.1       76.0      -10.6           -9.5       -8.6    -0.7    2 569.3      5.3

  BD - BMI                                       3 445.1        3 802.6       5 848.2       65.0      -21.3          -24.6      -20.5    -3.5      37.9     -17.9

  BT - AIRBALTIC                                 1 814.2        2 030.8       3 045.5       66.7       22.3          24.1       23.3     0.4      186.2      24.4

  CV - CARGOLUX                                      0.0            0.0           0.0        0.0        0.0           0.0        0.0     0.0     2 785.3      4.5

  CY - CYPRUS AIRWAYS                              870.6        1 640.6       2 411.0       68.0        -2.2          -5.5       -4.6    -0.7      18.3     -15.6

  FI - ICELANDAIR                                  804.6        2 192.9       2 884.8       76.0       10.5          16.3       13.3     2.0         0.0      0.0

  IB - IBERIA                                   11 465.3       29 199.2      35 347.7       82.6        -5.9          0.0        -3.4    2.8      662.5      40.2

  JP - ADRIA AIRWAYS                               545.8          498.0         769.7       64.7        0.9           0.1       -10.0    6.5         0.9     -3.7

  JU - JAT AIRWAYS                                 541.2          554.3         942.4       58.8        1.0           0.8        -5.6    3.8         1.2      0.4

  KL - KLM ROYAL DUTCH AIRLINES                 12 810.9       43 058.8      51 771.9       83.2        0.1           2.9        -0.9    3.1     2 228.1     -5.4

  KM - AIR MALTA                                   944.5        1 257.6       1 869.2       67.3        3.5           3.6        -0.1    2.4         4.1      4.0

  LG - LUXAIR                                      411.7          243.9         420.1       58.1        -2.6          -8.4       -6.0    -1.6        0.0    -93.3

  LH - DEUTSCHE LUFTHANSA AG                    31 678.3       72 682.6      91 835.2       79.1        3.9           4.0        0.4     2.7     4 239.0     14.0

  LO - LOT POLISH AIRLINES                       2 223.3        3 688.4       4 966.6       74.3        8.9           9.0        1.9     4.8       42.6      38.9

  LX - SWISS INTERNATIONAL AIRLINES              7 887.7       16 486.4      20 288.3       81.3        2.5           6.0        1.0     3.8      761.6      25.4

  MA - MALEV HUNGARIAN AIRLINES                  1 629.2        1 824.7       2 725.9       66.9        -5.3          -2.9      -10.0    4.9         3.2     53.3

  OA - OLYMPIC AIR                               2 573.0        1 825.4       2 851.5       64.0        0.0           0.0        0.0     0.0         3.4      0.0

  OK - CZECH AIRLINES                            2 605.2        2 948.2       4 336.0       68.0        1.7           -6.8      -15.8    6.5       10.2     -24.6

  OS - AUSTRIAN                                  5 522.9        9 040.3      11 889.9       76.0       16.1           9.4        2.6     4.7      172.0     -11.8

  OU - CROATIA AIRLINES                            881.8          583.4         986.4       59.1        -8.3          -9.5       -9.7    0.2         0.9    -21.7

  PS - UKRAINE INTERNATIONAL AIRLINES              520.4          960.0       1 656.3       58.0       21.0          29.7       25.2     2.0         6.6     23.9

  RO - TAROM ROMANIAN AIR TRANSPORT              1 093.8        1 289.7       2 165.7       59.5       29.0          29.8       11.0     8.6         1.8    -13.8

  SK - SAS SCANDINAVIAN AIRLINES                12 042.3       13 298.7      17 748.7       74.9        -3.9          -4.0       -9.1    4.0      242.6      43.1

  SN - BRUSSELS AIRLINES                         2 734.5        4 018.7       6 450.3       62.3        1.3           2.6        2.1     0.3       59.2      14.4

  TK - TURKISH AIRLINES                         15 993.9       25 930.7      35 517.9       73.0       18.9          24.9       18.8     3.6      580.8      67.2

  TP - TAP PORTUGAL                              5 013.5       13 277.5      18 281.7       72.6        5.9          14.6        3.9     6.7      212.8      35.9

  VS - VIRGIN ATLANTIC AIRWAYS                   3 023.5       21 825.0      26 644.9       81.9        -3.4          -4.3      -10.5    5.3      886.8      22.2

  VV - AEROSVIT                                    766.6        1 809.9       2 656.5       68.1        -2.4          -6.1       -6.3    0.2       30.6      49.7

  AEA                                         193 374.9       436 498.0    565 905.1        77.1        0.5           1.1        -2.6    2.9    19 081.2      9.7


Passenger traffic is measured in Passengers boarded, RPK (Revenue Passenger-Kms) and capacity in ASK (Available Seat-Kms).
Freight traffic is measured in TFTK (Total Freight Tonne-Kms) on passenger and all-cargo services, excluding mail.
Growth rates have been adjusted for changes in membership.
* Estimated Data                                                                                                                                           08/09/2010

More Related Content

Similar to Pr10 032

Technology forecasting using dea in the presence of infeasibility
Technology forecasting using dea in the presence of infeasibilityTechnology forecasting using dea in the presence of infeasibility
Technology forecasting using dea in the presence of infeasibility
dongjoon
 
Table 8, mdg 8 partnership for development, low- & middle- income countries
Table 8, mdg 8  partnership for development, low- & middle- income countriesTable 8, mdg 8  partnership for development, low- & middle- income countries
Table 8, mdg 8 partnership for development, low- & middle- income countriesBread for the World
 
Fact sheet industry facts iata
Fact sheet industry facts   iataFact sheet industry facts   iata
Fact sheet industry facts iataprinci05
 
ธนาคารกสิกรไทย
ธนาคารกสิกรไทย ธนาคารกสิกรไทย
ธนาคารกสิกรไทย
Adcha'z Tawinprai
 
Analisis Horta Guinardo 2008 03 10
Analisis Horta Guinardo 2008 03 10Analisis Horta Guinardo 2008 03 10
Analisis Horta Guinardo 2008 03 101977bcn
 
Fdi & Fii Final
Fdi & Fii  FinalFdi & Fii  Final
Fdi & Fii Final
Jonty Mohta
 
Debt indicators of Turkey
Debt indicators of TurkeyDebt indicators of Turkey
Debt indicators of Turkey
BCN Turkey
 
3Q14 Results Presentation
3Q14 Results Presentation3Q14 Results Presentation
3Q14 Results Presentation
TegmaRI
 
Container Transportation 2009 2010
Container Transportation 2009 2010Container Transportation 2009 2010
Container Transportation 2009 2010
Duy Nguyen, Senior Associate
 
моделирование спроса на услуги контейнерного терминала
моделирование спроса на услуги контейнерного терминаламоделирование спроса на услуги контейнерного терминала
моделирование спроса на услуги контейнерного терминала
Александр Головизнин
 
2010-2013 Semiconductor Market Forecast Seizing the economic & political ...
2010-2013 Semiconductor Market Forecast Seizing the economic & political ...2010-2013 Semiconductor Market Forecast Seizing the economic & political ...
2010-2013 Semiconductor Market Forecast Seizing the economic & political ...Stephan Cadene
 
Traffic Tracker
Traffic TrackerTraffic Tracker
Traffic Tracker
Arthur Thomas
 
اثر اتفاقية اغادير على الميزان التجارى بين مصر ودول الاتفاقية
اثر اتفاقية اغادير على الميزان التجارى بين مصر ودول الاتفاقيةاثر اتفاقية اغادير على الميزان التجارى بين مصر ودول الاتفاقية
اثر اتفاقية اغادير على الميزان التجارى بين مصر ودول الاتفاقيةخالد سمير الهلالي
 
Key+tyre+industry+figures+2012
Key+tyre+industry+figures+2012Key+tyre+industry+figures+2012
Key+tyre+industry+figures+2012Vladimir Kolev
 
When Micromobility Attacks
When Micromobility AttacksWhen Micromobility Attacks
When Micromobility Attacks
Horace Dediu
 
Pr 041010 aug_stats_final
Pr 041010 aug_stats_finalPr 041010 aug_stats_final
Pr 041010 aug_stats_final
Gianfranco Conti
 
UNCTAD - Country fact sheet report 2010 Malaysia
UNCTAD -  Country fact sheet report 2010 MalaysiaUNCTAD -  Country fact sheet report 2010 Malaysia
UNCTAD - Country fact sheet report 2010 Malaysiatawelun
 

Similar to Pr10 032 (20)

Pr10 011
Pr10 011Pr10 011
Pr10 011
 
Technology forecasting using dea in the presence of infeasibility
Technology forecasting using dea in the presence of infeasibilityTechnology forecasting using dea in the presence of infeasibility
Technology forecasting using dea in the presence of infeasibility
 
Table 8, mdg 8 partnership for development, low- & middle- income countries
Table 8, mdg 8  partnership for development, low- & middle- income countriesTable 8, mdg 8  partnership for development, low- & middle- income countries
Table 8, mdg 8 partnership for development, low- & middle- income countries
 
Fact sheet industry facts iata
Fact sheet industry facts   iataFact sheet industry facts   iata
Fact sheet industry facts iata
 
ธนาคารกสิกรไทย
ธนาคารกสิกรไทย ธนาคารกสิกรไทย
ธนาคารกสิกรไทย
 
Analisis Horta Guinardo 2008 03 10
Analisis Horta Guinardo 2008 03 10Analisis Horta Guinardo 2008 03 10
Analisis Horta Guinardo 2008 03 10
 
Fdi & Fii Final
Fdi & Fii  FinalFdi & Fii  Final
Fdi & Fii Final
 
Debt indicators of Turkey
Debt indicators of TurkeyDebt indicators of Turkey
Debt indicators of Turkey
 
3Q14 Results Presentation
3Q14 Results Presentation3Q14 Results Presentation
3Q14 Results Presentation
 
Container Transportation 2009 2010
Container Transportation 2009 2010Container Transportation 2009 2010
Container Transportation 2009 2010
 
моделирование спроса на услуги контейнерного терминала
моделирование спроса на услуги контейнерного терминаламоделирование спроса на услуги контейнерного терминала
моделирование спроса на услуги контейнерного терминала
 
2010-2013 Semiconductor Market Forecast Seizing the economic & political ...
2010-2013 Semiconductor Market Forecast Seizing the economic & political ...2010-2013 Semiconductor Market Forecast Seizing the economic & political ...
2010-2013 Semiconductor Market Forecast Seizing the economic & political ...
 
4Q12 Presentation
4Q12 Presentation4Q12 Presentation
4Q12 Presentation
 
Traffic Tracker
Traffic TrackerTraffic Tracker
Traffic Tracker
 
اثر اتفاقية اغادير على الميزان التجارى بين مصر ودول الاتفاقية
اثر اتفاقية اغادير على الميزان التجارى بين مصر ودول الاتفاقيةاثر اتفاقية اغادير على الميزان التجارى بين مصر ودول الاتفاقية
اثر اتفاقية اغادير على الميزان التجارى بين مصر ودول الاتفاقية
 
Key+tyre+industry+figures+2012
Key+tyre+industry+figures+2012Key+tyre+industry+figures+2012
Key+tyre+industry+figures+2012
 
When Micromobility Attacks
When Micromobility AttacksWhen Micromobility Attacks
When Micromobility Attacks
 
Pr 041010 aug_stats_final
Pr 041010 aug_stats_finalPr 041010 aug_stats_final
Pr 041010 aug_stats_final
 
73 76
73 7673 76
73 76
 
UNCTAD - Country fact sheet report 2010 Malaysia
UNCTAD -  Country fact sheet report 2010 MalaysiaUNCTAD -  Country fact sheet report 2010 Malaysia
UNCTAD - Country fact sheet report 2010 Malaysia
 

More from Gianfranco Conti

Deloitte Football Money League 2013
Deloitte Football Money League 2013Deloitte Football Money League 2013
Deloitte Football Money League 2013
Gianfranco Conti
 
Presentazione - ANALISI DI PATTERN DI SICUREZZA PER APPLICAZIONI BASATE SU SE...
Presentazione - ANALISI DI PATTERN DI SICUREZZA PER APPLICAZIONI BASATE SU SE...Presentazione - ANALISI DI PATTERN DI SICUREZZA PER APPLICAZIONI BASATE SU SE...
Presentazione - ANALISI DI PATTERN DI SICUREZZA PER APPLICAZIONI BASATE SU SE...Gianfranco Conti
 
AEROPORTO DI MILANO MALPENSA NUOVO “MASTER PLAN AEROPORTUALE”
AEROPORTO DI MILANO MALPENSA NUOVO “MASTER PLAN AEROPORTUALE”AEROPORTO DI MILANO MALPENSA NUOVO “MASTER PLAN AEROPORTUALE”
AEROPORTO DI MILANO MALPENSA NUOVO “MASTER PLAN AEROPORTUALE”
Gianfranco Conti
 
Sicurezza-delle-centrali-nucleare-intervista-ing-v-romanello
Sicurezza-delle-centrali-nucleare-intervista-ing-v-romanelloSicurezza-delle-centrali-nucleare-intervista-ing-v-romanello
Sicurezza-delle-centrali-nucleare-intervista-ing-v-romanello
Gianfranco Conti
 
The Information Assurance Mission at NSA - Hardening Tips for Mac OS X 10.6 "...
The Information Assurance Mission at NSA - Hardening Tips for Mac OS X 10.6 "...The Information Assurance Mission at NSA - Hardening Tips for Mac OS X 10.6 "...
The Information Assurance Mission at NSA - Hardening Tips for Mac OS X 10.6 "...
Gianfranco Conti
 
Libro "Bianca" TG3 - La zarina fa, ma non si dice
Libro "Bianca" TG3 - La zarina fa, ma non si diceLibro "Bianca" TG3 - La zarina fa, ma non si dice
Libro "Bianca" TG3 - La zarina fa, ma non si diceGianfranco Conti
 
Aci airport traffic report february 2011
Aci airport traffic report   february 2011Aci airport traffic report   february 2011
Aci airport traffic report february 2011Gianfranco Conti
 
Contratto di programma ENAC - SEA Piano Investimenti 2011 - 8 febbraio 2011
Contratto di programma ENAC - SEA Piano Investimenti 2011 - 8 febbraio 2011Contratto di programma ENAC - SEA Piano Investimenti 2011 - 8 febbraio 2011
Contratto di programma ENAC - SEA Piano Investimenti 2011 - 8 febbraio 2011
Gianfranco Conti
 
Mxp schede c_d_parte_prima
Mxp schede c_d_parte_primaMxp schede c_d_parte_prima
Mxp schede c_d_parte_primaGianfranco Conti
 
Mxp schede c_d_parte_terza
Mxp schede c_d_parte_terzaMxp schede c_d_parte_terza
Mxp schede c_d_parte_terzaGianfranco Conti
 
Mxp schede c_d_parte_seconda
Mxp schede c_d_parte_secondaMxp schede c_d_parte_seconda
Mxp schede c_d_parte_secondaGianfranco Conti
 
Programma lavori interventi_mxp
Programma lavori interventi_mxpProgramma lavori interventi_mxp
Programma lavori interventi_mxpGianfranco Conti
 
12 estadisticas diciembre_2010
12 estadisticas diciembre_201012 estadisticas diciembre_2010
12 estadisticas diciembre_2010
Gianfranco Conti
 
Pr 061210 october_2010_stats_final
Pr 061210 october_2010_stats_finalPr 061210 october_2010_stats_final
Pr 061210 october_2010_stats_finalGianfranco Conti
 
Pr 050111 november_stats_final
Pr 050111 november_stats_finalPr 050111 november_stats_final
Pr 050111 november_stats_finalGianfranco Conti
 
Ballondor award men_player_finalx
Ballondor award men_player_finalxBallondor award men_player_finalx
Ballondor award men_player_finalx
Gianfranco Conti
 
Dati di traffico_2009_completa
Dati di traffico_2009_completaDati di traffico_2009_completa
Dati di traffico_2009_completa
Gianfranco Conti
 

More from Gianfranco Conti (20)

Deloitte Football Money League 2013
Deloitte Football Money League 2013Deloitte Football Money League 2013
Deloitte Football Money League 2013
 
Presentazione - ANALISI DI PATTERN DI SICUREZZA PER APPLICAZIONI BASATE SU SE...
Presentazione - ANALISI DI PATTERN DI SICUREZZA PER APPLICAZIONI BASATE SU SE...Presentazione - ANALISI DI PATTERN DI SICUREZZA PER APPLICAZIONI BASATE SU SE...
Presentazione - ANALISI DI PATTERN DI SICUREZZA PER APPLICAZIONI BASATE SU SE...
 
AEROPORTO DI MILANO MALPENSA NUOVO “MASTER PLAN AEROPORTUALE”
AEROPORTO DI MILANO MALPENSA NUOVO “MASTER PLAN AEROPORTUALE”AEROPORTO DI MILANO MALPENSA NUOVO “MASTER PLAN AEROPORTUALE”
AEROPORTO DI MILANO MALPENSA NUOVO “MASTER PLAN AEROPORTUALE”
 
Sicurezza-delle-centrali-nucleare-intervista-ing-v-romanello
Sicurezza-delle-centrali-nucleare-intervista-ing-v-romanelloSicurezza-delle-centrali-nucleare-intervista-ing-v-romanello
Sicurezza-delle-centrali-nucleare-intervista-ing-v-romanello
 
The Information Assurance Mission at NSA - Hardening Tips for Mac OS X 10.6 "...
The Information Assurance Mission at NSA - Hardening Tips for Mac OS X 10.6 "...The Information Assurance Mission at NSA - Hardening Tips for Mac OS X 10.6 "...
The Information Assurance Mission at NSA - Hardening Tips for Mac OS X 10.6 "...
 
Libro "Bianca" TG3 - La zarina fa, ma non si dice
Libro "Bianca" TG3 - La zarina fa, ma non si diceLibro "Bianca" TG3 - La zarina fa, ma non si dice
Libro "Bianca" TG3 - La zarina fa, ma non si dice
 
Aci airport traffic report february 2011
Aci airport traffic report   february 2011Aci airport traffic report   february 2011
Aci airport traffic report february 2011
 
Contratto di programma ENAC - SEA Piano Investimenti 2011 - 8 febbraio 2011
Contratto di programma ENAC - SEA Piano Investimenti 2011 - 8 febbraio 2011Contratto di programma ENAC - SEA Piano Investimenti 2011 - 8 febbraio 2011
Contratto di programma ENAC - SEA Piano Investimenti 2011 - 8 febbraio 2011
 
Mxp schede c_d_parte_prima
Mxp schede c_d_parte_primaMxp schede c_d_parte_prima
Mxp schede c_d_parte_prima
 
Mxp schede c_d_parte_terza
Mxp schede c_d_parte_terzaMxp schede c_d_parte_terza
Mxp schede c_d_parte_terza
 
Mxp schede c_d_parte_seconda
Mxp schede c_d_parte_secondaMxp schede c_d_parte_seconda
Mxp schede c_d_parte_seconda
 
Mxp scheda a
Mxp scheda aMxp scheda a
Mxp scheda a
 
Mxp relazione tecnica
Mxp relazione tecnicaMxp relazione tecnica
Mxp relazione tecnica
 
Programma lavori interventi_mxp
Programma lavori interventi_mxpProgramma lavori interventi_mxp
Programma lavori interventi_mxp
 
12 estadisticas diciembre_2010
12 estadisticas diciembre_201012 estadisticas diciembre_2010
12 estadisticas diciembre_2010
 
Apt paris 2010
Apt paris 2010Apt paris 2010
Apt paris 2010
 
Pr 061210 october_2010_stats_final
Pr 061210 october_2010_stats_finalPr 061210 october_2010_stats_final
Pr 061210 october_2010_stats_final
 
Pr 050111 november_stats_final
Pr 050111 november_stats_finalPr 050111 november_stats_final
Pr 050111 november_stats_final
 
Ballondor award men_player_finalx
Ballondor award men_player_finalxBallondor award men_player_finalx
Ballondor award men_player_finalx
 
Dati di traffico_2009_completa
Dati di traffico_2009_completaDati di traffico_2009_completa
Dati di traffico_2009_completa
 

Pr10 032

  • 1. This Press Release has not yet been released. Tables attached overleaf or download the data from the website -1-
  • 2. Traffic Update Scheduled Services of AEA Member Airlines JUNE 2010 PASSENGER DATA FREIGHT DATA Change to Previous Year REGION Passengers Traffic Capacity Load Traffic boarded RPK ASK Factor Pax Traffic Capacity PLF TFTK TFTK (000) (mill) (mill) % % % % Pts (mill) % Domestic (1) 8 449.2 4 473.0 6 421.4 69.7 0.6 0.9 0.9 0.0 7.7 -5.1 Cross-border Europe (2) 15 604.7 17 142.5 23 419.0 73.2 3.7 3.3 1.0 1.6 90.9 14.1 Total Europe (1+2) 24 053.9 21 615.4 29 840.4 72.4 2.6 2.8 1.0 1.2 98.6 12.3 Europe - North Africa (3) 433.0 835.8 1 208.4 69.2 8.0 6.3 0.9 3.5 17.3 -19.1 Europe - Middle East (4) 814.7 2 519.0 3 641.7 69.2 5.1 1.3 -5.1 4.4 97.4 -9.1 Intl Short/Medium Haul (2+3+4) 16 852.5 20 497.2 28 269.1 72.5 3.9 3.1 0.2 2.1 205.6 -1.2 North Atlantic (5) 2 659.9 18 362.5 20 559.7 89.3 0.6 1.1 -2.9 3.6 831.6 15.9 Mid Atlantic (6) 504.1 3 963.0 4 941.1 80.2 3.7 5.2 8.6 -2.6 131.1 21.5 South Atlantic (7) 468.8 4 198.4 4 916.0 85.4 9.6 8.5 1.5 5.5 226.8 22.0 Europe - Sub Saharan Africa (8) 729.4 4 731.1 6 070.2 77.9 9.4 10.0 8.6 1.0 261.4 0.9 Europe - Far East/Australasia (9) 1 550.2 12 622.5 15 030.7 84.0 10.3 10.4 0.8 7.3 1 183.4 9.5 Total Longhaul (5 to 9 x) 5 928.7 43 897.2 51 559.3 85.1 5.0 5.6 0.8 3.8 2 655.2 12.9 Total International (2 to 9 x) 22 781.2 64 394.4 79 828.4 80.7 4.2 4.8 0.6 3.2 2 860.8 11.8 x Total Scheduled (1 to 9 ) 31 230.4 68 867.4 86 249.8 79.8 3.2 4.6 0.6 3.0 2 868.5 11.7 JANUARY - JUNE 2010 PASSENGER DATA FREIGHT DATA Change to Previous Year REGION Passengers Traffic Capacity Load Traffic boarded RPK ASK Factor Pax Traffic Capacity PLF TFTK TFTK (000) (mill) (mill) % % % % Pts (mill) % Domestic (1) 43 850.5 23 027.1 35 303.8 65.2 -1.6 -1.7 -3.4 1.1 39.5 -11.2 Cross-border Europe (2) 77 231.7 83 367.9 123 741.0 67.4 -0.6 -0.6 -3.6 2.1 482.5 9.4 Total Europe (1+2) 121 082.2 106 395.0 159 044.7 66.9 -1.0 -0.8 -3.6 1.9 522.1 7.5 Europe - North Africa (3) 2 365.3 4 695.6 7 001.1 67.1 6.8 6.4 3.4 1.9 111.1 -10.5 Europe - Middle East (4) 4 546.0 14 605.6 20 943.6 69.7 8.3 3.5 -0.9 3.0 579.0 1.8 Intl Short/Medium Haul (2+3+4) 84 143.0 102 669.0 151 685.5 67.7 0.1 0.3 -3.0 2.2 1 172.6 3.4 North Atlantic (5) 12 416.4 85 921.3 104 424.9 82.3 -1.7 -1.2 -6.0 4.0 4 663.4 10.3 Mid Atlantic (6) 3 197.2 24 721.0 30 007.7 82.4 -0.2 2.1 1.0 0.9 820.6 24.6 South Atlantic (7) 2 811.1 25 316.2 30 093.0 84.1 7.9 8.2 -1.0 7.2 1 262.8 21.2 Europe - Sub Saharan Africa (8) 4 116.2 26 960.9 35 721.6 75.5 1.3 0.2 1.0 -0.6 1 551.0 -1.5 Europe - Far East/Australasia (9) 8 680.0 70 585.1 85 998.2 82.1 1.3 0.9 -5.2 5.0 6 602.2 8.8 x Total Longhaul (5 to 9 ) 31 336.9 233 643.3 286 490.4 81.6 0.5 0.9 -3.7 3.7 14 956.7 10.2 Total International (2 to 9 x) 115 479.8 336 312.3 438 175.9 76.8 0.2 0.7 -3.4 3.2 16 129.3 9.7 x Total Scheduled (1 to 9 ) 159 330.3 359 339.4 473 479.8 75.9 -0.3 0.6 -3.4 3.0 16 168.8 9.6 Passenger traffic is measured in Passengers boarded (Pax), RPK (Revenue Passenger-Kms) and capacity in ASK (Available Seat-Kms). Freight traffic is measured in TFTK (Total Freight Tonne-Kms) on passenger and all-cargo services, excluding mail. Growth rates have been adjusted for changes in membership. Introduced in 2004, new route area Total Europe includes 'international' or Cross-border Europe services and Domestic services. (x) Longhaul region 'Other' is not shown above, but is included in the total. 09/09/2010
  • 3. Traffic Update TOTAL SCHEDULED Scheduled Services by Airline JUNE 2010 PASSENGER DATA FREIGHT DATA Change to Previous Year AIRLINE Passengers Traffic Capacity Load Traffic boarded RPK ASK Factor Pax Traffic Capacity PLF TFTK TFTK (000) (mill) (mill) % % % % Pts (mill) % A3 - AEGEAN AIRLINES 485.4 417.4 600.0 69.6 -16.7 -2.3 -2.1 -0.1 1.0 22.5 AF - AIR FRANCE 4 335.5 10 987.0 13 374.8 82.1 0.1 2.4 -1.2 2.9 401.6 -2.7 AY - FINNAIR 541.4 1 432.0 1 883.3 76.0 2.2 11.6 5.8 4.0 66.5 70.1 AZ - ALITALIA 2 095.0 2 982.2 4 131.6 72.2 7.5 16.7 6.8 6.1 39.1 35.9 BA - BRITISH AIRWAYS PLC 2 556.1 8 776.4 11 328.6 77.5 -12.5 -11.1 -8.5 -2.3 385.7 8.1 BD - BMI 592.7 662.5 963.9 68.7 -11.4 -16.7 -14.4 -1.9 4.6 -45.2 BT - AIRBALTIC 334.1 384.8 539.2 71.4 32.6 37.9 36.4 0.8 35.1 38.0 CV - CARGOLUX 0.0 0.0 0.0 0.0 0.0 0.0 0.0 0.0 414.6 13.4 CY - CYPRUS AIRWAYS 147.5 280.7 403.7 69.5 4.1 0.5 0.8 -0.2 2.6 8.2 FI - ICELANDAIR 174.1 492.0 615.5 79.9 15.3 23.5 18.4 3.3 0.0 0.0 IB - IBERIA 1 756.2 4 436.9 5 203.3 85.3 -4.9 2.1 -0.6 2.2 93.8 38.3 JP - ADRIA AIRWAYS 92.8 84.8 124.7 68.0 2.6 0.5 -11.3 8.0 0.1 2.9 JU - JAT AIRWAYS 87.4 88.7 144.1 61.6 -2.3 -0.4 -10.6 6.3 0.2 51.1 KL - KLM ROYAL DUTCH AIRLINES 2 053.0 6 749.6 7 789.7 86.6 6.2 9.7 3.4 4.9 305.4 -13.2 KM - AIR MALTA 166.1 231.6 342.6 67.6 5.3 4.4 -2.0 4.1 0.6 -14.4 LG - LUXAIR 66.5 38.6 61.4 62.8 -2.0 -15.5 -13.0 -1.9 0.0 -100.0 LH - DEUTSCHE LUFTHANSA AG 5 330.8 11 915.2 14 264.1 83.5 12.7 9.9 2.3 5.7 669.2 16.0 LO - LOT POLISH AIRLINES 381.7 721.1 905.8 79.6 7.7 9.1 4.5 3.3 7.4 58.6 LX - SWISS INTERNATIONAL AIRLINES 1 209.3 2 586.1 3 057.6 84.6 -2.1 10.6 8.2 1.8 110.4 33.3 MA - MALEV HUNGARIAN AIRLINES 282.5 322.3 455.9 70.7 -5.3 -2.1 -5.7 2.6 0.5 64.7 OA - OLYMPIC AIR 385.9 262.3 406.9 64.5 0.0 0.0 0.0 0.0 0.5 0.0 OK - CZECH AIRLINES 403.3 458.3 672.8 68.1 -5.0 -16.0 -18.2 1.9 1.6 -11.1 OS - AUSTRIAN 936.7 1 466.5 1 846.8 79.4 25.5 17.9 6.4 7.8 20.9 -32.1 OU - CROATIA AIRLINES 162.0 112.2 175.3 64.0 -6.6 -10.0 -5.5 -3.2 0.1 -5.4 PS - UKRAINE INTERNATIONAL AIRLINES 91.9 154.9 285.1 54.3 31.1 31.6 47.2 -6.4 1.0 34.1 RO - TAROM ROMANIAN AIR TRANSPORT 175.9 205.1 330.5 62.1 26.5 22.8 11.2 5.8 0.3 -2.1 SK - SAS SCANDINAVIAN AIRLINES 2 081.4 2 298.3 2 857.3 80.4 -1.5 -1.1 -5.1 3.3 40.3 64.7 SN - BRUSSELS AIRLINES 447.9 629.2 980.9 64.1 3.6 2.8 1.7 0.7 9.1 16.4 TK - TURKISH AIRLINES 2 468.7 3 908.4 5 292.2 73.9 13.7 18.5 13.6 3.0 83.6 62.8 TP - TAP PORTUGAL 759.3 1 987.5 2 766.0 71.9 13.9 24.8 22.3 1.5 33.3 57.0 VS - VIRGIN ATLANTIC AIRWAYS 485.5 3 472.2 3 968.9 87.5 5.4 4.6 -2.6 6.0 134.4 38.6 VV - AEROSVIT 143.7 322.7 477.6 67.6 13.6 9.6 13.8 -2.6 4.8 57.7 AEA 31 230.4 68 867.4 86 249.8 79.8 3.2 4.6 0.6 3.0 2 868.5 11.7 Passenger traffic is measured in Passengers boarded, RPK (Revenue Passenger-Kms) and capacity in ASK (Available Seat-Kms). Freight traffic is measured in TFTK (Total Freight Tonne-Kms) on passenger and all-cargo services, excluding mail. Growth rates have been adjusted for changes in membership. * Estimated Data 09/09/2010
  • 4. Traffic Update TOTAL SCHEDULED Scheduled Services by Airline JANUARY - JUNE 2010 PASSENGER DATA FREIGHT DATA Change to Previous Year AIRLINE Passengers Traffic Capacity Load Traffic boarded RPK ASK Factor Pax Traffic Capacity PLF TFTK TFTK (000) (mill) (mill) % % % % Pts (mill) % A3 - AEGEAN AIRLINES 2 728.4 2 242.4 3 571.0 62.8 1.2 13.4 8.5 2.7 7.2 21.9 AF - AIR FRANCE 22 327.6 59 146.0 74 822.6 79.0 -3.9 -2.4 -5.6 2.6 2 280.8 -2.3 AY - FINNAIR 2 971.1 7 784.4 10 414.7 74.7 -1.9 4.4 -1.3 4.1 315.8 48.1 AZ - ALITALIA 10 612.3 15 097.7 22 187.8 68.0 3.1 14.1 -1.4 9.3 205.8 52.5 BA - BRITISH AIRWAYS PLC 13 555.2 48 150.0 64 684.6 74.4 -12.7 -10.9 -9.8 -0.9 2 181.4 5.5 BD - BMI 2 823.6 3 059.6 4 835.0 63.3 -22.4 -26.0 -21.6 -3.7 33.0 -14.7 BT - AIRBALTIC 1 452.1 1 599.3 2 472.9 64.7 21.7 23.2 22.2 0.5 146.9 23.4 CV - CARGOLUX 0.0 0.0 0.0 0.0 0.0 0.0 0.0 0.0 2 361.2 3.1 CY - CYPRUS AIRWAYS 685.5 1 296.0 1 990.4 65.1 -5.4 -8.0 -5.4 -1.8 15.2 -19.0 FI - ICELANDAIR 589.1 1 591.7 2 186.0 72.8 9.8 15.4 13.0 1.5 0.0 0.0 IB - IBERIA 9 568.0 24 232.7 29 665.6 81.7 -6.1 -1.0 -4.4 2.8 569.6 43.8 JP - ADRIA AIRWAYS 433.6 391.9 623.3 62.9 -2.6 -3.5 -12.5 5.9 0.7 -2.7 JU - JAT AIRWAYS 418.3 431.4 768.0 56.2 0.0 0.4 -6.0 3.6 1.0 0.3 KL - KLM ROYAL DUTCH AIRLINES 10 624.3 35 812.5 43 637.7 82.1 -0.3 2.8 -1.4 3.3 1 911.1 -4.3 KM - AIR MALTA 741.2 982.3 1 488.2 66.0 3.0 3.6 -0.3 2.5 3.5 5.7 LG - LUXAIR 346.1 204.3 357.9 57.1 -1.5 -5.8 -4.1 -1.0 0.0 -91.7 LH - DEUTSCHE LUFTHANSA AG 26 137.4 59 811.0 76 694.9 78.0 2.5 3.4 -0.3 2.8 3 580.6 14.4 LO - LOT POLISH AIRLINES 1 811.1 2 886.1 3 982.1 72.5 8.1 9.4 1.0 5.5 34.1 31.5 LX - SWISS INTERNATIONAL AIRLINES 6 572.4 13 695.8 17 088.6 80.1 2.0 5.2 -0.4 4.3 647.0 23.6 MA - MALEV HUNGARIAN AIRLINES 1 304.9 1 452.9 2 254.7 64.4 -5.0 -2.4 -10.9 5.6 2.6 51.6 OA - OLYMPIC AIR 2 144.6 1 526.7 2 440.0 62.6 0.0 0.0 0.0 0.0 2.9 0.0 OK - CZECH AIRLINES 2 135.3 2 375.3 3 609.7 65.8 2.5 -5.2 -14.9 6.7 8.7 -25.8 OS - AUSTRIAN 4 539.2 7 423.3 9 935.4 74.7 14.6 8.6 1.7 4.7 142.4 -12.4 OU - CROATIA AIRLINES 695.2 454.8 803.2 56.6 -8.4 -8.9 -9.9 0.6 0.8 -22.4 PS - UKRAINE INTERNATIONAL AIRLINES 414.0 772.5 1 361.4 56.7 18.4 28.5 22.4 2.7 5.5 20.9 RO - TAROM ROMANIAN AIR TRANSPORT 904.7 1 059.7 1 829.2 57.9 31.4 34.0 12.0 9.5 1.5 -15.0 SK - SAS SCANDINAVIAN AIRLINES 10 313.3 11 074.9 15 144.6 73.1 -4.8 -4.8 -10.4 4.3 201.7 35.8 SN - BRUSSELS AIRLINES 2 257.8 3 246.7 5 390.4 60.2 1.1 1.9 1.0 0.6 52.1 13.7 TK - TURKISH AIRLINES 13 079.7 21 231.8 29 621.8 71.7 18.7 25.9 19.7 3.5 496.4 72.1 TP - TAP PORTUGAL 4 072.8 10 780.1 15 161.2 71.1 5.7 15.1 4.2 6.8 179.3 36.3 VS - VIRGIN ATLANTIC AIRWAYS 2 509.8 18 157.7 22 406.4 81.0 -4.7 -5.5 -11.4 5.1 755.3 23.3 VV - AEROSVIT 561.8 1 368.1 2 050.7 66.7 -11.6 -13.0 -13.9 0.7 24.7 41.8 AEA 159 330.3 359 339.4 473 479.8 75.9 -0.3 0.6 -3.4 3.0 16 168.8 9.6 Passenger traffic is measured in Passengers boarded, RPK (Revenue Passenger-Kms) and capacity in ASK (Available Seat-Kms). Freight traffic is measured in TFTK (Total Freight Tonne-Kms) on passenger and all-cargo services, excluding mail. Growth rates have been adjusted for changes in membership. * Estimated Data 09/09/2010
  • 5. Traffic Update Scheduled Services of AEA Member Airlines JULY 2010 PASSENGER DATA FREIGHT DATA Change to Previous Year REGION Passengers Traffic Capacity Load Traffic boarded RPK ASK Factor Pax Traffic Capacity PLF TFTK TFTK (000) (mill) (mill) % % % % Pts (mill) % Domestic (1) 8 710.0 4 747.2 6 451.5 73.6 3.2 4.0 1.7 1.6 6.6 -14.0 Cross-border Europe (2) 17 121.4 19 377.7 24 805.8 78.1 5.3 4.7 3.0 1.3 96.2 11.4 Total Europe (1+2) 25 831.4 24 124.9 31 257.3 77.2 4.6 4.6 2.7 1.4 102.8 9.3 Europe - North Africa (3) 555.4 1 069.1 1 333.7 80.2 9.4 7.3 2.1 3.9 14.9 -6.8 Europe - Middle East (4) 1 035.7 3 196.2 4 018.6 79.5 9.2 6.2 0.2 4.5 104.2 -3.3 Intl Short/Medium Haul (2+3+4) 18 712.6 23 643.0 30 158.1 78.4 5.6 5.0 2.6 1.8 215.3 2.4 North Atlantic (5) 2 862.8 19 719.3 22 157.6 89.0 0.4 0.7 -0.8 1.3 849.6 13.4 Mid Atlantic (6) 631.2 4 917.5 5 704.8 86.2 7.1 8.1 7.3 0.6 137.1 18.2 South Atlantic (7) 542.6 4 811.8 5 415.5 88.9 6.5 5.7 0.1 4.7 211.9 12.7 Europe - Sub Saharan Africa (8) 855.0 5 447.3 6 589.6 82.7 7.1 5.5 6.4 -0.7 246.3 -4.5 Europe - Far East/Australasia (9) 1 703.5 13 839.1 15 897.8 87.1 5.3 4.3 0.5 3.1 1 208.5 8.0 Total Longhaul (5 to 9 x) 6 622.1 48 768.4 55 815.8 87.4 3.5 3.4 1.3 1.8 2 690.5 10.7 Total International (2 to 9 x) 25 334.6 72 411.4 85 973.8 84.2 5.0 3.9 1.7 1.8 2 905.8 10.1 x Total Scheduled (1 to 9 ) 34 044.6 77 158.6 92 425.3 83.5 4.6 3.9 1.7 1.8 2 912.4 10.0 JANUARY - JULY 2010 PASSENGER DATA FREIGHT DATA Change to Previous Year REGION Passengers Traffic Capacity Load Traffic boarded RPK ASK Factor Pax Traffic Capacity PLF TFTK TFTK (000) (mill) (mill) % % % % Pts (mill) % Domestic (1) 52 560.5 27 774.3 41 755.3 66.5 -0.9 -0.8 -2.7 1.3 46.1 -11.6 Cross-border Europe (2) 94 353.1 102 745.6 148 546.7 69.2 0.4 0.4 -2.6 2.0 578.7 9.7 Total Europe (1+2) 146 913.6 130 519.9 190 302.0 68.6 0.0 0.2 -2.6 1.9 624.9 7.8 Europe - North Africa (3) 2 920.7 5 764.7 8 334.7 69.2 7.3 6.6 3.2 2.2 126.1 -10.0 Europe - Middle East (4) 5 581.7 17 801.8 24 962.2 71.3 8.5 4.0 -0.7 3.2 683.1 1.0 Intl Short/Medium Haul (2+3+4) 102 855.5 126 312.0 181 843.5 69.5 1.0 1.2 -2.1 2.2 1 387.9 3.3 North Atlantic (5) 15 279.3 105 640.6 126 582.4 83.5 -1.3 -0.8 -5.1 3.6 5 513.0 10.8 Mid Atlantic (6) 3 828.4 29 638.5 35 712.4 83.0 0.9 3.1 2.0 0.9 957.8 23.6 South Atlantic (7) 3 353.7 30 128.0 35 508.5 84.8 7.7 7.8 -0.8 6.8 1 474.7 19.9 Europe - Sub Saharan Africa (8) 4 971.2 32 408.1 42 311.2 76.6 2.3 1.1 1.8 -0.6 1 797.4 -1.9 Europe - Far East/Australasia (9) 10 383.4 84 424.2 101 895.9 82.9 1.9 1.4 -4.3 4.7 7 810.7 8.7 x Total Longhaul (5 to 9 ) 37 958.9 282 411.7 342 306.2 82.5 1.0 1.3 -2.9 3.5 17 647.1 10.3 Total International (2 to 9 x) 140 814.4 408 723.7 524 149.8 78.0 1.0 1.3 -2.6 3.0 19 035.1 9.8 x Total Scheduled (1 to 9 ) 193 374.9 436 498.0 565 905.1 77.1 0.5 1.1 -2.6 2.9 19 081.2 9.7 Passenger traffic is measured in Passengers boarded (Pax), RPK (Revenue Passenger-Kms) and capacity in ASK (Available Seat-Kms). Freight traffic is measured in TFTK (Total Freight Tonne-Kms) on passenger and all-cargo services, excluding mail. Growth rates have been adjusted for changes in membership. Introduced in 2004, new route area Total Europe includes 'international' or Cross-border Europe services and Domestic services. (x) Longhaul region 'Other' is not shown above, but is included in the total. 08/09/2010
  • 6. Traffic Update TOTAL SCHEDULED Scheduled Services by Airline JULY 2010 PASSENGER DATA FREIGHT DATA Change to Previous Year AIRLINE Passengers Traffic Capacity Load Traffic boarded RPK ASK Factor Pax Traffic Capacity PLF TFTK TFTK (000) (mill) (mill) % % % % Pts (mill) % A3 - AEGEAN AIRLINES 595.0 500.7 640.9 78.1 -8.7 1.5 -0.7 1.7 1.1 8.0 AF - AIR FRANCE 4 611.3 12 262.2 14 497.9 84.6 -0.1 0.1 -0.7 0.7 419.1 2.4 AY - FINNAIR 542.3 1 562.3 1 930.4 80.9 -3.9 2.7 2.9 -0.2 69.9 69.0 AZ - ALITALIA 2 399.0 3 276.4 4 336.4 75.6 8.6 12.7 8.2 3.1 33.6 19.7 BA - BRITISH AIRWAYS PLC 3 189.3 10 507.8 12 506.6 84.0 -0.4 -2.6 -1.9 -0.7 387.9 4.3 BD - BMI 621.5 742.9 1 013.2 73.3 -15.8 -18.3 -14.8 -3.2 4.9 -34.7 BT - AIRBALTIC 362.1 431.6 572.6 75.4 24.7 28.0 28.5 -0.3 39.3 28.2 CV - CARGOLUX 0.0 0.0 0.0 0.0 0.0 0.0 0.0 0.0 424.2 13.1 CY - CYPRUS AIRWAYS 185.1 344.6 420.7 81.9 11.4 5.0 -0.5 4.3 3.1 5.5 FI - ICELANDAIR 215.5 601.2 698.9 86.0 12.5 18.9 14.2 3.4 0.0 0.0 IB - IBERIA 1 897.3 4 966.4 5 682.2 87.4 -4.8 5.2 2.0 2.6 93.0 21.4 JP - ADRIA AIRWAYS 112.1 106.1 146.5 72.4 16.8 16.0 3.0 8.1 0.1 -8.7 JU - JAT AIRWAYS 122.9 122.9 174.4 70.5 4.8 2.5 -4.1 4.5 0.2 1.3 KL - KLM ROYAL DUTCH AIRLINES 2 186.6 7 246.3 8 134.2 89.1 1.9 3.4 1.3 1.8 317.0 -11.3 KM - AIR MALTA 203.3 275.2 381.0 72.2 5.1 3.6 0.9 1.9 0.6 -5.4 LG - LUXAIR 65.5 39.6 62.2 63.7 -8.1 -20.0 -15.4 -3.7 0.0 -100.0 LH - DEUTSCHE LUFTHANSA AG 5 540.9 12 871.6 15 140.3 85.0 11.2 6.9 4.5 1.9 658.4 11.6 LO - LOT POLISH AIRLINES 412.1 802.2 984.5 81.5 12.4 7.5 5.8 1.3 8.5 79.7 LX - SWISS INTERNATIONAL AIRLINES 1 315.2 2 790.6 3 199.7 87.2 5.3 9.7 8.7 0.8 114.6 36.3 MA - MALEV HUNGARIAN AIRLINES 324.3 371.8 471.2 78.9 -6.5 -4.7 -5.1 0.3 0.6 61.3 OA - OLYMPIC AIR 428.4 298.7 411.5 72.6 0.0 0.0 0.0 0.0 0.5 0.0 OK - CZECH AIRLINES 469.9 572.9 726.2 78.9 -1.9 -13.2 -19.8 6.0 1.6 -17.6 OS - AUSTRIAN 983.8 1 617.0 1 954.5 82.7 23.5 13.4 7.3 4.5 29.6 -9.2 OU - CROATIA AIRLINES 186.6 128.7 183.2 70.2 -7.8 -11.3 -9.0 -1.8 0.1 -17.7 PS - UKRAINE INTERNATIONAL AIRLINES 106.4 187.5 294.9 63.6 32.1 34.8 40.0 -2.5 1.1 41.6 RO - TAROM ROMANIAN AIR TRANSPORT 189.1 230.0 336.5 68.3 18.7 13.1 5.8 4.5 0.3 -7.0 SK - SAS SCANDINAVIAN AIRLINES 1 729.0 2 223.9 2 604.0 85.4 2.0 0.2 -0.9 0.9 40.9 95.1 SN - BRUSSELS AIRLINES 476.6 772.1 1 059.9 72.8 2.6 5.7 8.1 -1.7 7.0 20.2 TK - TURKISH AIRLINES 2 914.2 4 699.0 5 896.1 79.7 19.8 20.9 14.5 4.2 84.4 43.1 TP - TAP PORTUGAL 940.7 2 497.4 3 120.5 80.0 6.9 12.3 2.8 6.8 33.5 34.0 VS - VIRGIN ATLANTIC AIRWAYS 513.7 3 667.2 4 238.5 86.5 3.4 2.3 -5.1 6.3 131.5 16.3 VV - AEROSVIT 204.8 441.8 605.8 72.9 36.7 24.9 33.5 -5.0 5.9 94.7 AEA 34 044.6 77 158.6 92 425.3 83.5 4.6 3.9 1.7 1.8 2 912.4 10.0 Passenger traffic is measured in Passengers boarded, RPK (Revenue Passenger-Kms) and capacity in ASK (Available Seat-Kms). Freight traffic is measured in TFTK (Total Freight Tonne-Kms) on passenger and all-cargo services, excluding mail. Growth rates have been adjusted for changes in membership. * Estimated Data 08/09/2010
  • 7. Traffic Update TOTAL SCHEDULED Scheduled Services by Airline JANUARY - JULY 2010 PASSENGER DATA FREIGHT DATA Change to Previous Year AIRLINE Passengers Traffic Capacity Load Traffic boarded RPK ASK Factor Pax Traffic Capacity PLF TFTK TFTK (000) (mill) (mill) % % % % Pts (mill) % A3 - AEGEAN AIRLINES 3 323.4 2 743.1 4 211.9 65.1 -0.7 11.1 7.0 2.4 8.2 19.9 AF - AIR FRANCE 26 938.8 71 408.2 89 320.5 79.9 -3.3 -2.0 -4.8 2.3 2 699.9 -1.6 AY - FINNAIR 3 513.4 9 346.7 12 345.1 75.7 -2.2 4.1 -0.6 3.5 385.7 51.5 AZ - ALITALIA 13 011.3 18 374.1 26 524.1 69.3 4.1 13.9 0.0 8.4 239.4 46.9 BA - BRITISH AIRWAYS PLC 16 744.4 58 657.8 77 191.1 76.0 -10.6 -9.5 -8.6 -0.7 2 569.3 5.3 BD - BMI 3 445.1 3 802.6 5 848.2 65.0 -21.3 -24.6 -20.5 -3.5 37.9 -17.9 BT - AIRBALTIC 1 814.2 2 030.8 3 045.5 66.7 22.3 24.1 23.3 0.4 186.2 24.4 CV - CARGOLUX 0.0 0.0 0.0 0.0 0.0 0.0 0.0 0.0 2 785.3 4.5 CY - CYPRUS AIRWAYS 870.6 1 640.6 2 411.0 68.0 -2.2 -5.5 -4.6 -0.7 18.3 -15.6 FI - ICELANDAIR 804.6 2 192.9 2 884.8 76.0 10.5 16.3 13.3 2.0 0.0 0.0 IB - IBERIA 11 465.3 29 199.2 35 347.7 82.6 -5.9 0.0 -3.4 2.8 662.5 40.2 JP - ADRIA AIRWAYS 545.8 498.0 769.7 64.7 0.9 0.1 -10.0 6.5 0.9 -3.7 JU - JAT AIRWAYS 541.2 554.3 942.4 58.8 1.0 0.8 -5.6 3.8 1.2 0.4 KL - KLM ROYAL DUTCH AIRLINES 12 810.9 43 058.8 51 771.9 83.2 0.1 2.9 -0.9 3.1 2 228.1 -5.4 KM - AIR MALTA 944.5 1 257.6 1 869.2 67.3 3.5 3.6 -0.1 2.4 4.1 4.0 LG - LUXAIR 411.7 243.9 420.1 58.1 -2.6 -8.4 -6.0 -1.6 0.0 -93.3 LH - DEUTSCHE LUFTHANSA AG 31 678.3 72 682.6 91 835.2 79.1 3.9 4.0 0.4 2.7 4 239.0 14.0 LO - LOT POLISH AIRLINES 2 223.3 3 688.4 4 966.6 74.3 8.9 9.0 1.9 4.8 42.6 38.9 LX - SWISS INTERNATIONAL AIRLINES 7 887.7 16 486.4 20 288.3 81.3 2.5 6.0 1.0 3.8 761.6 25.4 MA - MALEV HUNGARIAN AIRLINES 1 629.2 1 824.7 2 725.9 66.9 -5.3 -2.9 -10.0 4.9 3.2 53.3 OA - OLYMPIC AIR 2 573.0 1 825.4 2 851.5 64.0 0.0 0.0 0.0 0.0 3.4 0.0 OK - CZECH AIRLINES 2 605.2 2 948.2 4 336.0 68.0 1.7 -6.8 -15.8 6.5 10.2 -24.6 OS - AUSTRIAN 5 522.9 9 040.3 11 889.9 76.0 16.1 9.4 2.6 4.7 172.0 -11.8 OU - CROATIA AIRLINES 881.8 583.4 986.4 59.1 -8.3 -9.5 -9.7 0.2 0.9 -21.7 PS - UKRAINE INTERNATIONAL AIRLINES 520.4 960.0 1 656.3 58.0 21.0 29.7 25.2 2.0 6.6 23.9 RO - TAROM ROMANIAN AIR TRANSPORT 1 093.8 1 289.7 2 165.7 59.5 29.0 29.8 11.0 8.6 1.8 -13.8 SK - SAS SCANDINAVIAN AIRLINES 12 042.3 13 298.7 17 748.7 74.9 -3.9 -4.0 -9.1 4.0 242.6 43.1 SN - BRUSSELS AIRLINES 2 734.5 4 018.7 6 450.3 62.3 1.3 2.6 2.1 0.3 59.2 14.4 TK - TURKISH AIRLINES 15 993.9 25 930.7 35 517.9 73.0 18.9 24.9 18.8 3.6 580.8 67.2 TP - TAP PORTUGAL 5 013.5 13 277.5 18 281.7 72.6 5.9 14.6 3.9 6.7 212.8 35.9 VS - VIRGIN ATLANTIC AIRWAYS 3 023.5 21 825.0 26 644.9 81.9 -3.4 -4.3 -10.5 5.3 886.8 22.2 VV - AEROSVIT 766.6 1 809.9 2 656.5 68.1 -2.4 -6.1 -6.3 0.2 30.6 49.7 AEA 193 374.9 436 498.0 565 905.1 77.1 0.5 1.1 -2.6 2.9 19 081.2 9.7 Passenger traffic is measured in Passengers boarded, RPK (Revenue Passenger-Kms) and capacity in ASK (Available Seat-Kms). Freight traffic is measured in TFTK (Total Freight Tonne-Kms) on passenger and all-cargo services, excluding mail. Growth rates have been adjusted for changes in membership. * Estimated Data 08/09/2010