This document is a worksheet about parallel and perpendicular lines. It contains questions about determining the slope of lines from their equations, identifying whether pairs of lines are parallel, perpendicular, or neither, and properties of parallel and perpendicular lines. The questions cover finding the slope and identifying relationships between lines from their equations in slope-intercept form, standard form, and word problems.
Future of Donations Report for peer reviewMartin Wilson
This report has been built following a roadmapping workshop held by the RNLI in May 2018. The aim of the work was to provide a critical path towards a world in which charities allow supporters to donate how, where and when they like.
We spend much of our time collecting and analyzing data. That data is only useful if it can be displayed in a meaningful, understandable way.
Yale professor Edward Tufte presented many ideas on how to effectively present data to an audience or end user.
In this session, I will explain some of Tufte's most important guidelines about data visualization and how you can apply those guidelines to your own data. You will learn what to include, what to remove, and what to avoid in your charts, graphs, maps and other images that represent data." "We spend much of our time collecting and analyzing data. That data is only useful if it can be displayed in a meaningful, understandable way.
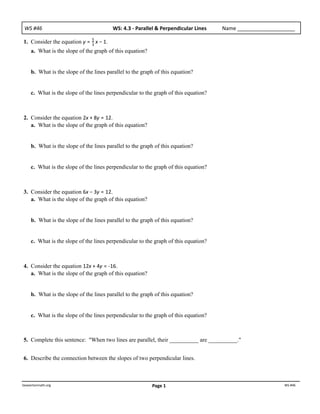
1. WS
#46 WS:
4.3
-‐
Parallel
&
Perpendicular
Lines Name
____________________
1. Consider the equation y = 5 x − 1.
3
a. What is the slope of the graph of this equation?
b. What is the slope of the lines parallel to the graph of this equation?
c. What is the slope of the lines perpendicular to the graph of this equation?
2. Consider the equation 2x + 8y = 12.
a. What is the slope of the graph of this equation?
b. What is the slope of the lines parallel to the graph of this equation?
c. What is the slope of the lines perpendicular to the graph of this equation?
3. Consider the equation 6x − 3y = 12.
a. What is the slope of the graph of this equation?
b. What is the slope of the lines parallel to the graph of this equation?
c. What is the slope of the lines perpendicular to the graph of this equation?
4. Consider the equation 12x + 4y = -‐16.
a. What is the slope of the graph of this equation?
b. What is the slope of the lines parallel to the graph of this equation?
c. What is the slope of the lines perpendicular to the graph of this equation?
5. Complete this sentence: "When two lines are parallel, their __________ are __________."
6. Describe the connection between the slopes of two perpendicular lines.
beavertonmath.org Page
1 WS
#46
2. Direc&ons:
State
whether
each
pair
of
equa&ons
has
graphs
that
are
parallel,
perpendicular,
or
neither.
Be
sure
to
show
your
work!
1.
y = 2 x + 6
3
3
2.
y = 2 x + 4 3
3.
y = 4 x + 2
y = − 2 x + 6
3
3
y = 2 x − 4
y = − 4 x − 2
3
4.
y = 3 x + 8 5.
y = 2x − 3 6.
y = 2x − 3
5
x + 2y = 3
− 2x − y = 6
5x + 3y = 18
7.
y = − 8 x − 6
3
8.
y = − 8 x − 6
3
9.
y = − 8 x − 6
3
8x + 3y = 42
3x − 8y = 40
6x − 16y = 48
10.
3x − 7y = 14 11.
3x − 7y = 14 12.
3x − 7y = 14
3x − 7y = -‐21
7x + 3y = 21
-‐3x + 7y = 21
beavertonmath.org Page
2 WS
#46