Download to read offline


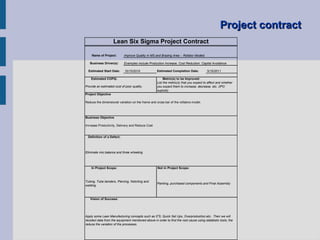
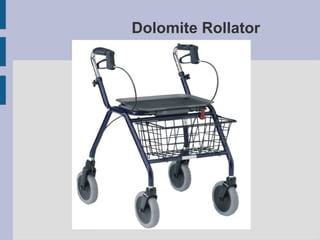
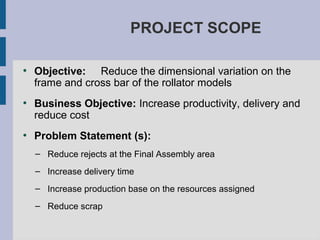
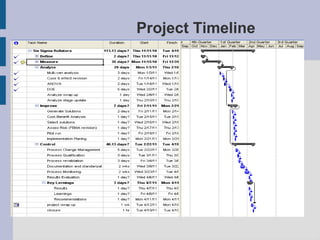
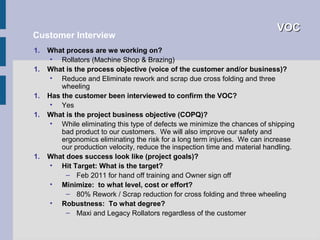
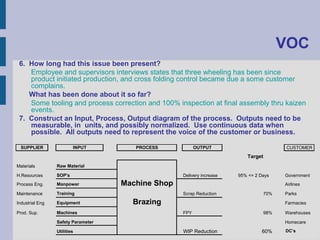

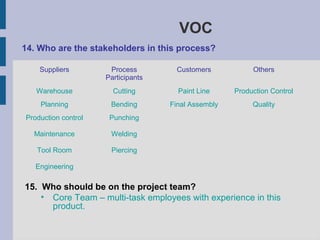

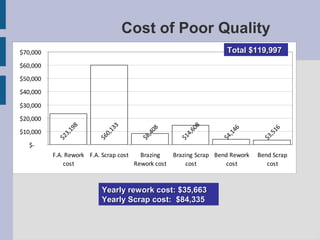
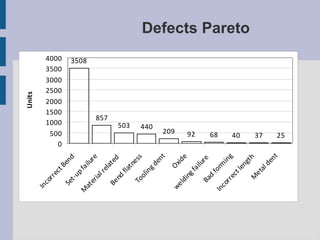


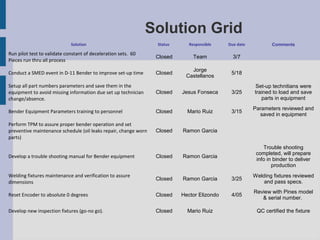
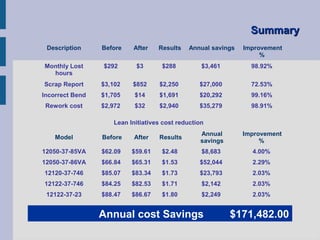


This document outlines a Lean Six Sigma project to improve quality in the machine shop and brazing area of a rollator manufacturing process. The project aims to reduce dimensional variation in rollator frames and crossbars to decrease defects like cross folding and three wheeling. Success would mean an 80% reduction in rework/scrap and meeting delivery, production, and WIP reduction targets. Baseline data on outputs like scrap rates is available but more data needs to be collected from the processes to understand the root causes of variation. Completing new process controls in 4-6 months seems feasible if required equipment investments are approved. Stakeholders include suppliers, various process areas, customers, and others.


