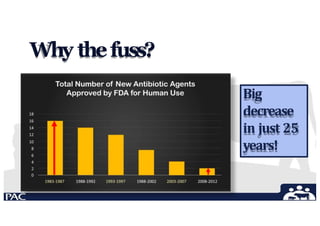
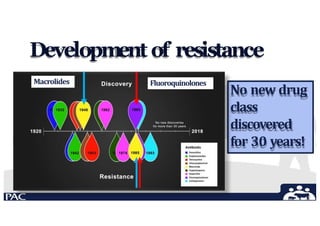
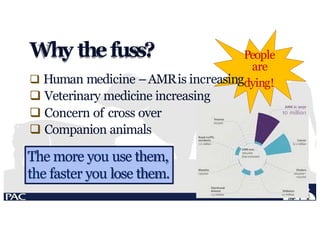
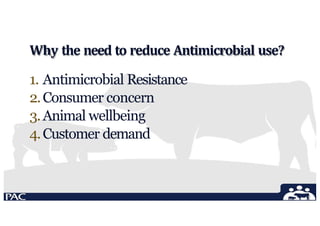
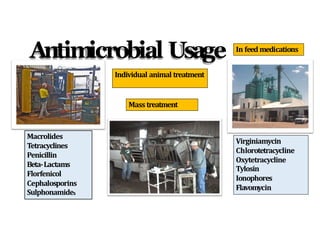
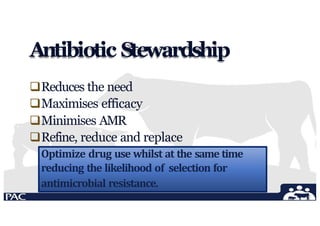
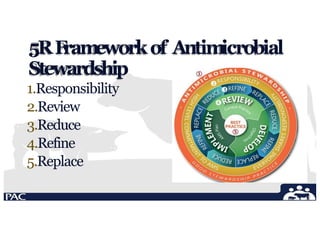
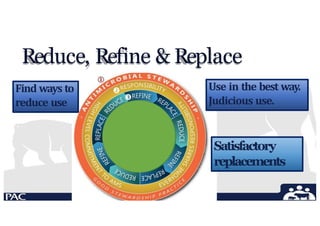
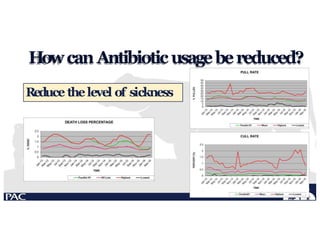
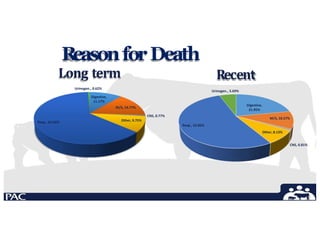
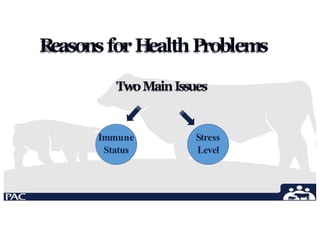
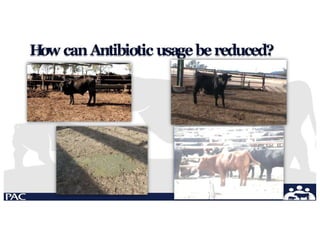
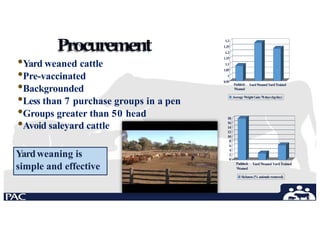
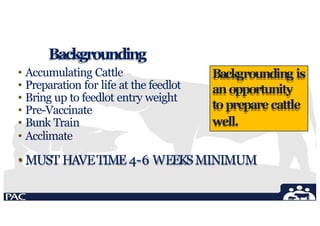
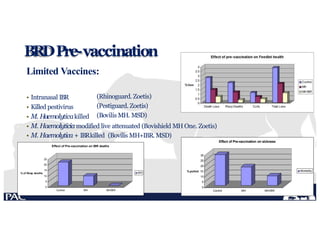
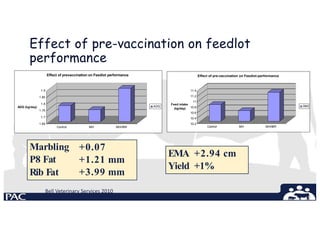
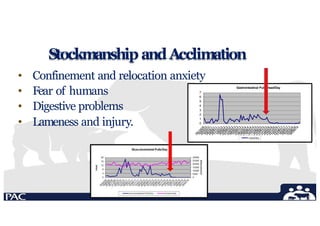
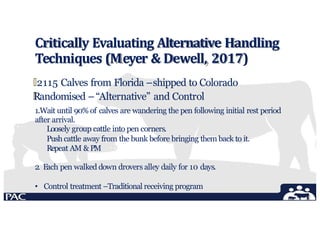
Futureviablestepstoreduce
antibiotic usageincommercial beef
production
FeedWorks Conference
Novotel Sunshine Coast Resort
15th – 16th September 2022
Dr Kev FSullivan BVSc
PAC Australia
Email: drkevsullivan@gmail.com
+61 499 313 115
Why thefuss?
Big
decrease
in just 25
years!
Development of resistance
No new drug
class
discovered
for 30 years!
Fluoroquinolones
Macrolides
feedlots.com.au
Why thefuss? People
are
 Human medicine –AMRis increasingdying!
 Veterinary medicine increasing
 Concern of cross over
 Companion animals
The more you use them,
the faster you lose them.
Antibiotics purchased mg/kg livestock biomass.
~20 mg/kg
~180 mg/kg
V
ery different
productionsystems
Figure 1. Percentage of Pasteurella multocida (n=118) and Mannheimia haemolytica (n=66) isolates classified
as resistant to selected antimicrobials determined by antimicrobial susceptibility testing, (X) showed n
Antimicrobial Resistance in
bacterial isolates from
Australian feedlots.
Why the need to reduce Antimicrobial use?
1. Antimicrobial Resistance
2.Consumer concern
3.Animal wellbeing
4.Customer demand
Antimicrobial Usage
Individual animal treatment
In feed medications
Mass treatment
Virginiamycin
Chlorotetracycline
Oxytetracycline
Tylosin
Ionophores
Flavomycin
Macrolides
Tetracyclines
Penicillin
Beta-Lactams
Florfenicol
Cephalosporins
Sulphonamides
Antibiotic Stewardship
Reduces the need
Maximises efficacy
Minimises AMR
Refine, reduce and replace
Optimize drug use whilst at the same time
reducing the likelihood of selection for
antimicrobial resistance.
5RF
rameworkof Antimicrobial
Stewardship
1.Responsibility
2.Review
3.Reduce
4.Refine
5.Replace
Reduce, Refine & Replace
Find ways to
reduce use
Use in the best way.
Judicious use.
Satisfactory
replacements
Howcan Antibioticusagebereduced?
Reduce thelevel of sickness
R
easonforDeath
Resp., 62.92%
Long term
Urinogen., 0.62%
Digestive,
11.17%
M/S, 14.77%
CNS, 0.77%
Other, 9.75%
Digestive,
21.95%
M/S, 10.57%
Other, 8.13%
CNS, 0.81%
Resp., 52.85%
Recent
Urinogen., 5.69%
R
easonsforH
ealthProblems
TwoMainIssues
Immune
Status
Stress
Level
H
ow canAntibiotic usagebereduced?
How can the level of disease be reduced?
1.
2.
3.
4.
5.
Procurement
Preparation
Stockmanship
Acclimation
Casedefinition
•Yard weaned cattle
•Pre-vaccinated
•Backgrounded
•Less than 7 purchase groups in a pen
•Groups greater than 50 head
•Avoid saleyard cattle
Procurement
1.3
1.25
1.2
1.15
1.1
1.05
1
0.95
Paddock
Weaned
YardWeaned YardTrained
Average WeightGain78days(kg/day)
18
16
14
12
10
8
6
4
2
0
Paddock
Weaned
YardWeaned YardTrained
Sickness (% animalsremoved)
Yardweaning is
simple and effective
Preparation
• Backgrounding
• Vaccination
Backgrounding
• Accumulating Cattle
• Preparation for life at the feedlot
• Bring up to feedlot entry weight
• Pre-Vaccinate
• Bunk Train
• Acclimate
• MUST HAVETIME 4-6 WEEKSMINIMUM
Backgrounding is
anopportunity
topreparecattle
well.
BRDPre-vaccination
Limited Vaccines:
• Intranasal IBR
• Killed pestivirus
• M. Haemolyticakilled
(Rhinoguard. Zoetis)
(Pestiguard. Zoetis)
(Bovilis MH. MSD)
• M. Haemolyticiamodified live attenuated (Bovishield MH One. Zoetis)
• M. Haemolytica+ IBRkilled (Bovilis MH+IBR. MSD)
10
5
0
25
20
15
% of Resp deaths
Control MH MH/IBR
Effect of Pre-vaccination on IBR deaths
IBR
30
25
20
% pulled 15
10
5
0
Control MH MH/IBR
Effect of Pre-vaccination on sickness
Morbidity
Effect of pre-vaccination on feedlot
performance
1.75
1.7
1.65
1.9
1.85
1.8
ADG (kg/day)
Control MH MH/IBR
Effect of prevaccination on Feedlot performance
ADG
11.4
11.2
11
10.8
10.6
10.4
10.2
Feed intake
(kg/day)
Control MH MH/IBR
Effect of pre-vaccination on Feedlot-performance
DMI
Bell Veterinary Services 2010
Marbling
P8 Fat
Rib Fat
+0.07
+1.21 mm
+3.99 mm
EMA +2.94 cm
Yield +1%
Stockmanship andAcclimation
• Confinement and relocation anxiety
• Fear of humans
• Digestive problems
• Lameness and injury.
Gastrointestinal Pulls Head/Day
7
6
5
4
3
2
1
0
Head/Day
Critically Evaluating Alternative Handling
Techniques (Meyer & Dewell, 2017)
🞄2115 Calves from Florida –shipped to Colorado
🞄
Randomised –“Alternative” and Control
1.Wait until 90% of calves are wandering the pen following initial rest period
after arrival.
Loosely group cattle into pen corners.
Push cattle away from the bunk before bringing them back to it.
Repeat AM & PM
2. Each pen walked down drovers alley daily for 10 days.
• Control treatment –Traditional receiving program
Impact of “Alternative”
Handling
🞄
7%
26%
21%
46%
Traditional Handling Mortality by
Diagnosis
BRD
GIT
M/S
Other
15%
0%
32%
53%
Alternative Handling Mortality by
Diagnosis
BRD
GIT
M/S
Other
Overall DL = 2.19% Overall DL = 1.19% (p = 0.08)
Overall R
esults
🞄Labour cost per head = $0.28/head
🞄Mortality cost = $10.86/head at close out
🞄$10.58 per head advantage –acclimated cattle have reliably
reduced digestive death loss.
Unloading Trucks
Less of this!
More of this!
Processing
Less of this!
More of these!
Welcome to the pen.
Show them the bunk,
the water, the bed.
Stay until they
have checked out
the pen and are
content with their
new home!!
Cattle eat,
ruminate and
chew cud
vigorously!
Cattle eat,
drink and rest
without anxiety.
.
Cattle are full,
hydrated, content
and confident.
Stress dissipated.
This is home !
Immune system
is competent.
Vaccines work
Treatments work.
Cas
es
tudy
3.50%
3.00%
2.50%
2.00%
1.50%
1.00%
0.50%
0.00%
1
5 5 6 6 6 6 6 7 7
09
1
0
1

1
0
4

1
0
6

1
0
9

1
1
2

1
0
3

1
0
5

1
Mortality
%
Death Loss
45.00%
40.00%
35.00%
30.00%
25.00%
20.00%
15.00%
10.00%
5.00%
0.00%
Morbidity
%
High Risk cattle
100% British
1.35%
22% Decrease
in Death Loss
1.03%
Morbidity (Pull Rate)
26.5% 16.7%
37% Decrease
in Pull Rate
0
5000
10000
15000
20000
0
1
2
3
4
5
6
Current
Head
Head
per
Day
Respiratory Death Loss Head/Day
Head/day Current Head
0
5000
10000
15000
20000
8
7
6
5
4
3
2
1
0
Current
Head
Head
per
day
Death Loss Total Head/Day
Date
Head/day Current Head
2.2
head/day
A 33% reduction
in death loss! 2.4
dead/day
1.3
dead/day
A 46% reduction in
respiratory deaths.
0
80
70
60
50
40
30
20
10
091209
290410
180111
200611
261111
310312
300612
201012
020313
080613
231113
050414
280614
291114
110415
180715
211115
160416
230716
031216
220417
260817
091217
050518
Head
Pulled
per
day
Respiratory pulls
6
5
4
3
2
1
0
7
091209
290410
180111
200611
261111
310312
300612
201012
020313
080613
231113
050414
280614
291114
110415
180715
211115
160416
230716
031216
220417
260817
091217
050518
Head
per
Day
Digestive Pulls
42
pulls/day
20
pulls/day
8
pulls/wk
0.5
pulls/wk
52% Reduction in
Respiratory Pulls
94% reduction in
Digestive Pulls
Morbidity
0.00%
1.00%
0.50%
2.00%
1.50%
2.50%
15010
6
11050
6
18090
6
19010
7
200507
16120
7
280608
17110
8
240409
031209
280410
050910
280211
170711
150212
180612
18121
2
280413
220913
31011
4
300614
23101
4
230215
250615
15101
5
030316
140716
20101
6
020317
060717
05101
7
25011
8
100518
270918
24011
9
300519
260919
Death Loss
Total 0-120
35.00%
30.00%
25.00%
20.00%
15.00%
10.00%
5.00%
0.00%
15010
6
11050
6
18090
6
19010
7
200507
16120
7
280608
17110
8
240409
031209
280410
050910
280211
170711
150212
180612
18121
2
280413
220913
31011
4
300614
23101
4
230215
250615
15101
5
030316
140716
20101
6
020317
060717
05101
Pull Rate
Total 0-120
Use of Autogenous
vaccine plus correct
timing and
preparation on
feedlot health.
0.95% 0.51%
12.79%
7.12%
Casedefinition
• 10-30% of pulls do not have BRD
• High correlation between lung
score and CFR. (79.8%)
Whisper Stethoscope technology
Ultrasound technology
Lung score and Temperature.
0.0
10.0
15.0
LS5
Percent
LS1U40 LS140+ LS2U40 LS240+ LS3U40 LS340+ LS4
Lung Score
Percent of pulls by Lung Score and Temp
🞄38% pulls LS2 U40
🞄22% pulls LS1 U40
🞄Very Few LS4 and LS5
🞄65% of pulls have no temp.
1
0
5.0
2
3
4
25.0
20.0
5
6
7
30.0
8 35.0
Percent
LS1U40 LS140+ LS2U40 LS240+ LS3U40 LS340+ LS4 LS5
Lung Score
Case Fatality Rate
9
40.0
CFRincreases with lung score
Othertechnology
🞄
Remote health monitoring
systems
🞄Immunostimulants
InF
eedMedications
🞄Virginiamycin Prescription with restrictions – Nil WHP
🞄Chlorotetracycline Prescription – WHP 10 days
Prescription - WHP 7 days
Prescription–Nil WHP
Nil WHP
🞄Oxytetracycline
🞄Tylosin
🞄Ionophores
🞄Flavomycin Nil WHP
Ionophores?
🞄
Not used in human medicine
🞄Marketing and branding
🞄
Customer desire
🞄
Pressure is coming
Alternatives?
🞄ReplaceIonophoreswithoutreducingperformanceor
increasing digestivechallenges.
🞄Direct fed microbials (probiotics, Prebiotics, Synbiotics)
🞄DHA Omega3
🞄Yeasts
🞄Essential Oils
🞄Organic acids
🞄B- group vitamins
🞄Thyme and celery
Some products have some runs on the board
🞄
EPNIX V Monensin + Tylan
🞄Cactus feeders –2000 head study. Fed 169 days
🞄Carcass weight + 6.4 kg, Yield +4.6%, EMA +1.5cm
🞄
Essential oils + benzoic acid V Monensin + Tylan
🞄No change in carcass. Poorer feed efficiency
🞄
Thyme + celery V Salinomycin V Nothing
🞄Improvements over control. Similar carcass traits to salinomycin
Natursafe–Diamond-V (Yeast metabolite- unique fermentation)
🞄
Natursafe V Monensin Tylan + Bovamine
🞄Reduces faecal gut pathogens
🞄Mortality and morbidity similar.
🞄Performance the same.
🞄Liver abscess incidence the same with less severity.
🞄Metaphylaxis V Natursafe (OTC over 2 Consecutive years)
🞄Same pull rate
🞄25% reduction in repulls
🞄30% reduction in Mortality
🞄Cost saving DL+ Meds $13.74/head in
🞄Any improvement in performance or decreased culls not documented
🞄Bovacillus (B. Licheniformis + B. Subtilis) CHR Hansen
🞄Improved NDFdigestibility
🞄Improved feed efficiency
🞄ADG the same.
🞄Reduced digestive deaths.
🞄Reduced high DOF sudden deaths (Clostridial deaths?)
🞄No studies without monensin
Conclusion
🞄Antimicrobial usage can be reduced
🞄Success can be achieved by taking a holistic approach
🞄Procurement,Preparationcombinedwithgoodstockmanshipand
acclimation
🞄A focus on “wellness and wellbeing” is necessary
🞄Ionophore and infeed antibiotic reduction
🞄Is possible without losing performance
🞄Products are emerging
Thank You

6. Future viable steps to reduce antibiotic usage in.pptx