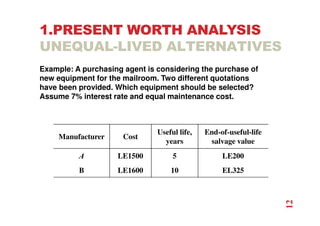
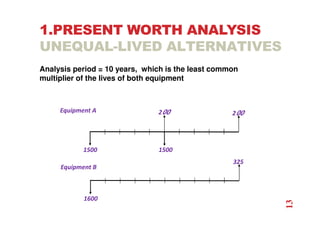
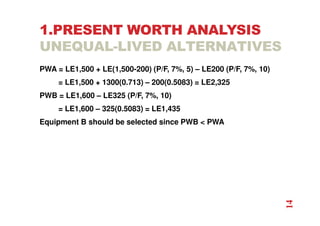
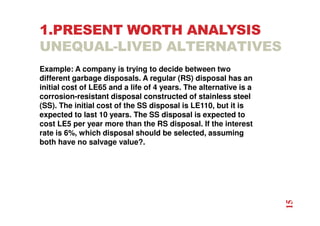
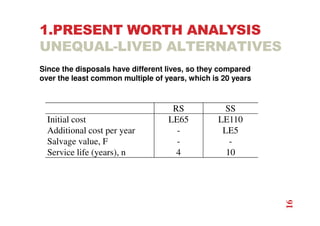
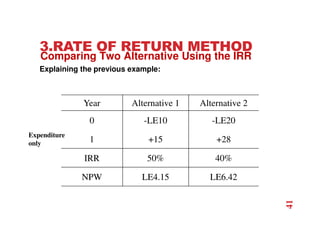
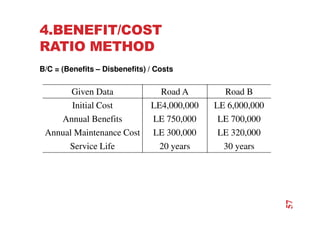
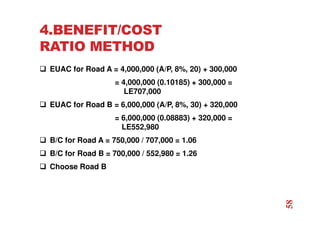
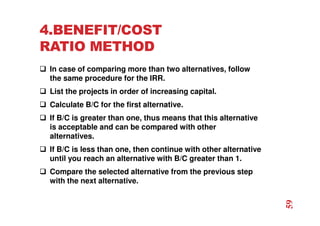
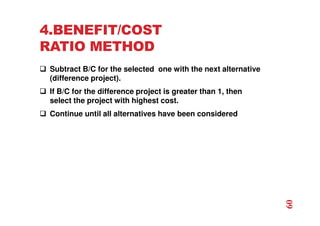
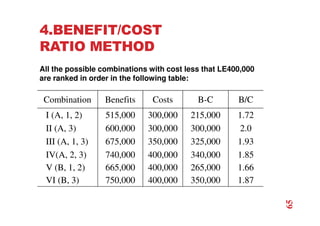
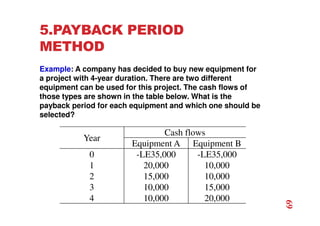
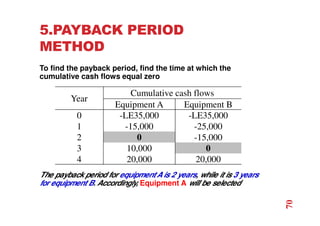
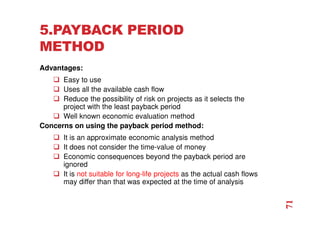
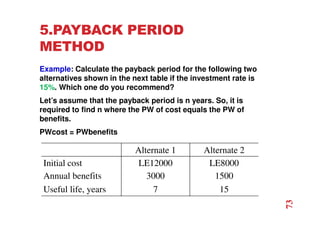
ECONOMIC
EVALUATION OF
ALTERNATIVES
Courtesy of Dr. Emad Elbeltagy
1
AGENDA
 Economic Evaluation
 Planning Horizon
 Life Cycle Costing
 Present Worth Analysis
 Equivalent Uniform Annual Worth Analysis
 Rate of Return Method
 Benefit/Cost Ratio Method
 Payback Period
 Inflation
2
ECONOMIC EVALUATION
 Generate a set of projects or purchases for investment
consideration
 Establish the planning horizon for economic analysis
 Estimate the cash flow profile for each project
 Specify the minimum attractive rate of return (MARR)
 Establish the criterion for accepting or rejecting a
proposal, or for selecting the best among a group of
mutually exclusive proposals
Economic evaluation approach
3
ECONOMIC EVALUATION
 Perform sensitivity or uncertainty analysis
 Accept or reject a proposal based on the established
criterion
 Equivalence needed to adjust the cash flow for a given
alternative into some equivalent to enable comparisons
1. Present worth analysis
2. Equivalent uniform annual cost analysis
3. Internal rate of return method
4. Benefit/cost ratio method
5. Payback period
Economic evaluation approach
4
PLANNING HORIZON
 Each alternative has its own service life
 Accordingly, in this analysis, careful consideration must
be given to the time period covered by the analysis
 This is called the analysis period or the planning horizon
 There are three different analysis-period situations :
The alternatives have equal useful life or analysis period
The alternatives have different useful lives or analysis period
There is an infinite analysis period for each mutually
exclusive proposals
5
LIFE CYCLE COSTING
 The concept of life cycle costing takes into account total
costs for an investment during its life span
 Life cycle costs considers all significant costs of initial
costs and ownership costs over economic life of each
alternative
Initial costs: including: initial construction cost, design cost,
land cost and finance cost
Ownership costs: including operating costs (maintenance,
repairs and utility bills)
Replacement costs (cost of replacing the project after it runs
its economic life)
6
1.PRESENT WORTH ANALYSIS
 Present worth is most frequently used method to
determine the present value of future money
 In present worth analysis, the alternative with the
maximum present worth (PW) of benefits minus present
worth of cost is always selected
 This is called the net present worth criterion (NPW)
 NPW = PW of benefits – PW of costs
 Careful consideration must be given to the time period
covered by the analysis
7
1.PRESENT WORTH ANALYSIS
EQUAL-LIVED ALTERNATIVES
Example: Make a present-worth comparison of the equal-
service life projects for which costs are shown below, if i =
10%. Which project would you select?
Project A Project B
First cost, P LE 2,500,000 LE3,500,000
Annual operating cost, A LE 900,000 LE 700,000
Salvage value, F LE 200,000 LE 350,000
Project service life (years) 5 5
8
1.PRESENT WORTH ANALYSIS
EQUAL-LIVED ALTERNATIVES
 PA = LE2,500,000 + LE900,000 (P/A, 10%, 5) - LE200,000
(P/F, 10%, 5) = LE5,788,000
 PB = LE3,500,000 + LE700,000 (P/A, 10%, 5) - LE350,000
(P/F, 10%, 5) = LE5,936,000
 Project A should be selected since PA  PB
A = LE700,000
LE350,000
LE3,500,000
A = LE900,000
LE2,500,000
LE200,00
0
9
1.PRESENT WORTH ANALYSIS
EQUAL-LIVED ALTERNATIVES
Example: A firm is considering which of two mechanical
devices to install to reduce costs in a particular situation.
Both devices cost LE1000 and have useful lives of five years
and no salvage value. Device A is expected to result in LE300
savings annually. Device B will provide savings for LE400 the
first year but will decline LE50 annually. With interest rate 7%,
which device should the firm purchase?
10
1.PRESENT WORTH ANALYSIS
EQUAL-LIVED ALTERNATIVES
 PWA = 300(P/A, 7%, 5) = 300(4.100) = LE1230
 PWB = 400(P/A, 7%, 5) – 50(P/G, 7%, 5)
= 400(4.100) – 50(7.647) = LE1257.65
 Device B has the largest present worth of benefits,
therefore, it the preferred alternative
PW of benefits
350
400
A= 300 300 250
200
n = 5
PW of benefits
Device A Device B
n = 5
11
1.PRESENT WORTH ANALYSIS
UNEQUAL-LIVED ALTERNATIVES
Example: A purchasing agent is considering the purchase of
new equipment for the mailroom. Two different quotations
have been provided. Which equipment should be selected?
Assume 7% interest rate and equal maintenance cost.
Manufacturer Cost
Useful life,
years
End-of-useful-life
salvage value
A LE1500 5 LE200
B LE1600 10 EL325
12
1.PRESENT WORTH ANALYSIS
UNEQUAL-LIVED ALTERNATIVES
Analysis period = 10 years, which is the least common
multiplier of the lives of both equipment
1500
200
Equipment A 200
1500
1600
Equipment B
325
13
1.PRESENT WORTH ANALYSIS
UNEQUAL-LIVED ALTERNATIVES
PWA = LE1,500 + LE(1,500-200) (P/F, 7%, 5) – LE200 (P/F, 7%, 10)
= LE1,500 + 1300(0.713) – 200(0.5083) = LE2,325
PWB = LE1,600 – LE325 (P/F, 7%, 10)
= LE1,600 – 325(0.5083) = LE1,435
Equipment B should be selected since PWB  PWA
14
1.PRESENT WORTH ANALYSIS
UNEQUAL-LIVED ALTERNATIVES
Example: A company is trying to decide between two
different garbage disposals. A regular (RS) disposal has an
initial cost of LE65 and a life of 4 years. The alternative is a
corrosion-resistant disposal constructed of stainless steel
(SS). The initial cost of the SS disposal is LE110, but it is
expected to last 10 years. The SS disposal is expected to
cost LE5 per year more than the RS disposal. If the interest
rate is 6%, which disposal should be selected, assuming
both have no salvage value?.
15
1.PRESENT WORTH ANALYSIS
UNEQUAL-LIVED ALTERNATIVES
Since the disposals have different lives, so they compared
over the least common multiple of years, which is 20 years
RS SS
Initial cost LE65 LE110
Additional cost per year - LE5
Salvage value, F - -
Service life (years), n 4 10
16
1.PRESENT WORTH ANALYSIS
UNEQUAL-LIVED ALTERNATIVES
PRS = LE65 + LE65 (P/F, 6%, 4) + LE65 (P/F, 6%, 8) + LE65
(P/F, 6%, 12) + LE65 (P/F, 6%, 16) = LE215
PSS = LE110 + LE110 (P/F, 6%, 10) + LE5 (P/A, 6%, 20) =
LE229
Disposal RS should be selected since PRS  PSS
LE65 LE65 LE65 LE65 LE65
LE110 LE110
A = LE5
17
1.PRESENT WORTH ANALYSIS
INFINITE ANALYSIS PERIODS
 Sometimes an infinite analysis period (n = ∞) is encountered
 Alternatives such as roads, dams, bridges or whatever is
sometimes considered permanent
 This analysis is called capitalized cost.
 A capitalized cost is the present sum of money that would
need to be set aside now, at some interest rate, to yield the
funds required to provide the service indefinitely
18
1.PRESENT WORTH ANALYSIS
INFINITE ANALYSIS PERIODS
Example: A city plans a pipeline to transport water from a
distant watershed area to the city. The pipeline will cost LE8
million and have an expected life of seventy years. The city
anticipates it will need to keep the water line in service
indefinitely. Compute the capitalized cost assuming 7%
interest
19
1.PRESENT WORTH ANALYSIS
INFINITE ANALYSIS PERIODS
 In this case, the LE8 million repeats every 70 years. We
can find A first based on a present LE8 million
disbursement.
 A = P(A/P, i, n) = LE8,000,000(0.0706) = LE565,000
 Now, the infinite series payment formula could be applied
for n = ∞:
 Capitalized cost P = A / i = 565,000 / 0.07 = LE8,071,000
20
2.EQUIVALENT UNIFORM
ANNUAL WORTH ANALYSIS
 In this section, the goal is to convert money into an
equivalent uniform annual cost or benefits
 The major advantage of this method is that it is not
necessary to make the comparison over the same number
of years when the alternatives have different lives
 The reason for that, it is an equivalent annual cost over
the life of the project
21
2.EQUIVALENT UNIFORM
ANNUAL WORTH ANALYSIS
Example: If the minimum required rate of return is 15% which
project should be selected?
Project A Project B
First cost LE26,000,000 LE36,000,000
Annual maintenance cost LE800,000 LE300,000
Annual labor cost LE11,000,000 LE7,000,000
Extra income taxes LE2,600,000
Salvage value LE2,000,000 LE3,000,000
Project service life (years) 6 10
22
2.EQUIVALENT UNIFORM
ANNUAL WORTH ANALYSIS
LE3,000,000
LE36,000,000
LE9,900,000 = 300,000 + 7,000,000 + 2,600,000
LE2,000,000
LE26,000,000
LE11,800,000 = 11,000,000 + 800,000
23
2.EQUIVALENT UNIFORM
ANNUAL WORTH ANALYSIS
 EUACA = LE26,000,000(A/P, 15%, 6) - LE2,000,000(A/F,
15%, 6) + LE11,800,000 = LE18,442,000
 EUACB = LE36,000,000(A/P, 15%, 10) - LE3,000,000 (A/F,
15%, 10) + EL9,900,000= LE16,925,000
 Project B should be selected since EUACB  EUACA
24
2.EQUIVALENT UNIFORM
ANNUAL WORTH ANALYSIS
An asset depreciates uniformly from a first cost of LE50,000
to zero over a 20-year time frame. If operating costs are
initially LE1,500 but increase by LE2,000 per year and
revenues are LE20,000 per year but decrease by LE1,000 per
year what is the EAW if the machine is replaced every 10
years and the interest rate is 5%.
EAUC = -50,000 (A/P, 5, 10) – 1,500 – 2,000(A/G, 5, 10) + 20,000
– 1,000(A/G, 5, 10)+ 25,000(A/F,5 ,10)
= -25,000(0.1295) – 1,500 – 2,000(4.09909) + 20,000
– 1,000(4.09909) = LE2,965
25
3.RATE OF RETURN METHOD
 The objective of the rate of return method is to find the rate of
return (i% percentage) for an investment over a specific
service life
 The rate of return method considers all the cash follows that
occur during the life cycle of an investment
 There are two methods to find the rate of return:
 Present worth
 Equivalent uniform annual cost
 Internal Rate of Return (IRR) calculations tell us the exact
rate of return we are receiving on an investment
26
3.RATE OF RETURN METHOD
 Suppose that you invested in 1970 LE1,650 in a savings
account at 6% per year. Then, you could have LE10,648 on
Jan., 2002 . What is the meaning of this 6% interest here?
 This is your opportunity cost if putting money in
savings account was the best you can do at that time!
 So, as long as you earn more than 6% interest in
another investment, you will take that investment
 Therefore, that 6% is viewed as a Minimum Attractive
Rate of Return or required rate of return (MARR)
27
3.RATE OF RETURN METHOD
 If projects being assessed then any project with an IRR
greater than the MARR should be accepted
 IRR is defined as the investment rate that makes the PV of
all expenditures equals the PV of all income(NPV =0)
 Or, Rate of return (ROR) or Internal Rate of Return (IRR) is
defined as the interest rate earned on the unpaid balance
of an installment loan
28
3.RATE OF RETURN METHOD
Example, we might invest LE5000 in a machine with a five-
year useful life and annual revenue of LE1252.
What rate of return would we receive on this investment?
The least IRR is the one that makes the NPV of all payments
equal to zero
The five payments of LE1252 are equivalent to a present sum
of LE5000 when interest rate is 8%. Then, IRR =8%
29
3.RATE OF RETURN METHOD
Year
Cash
flow
Unrecovered
investment at
beginning of
year
8% return on
unrecovered
investment
Investment
repayment at
end of year
Unrecovered
investment at
end of year
0 -LE5000
1 +1252 5000 400 852 4148
2 +1252 4148 331 921 3227
3 +1252 3227 258 994 2233
4 +1252 2233 178 1074 1159
5 +1252 1159 93 1159 0
1260 5000
30
3.RATE OF RETURN METHOD
 When deciding on one alternative, then it is acceptable if it
brings a positive IRR or an IRR greater than the MARR
 Rate of return calculation by the present worth method:
 The calculations are done in three steps:
 Draw a cash flow diagram
 Set up the rate of return equation in the form
0 = ± P + Σ nj = 1 F (P/F, i%, n) ± A (P/A, i%, n)
 Select values of i by trial and error until the equation is
balanced to zero
IRR for one Alternative
31
3.RATE OF RETURN METHOD
 Rate of Return Calculation by the EUAC Method:
 The calculations are done in three steps:
 Draw a cash flow diagram
 Set up the rate of return equation in the form
0 = ± P (A/P, i%, n) ± A
 Select values of i by trial and error until the equation is
balanced to zero
IRR for one Alternative
32
3.RATE OF RETURN METHOD
 Example: An investment resulted in the following cash
flow. Compute the rate of return.
 EUAB – EUAC = 0
 100 + 75(A/G, i, 4) – 700(A/P, i, 4) = 0;
 try i = 5%
 100 + 75(A/G, 5, 4) – 700(A/P, 5, 4) = +LE11
 try i = 8%
 100 + 75(A/G, 8, 4) – 700(A/P, 8, 4) = -LE6
 by interpolation, then i = 7%.
Year 0 1 2 3 4
Cash flow (LE) -700 +100 +175 +250 +325
IRR for one Alternative
33
3.RATE OF RETURN METHOD
 Example: If LE5,000 is invested now, this is expected to
yield LE100 per year for 10 years and LE7,000 at the end of
10 years, what is the rate of return?
Cash flow diagram:
5000
7000
A = 100
IRR for one Alternative
34
3.RATE OF RETURN METHOD
Using the equation:
0 = ± P + Σ nj = 1 F (P/F, i%, n) ± A (P/A, i%, n)
0 = - 5,000 + 100 (P/A, i%, 10) + 7,000 (P/F, i%, 10)
Try i = 5%:
0 = - 5,000 + 100 (P/A, 5%, 10) + 7,000 (P/F, 5%, 10) = + LE69.46
Try i = 6%:
0 = - 5,000 + 100 (P/A, 6%, 10) + 7,000 (P/F, 6%, 10) = - LE355.19
By interpolation i = 5.16%
IRR for one Alternative
35
3.RATE OF RETURN METHOD
 When two alternatives are compared, the IRR for each one
is calculate and each alternative should first satisfies the
MARR
 Alternative with the highest IRR not necessary being the
best
 If the cash flows for one or all alternatives contain
expenditures only, in this case we couldn’t compute the
IRR and accordingly we couldn’t compare these
alternatives using the IRR
 In this case, the incremental rate of return (∆IRR) is
computed on the difference between the alternatives
Comparing Two Alternative Using the IRR
36
3.RATE OF RETURN METHOD
 The cash flow for the difference between the alternatives
is computed by taking the higher initial cost alternative
minus the lower initial cost alternative
 If the ∆IRR is ≥ MARR then choose the higher cost
alternative
 Thus means that the additional invested to obtain the
higher alternative is superior to invest it elsewhere at the
MARR
 If the ∆IRR is ≤ MARR then choose the lower cost
alternative
Comparing Two Alternative Using the IRR
37
3.RATE OF RETURN METHOD
Example: You are given the choice of selecting one of two
alternatives. The cash flows of the alternatives as shown in
the following table. If the MARR is 6%, which one you select?
Year Alternative 1 Alternative 2
0 -10 -20
1 +15 +28
38
Comparing Two Alternative Using the IRR
3.RATE OF RETURN METHOD
Normally, we select the lesser-cost alternatives (alternative
1), unless we find the additional cost of alternative 2
produces sufficient additional benefits that we would prefer.
So, we will evaluate the difference project.
Year Alternative 1 Alternative 2 Alt. 2 – Alt. 1
0 -LE10 -LE20 -20 – (-10) = -10
1 +15 +28 28 – 15 = +13
39
Comparing Two Alternative Using the IRR
3.RATE OF RETURN METHOD
 PWcost = PWbenefit
 10 = 13(P/F, i%, 1)
 (P/F, i%, 1) = 10/13 = 0.7692; then i = 30
 Then, choose alternative 2
 Thus means that the additional LE10 invested to obtain
alternative 2 is better than invest the LE10 elsewhere at
6% (MARR)
40
Comparing Two Alternative Using the IRR
3.RATE OF RETURN METHOD
Explaining the previous example:
Year Alternative 1 Alternative 2
0 -LE10 -LE20
1 +15 +28
IRR 50% 40%
NPW LE4.15 LE6.42
41
Comparing Two Alternative Using the IRR
Expenditure
only
3.RATE OF RETURN METHOD
 Based on the NPW analysis, choose Option 2
 This agrees with the rate of return analysis on the
difference between the two alternatives
 Based on the rate of return, Option 1 has higher rate of
return
 Our analysis is to maximize the return not the rate of
return
 Option 1 has a 50% rate of return (return =0.5 x 10= LE5),
while option 2 has a 40% rate of return on a larger
investment (return = 0.4x20= LE8)
42
Comparing Two Alternative Using the IRR
3.RATE OF RETURN METHOD
 List the projects in order of increasing capital
 Check that the first project has an IRR greater than the
MARR
 If yes, it becomes the defender, if not reject it and try
remaining projects in order until one is greater than the
MARR
 Subtract the defender’s values (first cost, annual cost,
annual revenues) from the challenger and calculate the
IRR of the remainder
 If the IRR is greater than the MARR accept the challenger
as the new defender, if not reject it and compare the next
alternative
 Continue until all alternatives have been considered
Comparing Two Alternative Using the IRR
43
3.RATE OF RETURN METHOD
Example: The following information showing the cash flows
for two alternatives. If the MARR is 15%, which one is
preferred?
Comparing Two Alternative Using the IRR
Alternative 1 Alternative 2
Initial cost LE8000 LE13000
Annual costs 3500 1600
Salvage value - 2000
Useful life 10 5
44
3.RATE OF RETURN METHOD
The cash flow of the incremental project
NPV2-1 = 0 = -5000 + 1900(P/A, i%, 10) - 11000(P/F, i%, 5)
+ 2000(P/F, i%, 10); then IRR2-1 = 12.65%
IRR2-1 is less than MARR, then choose Alternative 1
Comparing Two Alternative Using the IRR
Year Alternative 1 Alternative 2 Alt. 2 – Alt. 1
0 -8000 -13000 -5000
1-5 -3500 -1600 1900
5 -
+2000
-13000
-11000
6-10 -3500 -1600 1900
10 - +2000 2000
45
3.RATE OF RETURN METHOD
Example: A small company is looking at expanding its
business by purchasing a small new store that will operate
for 10 years before being sold and replaced with a newer
larger store. Three sites have been recommended to the
owner each with different costs and expected revenues
based on its location. The company operates with a MARR of
15% before taxes. Rate the alternatives based on:
a) PW comparison and
b) IRR comparison
Comparing Two Alternative Using the IRR
46
3.RATE OF RETURN METHOD
Comparing Two Alternative Using the IRR
SITE 1 SITE 2 SITE 3
Land Purchase Price 100,000 150,000 160,000
Renovations 40,000 40,000 60,000
Resale 125,000 155,000 175,000
Expected Revenue 125,000 195,000 300,000
Annual Power Costs 35,000 55,000 75,000
Annual O  M cost 66,000 109,000 184,000
47
3.RATE OF RETURN METHOD
First, determine total initial cost, net revenues and rank the
sites in order of first cost
Comparing Two Alternative Using the IRR
SITE 1 SITE 2 SITE 3
Initial costs 140,000 190,000 220,000
Resale 125,000 155,000 175,000
Net Revenues/year 24,000 31,000 41,000
48
3.RATE OF RETURN METHOD
 Present Worth Comparison where i =15%
 Site 1: PW =-140000+125000(P/F,15,10)+ 24000(P/A, 15, 10)
= -140,000 + 30,898 + 120,450 = LE11,348
 Site 2: PW =-190000 +155000(P/F,15,10) + 31000(P/A, 15, 10)
= -190,000 + 38,313 + 155,582 = LE3,895
 Site 3: PW =-220000 +175000(P/F,15,10) + 41000(P/A, 15, 10)
= -220,000 + 43,257 + 205,770 = LE29,027
 Therefore select Site 3 then Site 1 and then Site 2
Comparing Two Alternative Using the IRR
49
3.RATE OF RETURN METHOD
 IRR Comparison
 Site 1: -140,000 + 125,000(P/F, i, 10) + 24,000(P/A, i, 10) = 0
 By trial and error i= 16.66%, Select Site 1 since IRR  MARR
 Incremental site 2- site 1
 -50,000 + 30,000(P/F, i, 10) + 7,000(P/A, i, 10) = 0
 By trial and error i= 11.69%
 Select Site 1 since ∆IRR  MARR
 Incremental site 3- site 1
 -80,000 + 50,000(P/F, i, 10) + 17,000(P/A, i, 10) = 0
 By trial and error i= 19.79%
 Select Site 3 since ∆IRR  MARR
Comparing Two Alternative Using the IRR
50
4.BENEFIT/COST
RATIO METHOD
 The Benefit/Cost (B/C) method is based on the ratio of the
annual benefits to the annual costs for a particular project
 Benefits are advantages, expressed in terms of a
monetary value to the owner (i.e. dollars, etc.)
 Disbenefits are disadvantages, expressed in terms of a
monetary value to the owner (i.e. dollars, etc.)
 B/C = (Benefits – Disbenefits) / Costs
51
4.BENEFIT/COST
RATIO METHOD
B/C ratio=
Equivalent annual total benefits
Equivalent annual total 
B/C ratio=
Present worth of total benefits
Present worth of total cost
52
4.BENEFIT/COST
RATIO METHOD
Example (3)
The construction of a sewerage system is estimated to be $30,000,000.
The annual operation, maintenance and repair (OMR) is $1,000,000/year.
The annual income (benefit) from users is $3,500,000/year.
The life of the system is 30 years and the discount rate is 5%.
 Annual cost of = ‐
‐
‐
‐1,951,500 – 1,000,000 = -2,951,500/year.
Solution:
B/C = 3,500,000 / 2,951,500 = 1.186
B/C = 53,803,400 / 45,372,400 = 1.186
If B/C is greater than 1, the project is worth
If B/C equals , the project is called break‐
‐
‐
‐even
53
4.BENEFIT/COST
RATIO METHOD
 If the B/C ratio is ≥ 1.0, this means that the extra benefit(s)
of the higher cost alternative justify the higher cost
 If the B/C ratio is  1.0, this means that the extra cost is
not justified and the lower cost alternative is selected
 An alternative method that can be used to compare
between projects, is to subtract the costs from the
benefits that is (B – C)
If (B – C) is ≥ 0, this means that the project is acceptable
If (B – C) ratio is  0, this means that the project is rejected
54
4.BENEFIT/COST
RATIO METHOD
 Rather than solving problems using present worth or
annual cash flows analysis, we can base the calculations
on the benefit-cost ratio, B/C
 The B/C is the ration of benefits to costs, or:
 B/C = PW of benefit / PW of costs = EUAB / EUAC ≥ 1
55
4.BENEFIT/COST
RATIO METHOD
Example: Two routes are considered for a new highway,
Road A, costing LE4,000,000 to build, will provide annual
benefits of LE750,000 to local businesses. Road B would cost
LE6,000,000 but will provide EL700,000 in benefits. The
annual cost of maintenance is LE300,000 for Road A and
LE320,000 for Road B. If the service life of Road A is 20 years,
and for Road B is 30 years, which alternative should be
selected if the interest rate is 8%?
56
4.BENEFIT/COST
RATIO METHOD
B/C = (Benefits – Disbenefits) / Costs
Given Data Road A Road B
Initial Cost LE4,000,000 LE 6,000,000
Annual Benefits LE 750,000 LE 700,000
Annual Maintenance Cost LE 300,000 LE 320,000
Service Life 20 years 30 years
57
4.BENEFIT/COST
RATIO METHOD
 EUAC for Road A = 4,000,000 (A/P, 8%, 20) + 300,000
= 4,000,000 (0.10185) + 300,000 =
LE707,000
 EUAC for Road B = 6,000,000 (A/P, 8%, 30) + 320,000
= 6,000,000 (0.08883) + 320,000 =
LE552,980
 B/C for Road A = 750,000 / 707,000 = 1.06
 B/C for Road B = 700,000 / 552,980 = 1.26
 Choose Road B
58
4.BENEFIT/COST
RATIO METHOD
 In case of comparing more than two alternatives, follow
the same procedure for the IRR.
 List the projects in order of increasing capital.
 Calculate B/C for the first alternative.
 If B/C is greater than one, thus means that this alternative
is acceptable and can be compared with other
alternatives.
 If B/C is less than one, then continue with other alternative
until you reach an alternative with B/C greater than 1.
 Compare the selected alternative from the previous step
with the next alternative.
59
4.BENEFIT/COST
RATIO METHOD
 Subtract B/C for the selected one with the next alternative
(difference project).
 If B/C for the difference project is greater than 1, then
select the project with highest cost.
 Continue until all alternatives have been considered
60
4.BENEFIT/COST
RATIO METHOD
Example: Two machines are being considered for purchase.
If the interest rate is 10%, which machine should be bought?
Machine X Machine Y
Initial cost LE200 LE700
Annual benefits 95 120
Salvage value 50 150
Useful life, years 6 12
61
4.BENEFIT/COST
RATIO METHOD
 Machine X:
 EUAC = 200(A/P, 10%, 6) - 50(A/F, 10%, 6) = LE40
 EUAB = LE95
 B/C = 95/40 = 2.37
 Machine Y:
 EUAC = 700(A/P, 10%, 12) - 150(A/F, 10%, 12) = LE96
 EUAB = LE120
 B/C = 120/96 = 1.25
 Calculate the incremental benefit cost ratio, ∆B/∆C (machine
Y – machine X)
 ∆B/∆C = (120-95) / (96-40) = 0.45
 Since the incremental B/C is less than 1, it represents an
undesirable increment of investment.
 Therefore choose the lower cost alternative – machine X
62
4.BENEFIT/COST
RATIO METHOD
Example: A company has decided to build a factory on a
particular site. There are two mutually exclusive proposals
that have been developed for the main factory. There are also
three secondary proposals for the main project. The present
worth of the benefits and costs are shown below. Which
combinations of projects are best if the company can only
spend LE400,000?
63
4.BENEFIT/COST
RATIO METHOD
Main Proposals
Project Benefits Costs B/C
A 300,000 150,000 2.0
B 450,000 250,000 1.8
Secondary Proposals
Project Benefits Costs
1 75,000 50,000
2 140,000 100,000
3 300,000 150,000
64
4.BENEFIT/COST
RATIO METHOD
All the possible combinations with cost less that LE400,000
are ranked in order in the following table:
Combination Benefits Costs B-C B/C
I (A, 1, 2) 515,000 300,000 215,000 1.72
II (A, 3) 600,000 300,000 300,000 2.0
III (A, 1, 3) 675,000 350,000 325,000 1.93
IV(A, 2, 3) 740,000 400,000 340,000 1.85
V (B, 1, 2) 665,000 400,000 265,000 1.66
VI (B, 3) 750,000 400,000 350,000 1.87
65
4.BENEFIT/COST
RATIO METHOD
 Since all B/C ratios are greater than one, then we will
compare all alternatives
 Since alternatives I and II have the same costs while
benefits of alternative II is greater, then choose II
 III-II: ∆B/∆C =(675,000–600,000)/(350,000–300,000) = 1.333
 Accept III
 IV-III: ∆B/∆C =(740,000– 675,000)/(400,000 – 350,000) = 1.3
 Accept IV
66
4.BENEFIT/COST
RATIO METHOD
 Since alternatives V and IV have the same costs while
benefits of alternative IV is greater, then choose IV
 VI-IV
 Since both alternatives VI and IV have the same costs
while benefit of alternative VI is greater, the
 Accept VI
67
5.PAYBACK PERIOD
METHOD
 Payback period is defined as “the period of time required
for the profit or other benefits from an investment to equal
the cost of the investment”
 The criterion in all situations is to minimize the payback
period
 This method concerns with determining the number of
years or months (the time) required to recover all the
invested money
 When comparing between alternatives using this method,
the alternative with the least payback period is selected
68
5.PAYBACK PERIOD
METHOD
Example: A company has decided to buy new equipment for
a project with 4-year duration. There are two different
equipment can be used for this project. The cash flows of
those types are shown in the table below. What is the
payback period for each equipment and which one should be
selected?
Year
Cash flows
Equipment A Equipment B
0 -LE35,000 -LE35,000
1 20,000 10,000
2 15,000 10,000
3 10,000 15,000
4 10,000 20,000
69
5.PAYBACK PERIOD
METHOD
To find the payback period, find the time at which the
cumulative cash flows equal zero
The payback period for equipmentA is 2 years, while it is 3 years
for equipment B. Accordingly, Equipment A will be selected
Year
Cumulative cash flows
Equipment A Equipment B
0 -LE35,000 -LE35,000
1 -15,000 -25,000
2 0 -15,000
3 10,000 0
4 20,000 20,000
70
5.PAYBACK PERIOD
METHOD
Advantages:
 Easy to use
 Uses all the available cash flow
 Reduce the possibility of risk on projects as it selects the
project with the least payback period
 Well known economic evaluation method
Concerns on using the payback period method:
 It is an approximate economic analysis method
 It does not consider the time-value of money
 Economic consequences beyond the payback period are
ignored
 It is not suitable for long-life projects as the actual cash flows
may differ than that was expected at the time of analysis
71
5.PAYBACK PERIOD
METHOD
 One of the disadvantages of the payback period is that it
ignores the time value of money. This drawback could be
overcome by considering the time value of money, by
determining the PW of both the costs and the revenues
and equating them to find the payback period
72
5.PAYBACK PERIOD
METHOD
Example: Calculate the payback period for the following two
alternatives shown in the next table if the investment rate is
15%. Which one do you recommend?
Let’s assume that the payback period is n years. So, it is
required to find n where the PW of cost equals the PW of
benefits.
PWcost = PWbenefits
Alternate 1 Alternate 2
Initial cost LE12000 LE8000
Annual benefits 3000 1500
Useful life, years 7 15
73
5.PAYBACK PERIOD
METHOD
 Alternative 1:
12000 = 3000(P/A, 15, n1)
Then, (P/A, 15, n1) = 4
From the interest table, n1 lie between year 6 and year 7.
By interpolation n1 = 6.6 years
 Alternative 2:
8000 = 1500(P/A, 15, n2)
Then, (P/A, 15, n2) = 5.33
From the interest table, n2 lie between year 11 and year 12
By interpolation n2 = 11.5 years
 Based on these results, alternative 1 will be selected as it
has a shorter payback period
74
5.PAYBACK PERIOD
METHOD
 Analyzing this example:
 There is no return for the investment (IRR = 0) in
alternative 1. While the IRR for alternative 2 will be greater
than zero as there is still some returns after the payback
period
 To overcome this problem, we may compare the payback
period over the useful life of each alternative and select
the smaller ratio. Applying this for the previous example:
 n1/useful life 1 = 6.6/7 = 0.94
 n2/useful life 2 = 11.5/15 = 0.77
 Based on this comparison, select alternative 2
75
INFLATION
 Inflation is an important concept in any economic analysis
because the purchasing power of money rarely stays
constant.
 Over time, the amount of goods and services that can be
purchased with a fixed amount of money tends to change
(always decline).
 When prices inflate, we can buy less with the same amount of
money
 So, it is important to incorporate the effect of inflation in
analysis of alternatives
 When the purchasing power of money increase, this is
named deflation. Deflation has an opposite effect to inflation.
76
INFLATION
 Inflation rate (f): The inflation rate captures the decrease in
the purchasing power of the currency
 Interest rate (i): This is the interest rate measuring the real
growth of money without the effect of inflation
 Market interest rate (i’): The combined interest rate that
combines both the real money growth and inflation.
…… This is named as the inflated interest rate
77
INFLATION
 When calculating the investment of a given some of
money, it is multiplied by (1 + i)
 Considering the inflation effect, it is multiplied also by (1 +
f) Or, this sum of money is multiplied by (1 + i’) which
combines both the effect of interest and inflation.
 Accordingly, the relation could be derived as follows:
 (1 + i’) = (1 + i)(1 + f) = 1 + i + f + if
 Then, i’ = i + f + if
78
INFLATION
 Example: What is the amount of money a company should
save now to buy a new equipment costs LE65,000 after
three years from now. The interest rate is 13% and the
inflation rate is 7%.
 i’ = i + f + if = 0.13 + 0.07 + (0.13 × 0.07) = 0.2091 = 20.91%
 P = F / (1 + i’)n = 65000 / (1 + 0.2091)3
= LE36,773
79
INFLATION
 Example: Which of the following revenues is preferred, if
the interest rate is 12% and the inflation rate is 11%?
 LE60,000 now.
 LE16,000 annually starting one year from now for a period
of 12 years.
 LE50,000 after three years from now and LE80,000 after 5
years from now.
80
INFLATION
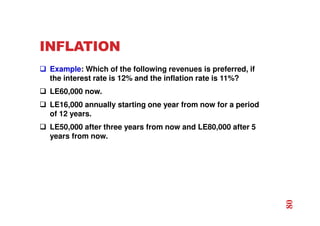
 i’ = i + f + if = 0.12 + 0.11 + 0.12 × 0.11 = 0.243 = 24.3%
 Pa = LE60,000
 Pb = A[ ((1 + i’)n – 1)) / (i’(1 + i’)n )]
= 16000 [(1.24312 -1) / 0.243(1.24312)] = LE61,003
 Pc = 50000 / (1.243)3 + 80000 / (1.243)5 = LE52,996
 Then, option b is preferred
81
82
P = F / (1 + i)n
F = P(1 + i)n





 −
+
=
i
i
A
F
n
1
)
1
(






−
+
=
1
)
1
( n
i
i
F
A






+
−
+
= n
n
i
i
i
A
P
)
1
(
1
)
1
(






−
+
+
=
1
)
1
(
)
1
(
n
n
i
i
i
P
A






−
−
+
= n
i
i
i
G
F
n
1
)
1
(






+
−
−
+
= n
n
i
i
in
i
G
P
)
1
(
1
)
1
(
2






−
+
−
=
1
)
1
(
1
n
i
n
i
G
A
QUESTIONS
DR. AHMED ELYAMANY
EMAIL: DRAHMEDELYAMANY@YAHOO.COM
WEB PAGE: HTTP://DRAHMEDELYAMANY.WEEBLY.COM/
83

6.alternative_analysis_cb311_spring-2015 (1).pdf

  • 1.
  • 2.
    AGENDA Economic Evaluation Planning Horizon Life Cycle Costing Present Worth Analysis Equivalent Uniform Annual Worth Analysis Rate of Return Method Benefit/Cost Ratio Method Payback Period Inflation 2
  • 3.
    ECONOMIC EVALUATION Generatea set of projects or purchases for investment consideration Establish the planning horizon for economic analysis Estimate the cash flow profile for each project Specify the minimum attractive rate of return (MARR) Establish the criterion for accepting or rejecting a proposal, or for selecting the best among a group of mutually exclusive proposals Economic evaluation approach 3
  • 4.
    ECONOMIC EVALUATION Performsensitivity or uncertainty analysis Accept or reject a proposal based on the established criterion Equivalence needed to adjust the cash flow for a given alternative into some equivalent to enable comparisons 1. Present worth analysis 2. Equivalent uniform annual cost analysis 3. Internal rate of return method 4. Benefit/cost ratio method 5. Payback period Economic evaluation approach 4
  • 5.
    PLANNING HORIZON Eachalternative has its own service life Accordingly, in this analysis, careful consideration must be given to the time period covered by the analysis This is called the analysis period or the planning horizon There are three different analysis-period situations : The alternatives have equal useful life or analysis period The alternatives have different useful lives or analysis period There is an infinite analysis period for each mutually exclusive proposals 5
  • 6.
    LIFE CYCLE COSTING The concept of life cycle costing takes into account total costs for an investment during its life span Life cycle costs considers all significant costs of initial costs and ownership costs over economic life of each alternative Initial costs: including: initial construction cost, design cost, land cost and finance cost Ownership costs: including operating costs (maintenance, repairs and utility bills) Replacement costs (cost of replacing the project after it runs its economic life) 6
  • 7.
    1.PRESENT WORTH ANALYSIS Present worth is most frequently used method to determine the present value of future money In present worth analysis, the alternative with the maximum present worth (PW) of benefits minus present worth of cost is always selected This is called the net present worth criterion (NPW) NPW = PW of benefits – PW of costs Careful consideration must be given to the time period covered by the analysis 7
  • 8.
    1.PRESENT WORTH ANALYSIS EQUAL-LIVEDALTERNATIVES Example: Make a present-worth comparison of the equal- service life projects for which costs are shown below, if i = 10%. Which project would you select? Project A Project B First cost, P LE 2,500,000 LE3,500,000 Annual operating cost, A LE 900,000 LE 700,000 Salvage value, F LE 200,000 LE 350,000 Project service life (years) 5 5 8
  • 9.
    1.PRESENT WORTH ANALYSIS EQUAL-LIVEDALTERNATIVES PA = LE2,500,000 + LE900,000 (P/A, 10%, 5) - LE200,000 (P/F, 10%, 5) = LE5,788,000 PB = LE3,500,000 + LE700,000 (P/A, 10%, 5) - LE350,000 (P/F, 10%, 5) = LE5,936,000 Project A should be selected since PA PB A = LE700,000 LE350,000 LE3,500,000 A = LE900,000 LE2,500,000 LE200,00 0 9
  • 10.
    1.PRESENT WORTH ANALYSIS EQUAL-LIVEDALTERNATIVES Example: A firm is considering which of two mechanical devices to install to reduce costs in a particular situation. Both devices cost LE1000 and have useful lives of five years and no salvage value. Device A is expected to result in LE300 savings annually. Device B will provide savings for LE400 the first year but will decline LE50 annually. With interest rate 7%, which device should the firm purchase? 10
  • 11.
    1.PRESENT WORTH ANALYSIS EQUAL-LIVEDALTERNATIVES PWA = 300(P/A, 7%, 5) = 300(4.100) = LE1230 PWB = 400(P/A, 7%, 5) – 50(P/G, 7%, 5) = 400(4.100) – 50(7.647) = LE1257.65 Device B has the largest present worth of benefits, therefore, it the preferred alternative PW of benefits 350 400 A= 300 300 250 200 n = 5 PW of benefits Device A Device B n = 5 11
  • 12.
    1.PRESENT WORTH ANALYSIS UNEQUAL-LIVEDALTERNATIVES Example: A purchasing agent is considering the purchase of new equipment for the mailroom. Two different quotations have been provided. Which equipment should be selected? Assume 7% interest rate and equal maintenance cost. Manufacturer Cost Useful life, years End-of-useful-life salvage value A LE1500 5 LE200 B LE1600 10 EL325 12
  • 13.
    1.PRESENT WORTH ANALYSIS UNEQUAL-LIVEDALTERNATIVES Analysis period = 10 years, which is the least common multiplier of the lives of both equipment 1500 200 Equipment A 200 1500 1600 Equipment B 325 13
  • 14.
    1.PRESENT WORTH ANALYSIS UNEQUAL-LIVEDALTERNATIVES PWA = LE1,500 + LE(1,500-200) (P/F, 7%, 5) – LE200 (P/F, 7%, 10) = LE1,500 + 1300(0.713) – 200(0.5083) = LE2,325 PWB = LE1,600 – LE325 (P/F, 7%, 10) = LE1,600 – 325(0.5083) = LE1,435 Equipment B should be selected since PWB PWA 14
  • 15.
    1.PRESENT WORTH ANALYSIS UNEQUAL-LIVEDALTERNATIVES Example: A company is trying to decide between two different garbage disposals. A regular (RS) disposal has an initial cost of LE65 and a life of 4 years. The alternative is a corrosion-resistant disposal constructed of stainless steel (SS). The initial cost of the SS disposal is LE110, but it is expected to last 10 years. The SS disposal is expected to cost LE5 per year more than the RS disposal. If the interest rate is 6%, which disposal should be selected, assuming both have no salvage value?. 15
  • 16.
    1.PRESENT WORTH ANALYSIS UNEQUAL-LIVEDALTERNATIVES Since the disposals have different lives, so they compared over the least common multiple of years, which is 20 years RS SS Initial cost LE65 LE110 Additional cost per year - LE5 Salvage value, F - - Service life (years), n 4 10 16
  • 17.
    1.PRESENT WORTH ANALYSIS UNEQUAL-LIVEDALTERNATIVES PRS = LE65 + LE65 (P/F, 6%, 4) + LE65 (P/F, 6%, 8) + LE65 (P/F, 6%, 12) + LE65 (P/F, 6%, 16) = LE215 PSS = LE110 + LE110 (P/F, 6%, 10) + LE5 (P/A, 6%, 20) = LE229 Disposal RS should be selected since PRS PSS LE65 LE65 LE65 LE65 LE65 LE110 LE110 A = LE5 17
  • 18.
    1.PRESENT WORTH ANALYSIS INFINITEANALYSIS PERIODS Sometimes an infinite analysis period (n = ∞) is encountered Alternatives such as roads, dams, bridges or whatever is sometimes considered permanent This analysis is called capitalized cost. A capitalized cost is the present sum of money that would need to be set aside now, at some interest rate, to yield the funds required to provide the service indefinitely 18
  • 19.
    1.PRESENT WORTH ANALYSIS INFINITEANALYSIS PERIODS Example: A city plans a pipeline to transport water from a distant watershed area to the city. The pipeline will cost LE8 million and have an expected life of seventy years. The city anticipates it will need to keep the water line in service indefinitely. Compute the capitalized cost assuming 7% interest 19
  • 20.
    1.PRESENT WORTH ANALYSIS INFINITEANALYSIS PERIODS In this case, the LE8 million repeats every 70 years. We can find A first based on a present LE8 million disbursement. A = P(A/P, i, n) = LE8,000,000(0.0706) = LE565,000 Now, the infinite series payment formula could be applied for n = ∞: Capitalized cost P = A / i = 565,000 / 0.07 = LE8,071,000 20
  • 21.
    2.EQUIVALENT UNIFORM ANNUAL WORTHANALYSIS In this section, the goal is to convert money into an equivalent uniform annual cost or benefits The major advantage of this method is that it is not necessary to make the comparison over the same number of years when the alternatives have different lives The reason for that, it is an equivalent annual cost over the life of the project 21
  • 22.
    2.EQUIVALENT UNIFORM ANNUAL WORTHANALYSIS Example: If the minimum required rate of return is 15% which project should be selected? Project A Project B First cost LE26,000,000 LE36,000,000 Annual maintenance cost LE800,000 LE300,000 Annual labor cost LE11,000,000 LE7,000,000 Extra income taxes LE2,600,000 Salvage value LE2,000,000 LE3,000,000 Project service life (years) 6 10 22
  • 23.
    2.EQUIVALENT UNIFORM ANNUAL WORTHANALYSIS LE3,000,000 LE36,000,000 LE9,900,000 = 300,000 + 7,000,000 + 2,600,000 LE2,000,000 LE26,000,000 LE11,800,000 = 11,000,000 + 800,000 23
  • 24.
    2.EQUIVALENT UNIFORM ANNUAL WORTHANALYSIS EUACA = LE26,000,000(A/P, 15%, 6) - LE2,000,000(A/F, 15%, 6) + LE11,800,000 = LE18,442,000 EUACB = LE36,000,000(A/P, 15%, 10) - LE3,000,000 (A/F, 15%, 10) + EL9,900,000= LE16,925,000 Project B should be selected since EUACB EUACA 24
  • 25.
    2.EQUIVALENT UNIFORM ANNUAL WORTHANALYSIS An asset depreciates uniformly from a first cost of LE50,000 to zero over a 20-year time frame. If operating costs are initially LE1,500 but increase by LE2,000 per year and revenues are LE20,000 per year but decrease by LE1,000 per year what is the EAW if the machine is replaced every 10 years and the interest rate is 5%. EAUC = -50,000 (A/P, 5, 10) – 1,500 – 2,000(A/G, 5, 10) + 20,000 – 1,000(A/G, 5, 10)+ 25,000(A/F,5 ,10) = -25,000(0.1295) – 1,500 – 2,000(4.09909) + 20,000 – 1,000(4.09909) = LE2,965 25
  • 26.
    3.RATE OF RETURNMETHOD The objective of the rate of return method is to find the rate of return (i% percentage) for an investment over a specific service life The rate of return method considers all the cash follows that occur during the life cycle of an investment There are two methods to find the rate of return: Present worth Equivalent uniform annual cost Internal Rate of Return (IRR) calculations tell us the exact rate of return we are receiving on an investment 26
  • 27.
    3.RATE OF RETURNMETHOD Suppose that you invested in 1970 LE1,650 in a savings account at 6% per year. Then, you could have LE10,648 on Jan., 2002 . What is the meaning of this 6% interest here? This is your opportunity cost if putting money in savings account was the best you can do at that time! So, as long as you earn more than 6% interest in another investment, you will take that investment Therefore, that 6% is viewed as a Minimum Attractive Rate of Return or required rate of return (MARR) 27
  • 28.
    3.RATE OF RETURNMETHOD If projects being assessed then any project with an IRR greater than the MARR should be accepted IRR is defined as the investment rate that makes the PV of all expenditures equals the PV of all income(NPV =0) Or, Rate of return (ROR) or Internal Rate of Return (IRR) is defined as the interest rate earned on the unpaid balance of an installment loan 28
  • 29.
    3.RATE OF RETURNMETHOD Example, we might invest LE5000 in a machine with a five- year useful life and annual revenue of LE1252. What rate of return would we receive on this investment? The least IRR is the one that makes the NPV of all payments equal to zero The five payments of LE1252 are equivalent to a present sum of LE5000 when interest rate is 8%. Then, IRR =8% 29
  • 30.
    3.RATE OF RETURNMETHOD Year Cash flow Unrecovered investment at beginning of year 8% return on unrecovered investment Investment repayment at end of year Unrecovered investment at end of year 0 -LE5000 1 +1252 5000 400 852 4148 2 +1252 4148 331 921 3227 3 +1252 3227 258 994 2233 4 +1252 2233 178 1074 1159 5 +1252 1159 93 1159 0 1260 5000 30
  • 31.
    3.RATE OF RETURNMETHOD When deciding on one alternative, then it is acceptable if it brings a positive IRR or an IRR greater than the MARR Rate of return calculation by the present worth method: The calculations are done in three steps: Draw a cash flow diagram Set up the rate of return equation in the form 0 = ± P + Σ nj = 1 F (P/F, i%, n) ± A (P/A, i%, n) Select values of i by trial and error until the equation is balanced to zero IRR for one Alternative 31
  • 32.
    3.RATE OF RETURNMETHOD Rate of Return Calculation by the EUAC Method: The calculations are done in three steps: Draw a cash flow diagram Set up the rate of return equation in the form 0 = ± P (A/P, i%, n) ± A Select values of i by trial and error until the equation is balanced to zero IRR for one Alternative 32
  • 33.
    3.RATE OF RETURNMETHOD Example: An investment resulted in the following cash flow. Compute the rate of return. EUAB – EUAC = 0 100 + 75(A/G, i, 4) – 700(A/P, i, 4) = 0; try i = 5% 100 + 75(A/G, 5, 4) – 700(A/P, 5, 4) = +LE11 try i = 8% 100 + 75(A/G, 8, 4) – 700(A/P, 8, 4) = -LE6 by interpolation, then i = 7%. Year 0 1 2 3 4 Cash flow (LE) -700 +100 +175 +250 +325 IRR for one Alternative 33
  • 34.
    3.RATE OF RETURNMETHOD Example: If LE5,000 is invested now, this is expected to yield LE100 per year for 10 years and LE7,000 at the end of 10 years, what is the rate of return? Cash flow diagram: 5000 7000 A = 100 IRR for one Alternative 34
  • 35.
    3.RATE OF RETURNMETHOD Using the equation: 0 = ± P + Σ nj = 1 F (P/F, i%, n) ± A (P/A, i%, n) 0 = - 5,000 + 100 (P/A, i%, 10) + 7,000 (P/F, i%, 10) Try i = 5%: 0 = - 5,000 + 100 (P/A, 5%, 10) + 7,000 (P/F, 5%, 10) = + LE69.46 Try i = 6%: 0 = - 5,000 + 100 (P/A, 6%, 10) + 7,000 (P/F, 6%, 10) = - LE355.19 By interpolation i = 5.16% IRR for one Alternative 35
  • 36.
    3.RATE OF RETURNMETHOD When two alternatives are compared, the IRR for each one is calculate and each alternative should first satisfies the MARR Alternative with the highest IRR not necessary being the best If the cash flows for one or all alternatives contain expenditures only, in this case we couldn’t compute the IRR and accordingly we couldn’t compare these alternatives using the IRR In this case, the incremental rate of return (∆IRR) is computed on the difference between the alternatives Comparing Two Alternative Using the IRR 36
  • 37.
    3.RATE OF RETURNMETHOD The cash flow for the difference between the alternatives is computed by taking the higher initial cost alternative minus the lower initial cost alternative If the ∆IRR is ≥ MARR then choose the higher cost alternative Thus means that the additional invested to obtain the higher alternative is superior to invest it elsewhere at the MARR If the ∆IRR is ≤ MARR then choose the lower cost alternative Comparing Two Alternative Using the IRR 37
  • 38.
    3.RATE OF RETURNMETHOD Example: You are given the choice of selecting one of two alternatives. The cash flows of the alternatives as shown in the following table. If the MARR is 6%, which one you select? Year Alternative 1 Alternative 2 0 -10 -20 1 +15 +28 38 Comparing Two Alternative Using the IRR
  • 39.
    3.RATE OF RETURNMETHOD Normally, we select the lesser-cost alternatives (alternative 1), unless we find the additional cost of alternative 2 produces sufficient additional benefits that we would prefer. So, we will evaluate the difference project. Year Alternative 1 Alternative 2 Alt. 2 – Alt. 1 0 -LE10 -LE20 -20 – (-10) = -10 1 +15 +28 28 – 15 = +13 39 Comparing Two Alternative Using the IRR
  • 40.
    3.RATE OF RETURNMETHOD PWcost = PWbenefit 10 = 13(P/F, i%, 1) (P/F, i%, 1) = 10/13 = 0.7692; then i = 30 Then, choose alternative 2 Thus means that the additional LE10 invested to obtain alternative 2 is better than invest the LE10 elsewhere at 6% (MARR) 40 Comparing Two Alternative Using the IRR
  • 41.
    3.RATE OF RETURNMETHOD Explaining the previous example: Year Alternative 1 Alternative 2 0 -LE10 -LE20 1 +15 +28 IRR 50% 40% NPW LE4.15 LE6.42 41 Comparing Two Alternative Using the IRR Expenditure only
  • 42.
    3.RATE OF RETURNMETHOD Based on the NPW analysis, choose Option 2 This agrees with the rate of return analysis on the difference between the two alternatives Based on the rate of return, Option 1 has higher rate of return Our analysis is to maximize the return not the rate of return Option 1 has a 50% rate of return (return =0.5 x 10= LE5), while option 2 has a 40% rate of return on a larger investment (return = 0.4x20= LE8) 42 Comparing Two Alternative Using the IRR
  • 43.
    3.RATE OF RETURNMETHOD List the projects in order of increasing capital Check that the first project has an IRR greater than the MARR If yes, it becomes the defender, if not reject it and try remaining projects in order until one is greater than the MARR Subtract the defender’s values (first cost, annual cost, annual revenues) from the challenger and calculate the IRR of the remainder If the IRR is greater than the MARR accept the challenger as the new defender, if not reject it and compare the next alternative Continue until all alternatives have been considered Comparing Two Alternative Using the IRR 43
  • 44.
    3.RATE OF RETURNMETHOD Example: The following information showing the cash flows for two alternatives. If the MARR is 15%, which one is preferred? Comparing Two Alternative Using the IRR Alternative 1 Alternative 2 Initial cost LE8000 LE13000 Annual costs 3500 1600 Salvage value - 2000 Useful life 10 5 44
  • 45.
    3.RATE OF RETURNMETHOD The cash flow of the incremental project NPV2-1 = 0 = -5000 + 1900(P/A, i%, 10) - 11000(P/F, i%, 5) + 2000(P/F, i%, 10); then IRR2-1 = 12.65% IRR2-1 is less than MARR, then choose Alternative 1 Comparing Two Alternative Using the IRR Year Alternative 1 Alternative 2 Alt. 2 – Alt. 1 0 -8000 -13000 -5000 1-5 -3500 -1600 1900 5 - +2000 -13000 -11000 6-10 -3500 -1600 1900 10 - +2000 2000 45
  • 46.
    3.RATE OF RETURNMETHOD Example: A small company is looking at expanding its business by purchasing a small new store that will operate for 10 years before being sold and replaced with a newer larger store. Three sites have been recommended to the owner each with different costs and expected revenues based on its location. The company operates with a MARR of 15% before taxes. Rate the alternatives based on: a) PW comparison and b) IRR comparison Comparing Two Alternative Using the IRR 46
  • 47.
    3.RATE OF RETURNMETHOD Comparing Two Alternative Using the IRR SITE 1 SITE 2 SITE 3 Land Purchase Price 100,000 150,000 160,000 Renovations 40,000 40,000 60,000 Resale 125,000 155,000 175,000 Expected Revenue 125,000 195,000 300,000 Annual Power Costs 35,000 55,000 75,000 Annual O M cost 66,000 109,000 184,000 47
  • 48.
    3.RATE OF RETURNMETHOD First, determine total initial cost, net revenues and rank the sites in order of first cost Comparing Two Alternative Using the IRR SITE 1 SITE 2 SITE 3 Initial costs 140,000 190,000 220,000 Resale 125,000 155,000 175,000 Net Revenues/year 24,000 31,000 41,000 48
  • 49.
    3.RATE OF RETURNMETHOD Present Worth Comparison where i =15% Site 1: PW =-140000+125000(P/F,15,10)+ 24000(P/A, 15, 10) = -140,000 + 30,898 + 120,450 = LE11,348 Site 2: PW =-190000 +155000(P/F,15,10) + 31000(P/A, 15, 10) = -190,000 + 38,313 + 155,582 = LE3,895 Site 3: PW =-220000 +175000(P/F,15,10) + 41000(P/A, 15, 10) = -220,000 + 43,257 + 205,770 = LE29,027 Therefore select Site 3 then Site 1 and then Site 2 Comparing Two Alternative Using the IRR 49
  • 50.
    3.RATE OF RETURNMETHOD IRR Comparison Site 1: -140,000 + 125,000(P/F, i, 10) + 24,000(P/A, i, 10) = 0 By trial and error i= 16.66%, Select Site 1 since IRR MARR Incremental site 2- site 1 -50,000 + 30,000(P/F, i, 10) + 7,000(P/A, i, 10) = 0 By trial and error i= 11.69% Select Site 1 since ∆IRR MARR Incremental site 3- site 1 -80,000 + 50,000(P/F, i, 10) + 17,000(P/A, i, 10) = 0 By trial and error i= 19.79% Select Site 3 since ∆IRR MARR Comparing Two Alternative Using the IRR 50
  • 51.
    4.BENEFIT/COST RATIO METHOD TheBenefit/Cost (B/C) method is based on the ratio of the annual benefits to the annual costs for a particular project Benefits are advantages, expressed in terms of a monetary value to the owner (i.e. dollars, etc.) Disbenefits are disadvantages, expressed in terms of a monetary value to the owner (i.e. dollars, etc.) B/C = (Benefits – Disbenefits) / Costs 51
  • 52.
    4.BENEFIT/COST RATIO METHOD B/C ratio= Equivalentannual total benefits Equivalent annual total B/C ratio= Present worth of total benefits Present worth of total cost 52
  • 53.
    4.BENEFIT/COST RATIO METHOD Example (3) Theconstruction of a sewerage system is estimated to be $30,000,000. The annual operation, maintenance and repair (OMR) is $1,000,000/year. The annual income (benefit) from users is $3,500,000/year. The life of the system is 30 years and the discount rate is 5%. Annual cost of = ‐ ‐ ‐ ‐1,951,500 – 1,000,000 = -2,951,500/year. Solution: B/C = 3,500,000 / 2,951,500 = 1.186 B/C = 53,803,400 / 45,372,400 = 1.186 If B/C is greater than 1, the project is worth If B/C equals , the project is called break‐ ‐ ‐ ‐even 53
  • 54.
    4.BENEFIT/COST RATIO METHOD Ifthe B/C ratio is ≥ 1.0, this means that the extra benefit(s) of the higher cost alternative justify the higher cost If the B/C ratio is 1.0, this means that the extra cost is not justified and the lower cost alternative is selected An alternative method that can be used to compare between projects, is to subtract the costs from the benefits that is (B – C) If (B – C) is ≥ 0, this means that the project is acceptable If (B – C) ratio is 0, this means that the project is rejected 54
  • 55.
    4.BENEFIT/COST RATIO METHOD Ratherthan solving problems using present worth or annual cash flows analysis, we can base the calculations on the benefit-cost ratio, B/C The B/C is the ration of benefits to costs, or: B/C = PW of benefit / PW of costs = EUAB / EUAC ≥ 1 55
  • 56.
    4.BENEFIT/COST RATIO METHOD Example: Tworoutes are considered for a new highway, Road A, costing LE4,000,000 to build, will provide annual benefits of LE750,000 to local businesses. Road B would cost LE6,000,000 but will provide EL700,000 in benefits. The annual cost of maintenance is LE300,000 for Road A and LE320,000 for Road B. If the service life of Road A is 20 years, and for Road B is 30 years, which alternative should be selected if the interest rate is 8%? 56
  • 57.
    4.BENEFIT/COST RATIO METHOD B/C =(Benefits – Disbenefits) / Costs Given Data Road A Road B Initial Cost LE4,000,000 LE 6,000,000 Annual Benefits LE 750,000 LE 700,000 Annual Maintenance Cost LE 300,000 LE 320,000 Service Life 20 years 30 years 57
  • 58.
    4.BENEFIT/COST RATIO METHOD EUACfor Road A = 4,000,000 (A/P, 8%, 20) + 300,000 = 4,000,000 (0.10185) + 300,000 = LE707,000 EUAC for Road B = 6,000,000 (A/P, 8%, 30) + 320,000 = 6,000,000 (0.08883) + 320,000 = LE552,980 B/C for Road A = 750,000 / 707,000 = 1.06 B/C for Road B = 700,000 / 552,980 = 1.26 Choose Road B 58
  • 59.
    4.BENEFIT/COST RATIO METHOD Incase of comparing more than two alternatives, follow the same procedure for the IRR. List the projects in order of increasing capital. Calculate B/C for the first alternative. If B/C is greater than one, thus means that this alternative is acceptable and can be compared with other alternatives. If B/C is less than one, then continue with other alternative until you reach an alternative with B/C greater than 1. Compare the selected alternative from the previous step with the next alternative. 59
  • 60.
    4.BENEFIT/COST RATIO METHOD SubtractB/C for the selected one with the next alternative (difference project). If B/C for the difference project is greater than 1, then select the project with highest cost. Continue until all alternatives have been considered 60
  • 61.
    4.BENEFIT/COST RATIO METHOD Example: Twomachines are being considered for purchase. If the interest rate is 10%, which machine should be bought? Machine X Machine Y Initial cost LE200 LE700 Annual benefits 95 120 Salvage value 50 150 Useful life, years 6 12 61
  • 62.
    4.BENEFIT/COST RATIO METHOD MachineX: EUAC = 200(A/P, 10%, 6) - 50(A/F, 10%, 6) = LE40 EUAB = LE95 B/C = 95/40 = 2.37 Machine Y: EUAC = 700(A/P, 10%, 12) - 150(A/F, 10%, 12) = LE96 EUAB = LE120 B/C = 120/96 = 1.25 Calculate the incremental benefit cost ratio, ∆B/∆C (machine Y – machine X) ∆B/∆C = (120-95) / (96-40) = 0.45 Since the incremental B/C is less than 1, it represents an undesirable increment of investment. Therefore choose the lower cost alternative – machine X 62
  • 63.
    4.BENEFIT/COST RATIO METHOD Example: Acompany has decided to build a factory on a particular site. There are two mutually exclusive proposals that have been developed for the main factory. There are also three secondary proposals for the main project. The present worth of the benefits and costs are shown below. Which combinations of projects are best if the company can only spend LE400,000? 63
  • 64.
    4.BENEFIT/COST RATIO METHOD Main Proposals ProjectBenefits Costs B/C A 300,000 150,000 2.0 B 450,000 250,000 1.8 Secondary Proposals Project Benefits Costs 1 75,000 50,000 2 140,000 100,000 3 300,000 150,000 64
  • 65.
    4.BENEFIT/COST RATIO METHOD All thepossible combinations with cost less that LE400,000 are ranked in order in the following table: Combination Benefits Costs B-C B/C I (A, 1, 2) 515,000 300,000 215,000 1.72 II (A, 3) 600,000 300,000 300,000 2.0 III (A, 1, 3) 675,000 350,000 325,000 1.93 IV(A, 2, 3) 740,000 400,000 340,000 1.85 V (B, 1, 2) 665,000 400,000 265,000 1.66 VI (B, 3) 750,000 400,000 350,000 1.87 65
  • 66.
    4.BENEFIT/COST RATIO METHOD Sinceall B/C ratios are greater than one, then we will compare all alternatives Since alternatives I and II have the same costs while benefits of alternative II is greater, then choose II III-II: ∆B/∆C =(675,000–600,000)/(350,000–300,000) = 1.333 Accept III IV-III: ∆B/∆C =(740,000– 675,000)/(400,000 – 350,000) = 1.3 Accept IV 66
  • 67.
    4.BENEFIT/COST RATIO METHOD Sincealternatives V and IV have the same costs while benefits of alternative IV is greater, then choose IV VI-IV Since both alternatives VI and IV have the same costs while benefit of alternative VI is greater, the Accept VI 67
  • 68.
    5.PAYBACK PERIOD METHOD Paybackperiod is defined as “the period of time required for the profit or other benefits from an investment to equal the cost of the investment” The criterion in all situations is to minimize the payback period This method concerns with determining the number of years or months (the time) required to recover all the invested money When comparing between alternatives using this method, the alternative with the least payback period is selected 68
  • 69.
    5.PAYBACK PERIOD METHOD Example: Acompany has decided to buy new equipment for a project with 4-year duration. There are two different equipment can be used for this project. The cash flows of those types are shown in the table below. What is the payback period for each equipment and which one should be selected? Year Cash flows Equipment A Equipment B 0 -LE35,000 -LE35,000 1 20,000 10,000 2 15,000 10,000 3 10,000 15,000 4 10,000 20,000 69
  • 70.
    5.PAYBACK PERIOD METHOD To findthe payback period, find the time at which the cumulative cash flows equal zero The payback period for equipmentA is 2 years, while it is 3 years for equipment B. Accordingly, Equipment A will be selected Year Cumulative cash flows Equipment A Equipment B 0 -LE35,000 -LE35,000 1 -15,000 -25,000 2 0 -15,000 3 10,000 0 4 20,000 20,000 70
  • 71.
    5.PAYBACK PERIOD METHOD Advantages: Easyto use Uses all the available cash flow Reduce the possibility of risk on projects as it selects the project with the least payback period Well known economic evaluation method Concerns on using the payback period method: It is an approximate economic analysis method It does not consider the time-value of money Economic consequences beyond the payback period are ignored It is not suitable for long-life projects as the actual cash flows may differ than that was expected at the time of analysis 71
  • 72.
    5.PAYBACK PERIOD METHOD Oneof the disadvantages of the payback period is that it ignores the time value of money. This drawback could be overcome by considering the time value of money, by determining the PW of both the costs and the revenues and equating them to find the payback period 72
  • 73.
    5.PAYBACK PERIOD METHOD Example: Calculatethe payback period for the following two alternatives shown in the next table if the investment rate is 15%. Which one do you recommend? Let’s assume that the payback period is n years. So, it is required to find n where the PW of cost equals the PW of benefits. PWcost = PWbenefits Alternate 1 Alternate 2 Initial cost LE12000 LE8000 Annual benefits 3000 1500 Useful life, years 7 15 73
  • 74.
    5.PAYBACK PERIOD METHOD Alternative1: 12000 = 3000(P/A, 15, n1) Then, (P/A, 15, n1) = 4 From the interest table, n1 lie between year 6 and year 7. By interpolation n1 = 6.6 years Alternative 2: 8000 = 1500(P/A, 15, n2) Then, (P/A, 15, n2) = 5.33 From the interest table, n2 lie between year 11 and year 12 By interpolation n2 = 11.5 years Based on these results, alternative 1 will be selected as it has a shorter payback period 74
  • 75.
    5.PAYBACK PERIOD METHOD Analyzingthis example: There is no return for the investment (IRR = 0) in alternative 1. While the IRR for alternative 2 will be greater than zero as there is still some returns after the payback period To overcome this problem, we may compare the payback period over the useful life of each alternative and select the smaller ratio. Applying this for the previous example: n1/useful life 1 = 6.6/7 = 0.94 n2/useful life 2 = 11.5/15 = 0.77 Based on this comparison, select alternative 2 75
  • 76.
    INFLATION Inflation isan important concept in any economic analysis because the purchasing power of money rarely stays constant. Over time, the amount of goods and services that can be purchased with a fixed amount of money tends to change (always decline). When prices inflate, we can buy less with the same amount of money So, it is important to incorporate the effect of inflation in analysis of alternatives When the purchasing power of money increase, this is named deflation. Deflation has an opposite effect to inflation. 76
  • 77.
    INFLATION Inflation rate(f): The inflation rate captures the decrease in the purchasing power of the currency Interest rate (i): This is the interest rate measuring the real growth of money without the effect of inflation Market interest rate (i’): The combined interest rate that combines both the real money growth and inflation. …… This is named as the inflated interest rate 77
  • 78.
    INFLATION When calculatingthe investment of a given some of money, it is multiplied by (1 + i) Considering the inflation effect, it is multiplied also by (1 + f) Or, this sum of money is multiplied by (1 + i’) which combines both the effect of interest and inflation. Accordingly, the relation could be derived as follows: (1 + i’) = (1 + i)(1 + f) = 1 + i + f + if Then, i’ = i + f + if 78
  • 79.
    INFLATION Example: Whatis the amount of money a company should save now to buy a new equipment costs LE65,000 after three years from now. The interest rate is 13% and the inflation rate is 7%. i’ = i + f + if = 0.13 + 0.07 + (0.13 × 0.07) = 0.2091 = 20.91% P = F / (1 + i’)n = 65000 / (1 + 0.2091)3 = LE36,773 79
  • 80.
    INFLATION Example: Whichof the following revenues is preferred, if the interest rate is 12% and the inflation rate is 11%? LE60,000 now. LE16,000 annually starting one year from now for a period of 12 years. LE50,000 after three years from now and LE80,000 after 5 years from now. 80
  • 81.
    INFLATION i’ =i + f + if = 0.12 + 0.11 + 0.12 × 0.11 = 0.243 = 24.3% Pa = LE60,000 Pb = A[ ((1 + i’)n – 1)) / (i’(1 + i’)n )] = 16000 [(1.24312 -1) / 0.243(1.24312)] = LE61,003 Pc = 50000 / (1.243)3 + 80000 / (1.243)5 = LE52,996 Then, option b is preferred 81
  • 82.
    82 P = F/ (1 + i)n F = P(1 + i)n       − + = i i A F n 1 ) 1 (       − + = 1 ) 1 ( n i i F A       + − + = n n i i i A P ) 1 ( 1 ) 1 (       − + + = 1 ) 1 ( ) 1 ( n n i i i P A       − − + = n i i i G F n 1 ) 1 (       + − − + = n n i i in i G P ) 1 ( 1 ) 1 ( 2       − + − = 1 ) 1 ( 1 n i n i G A
  • 83.
    QUESTIONS DR. AHMED ELYAMANY EMAIL:DRAHMEDELYAMANY@YAHOO.COM WEB PAGE: HTTP://DRAHMEDELYAMANY.WEEBLY.COM/ 83