Download as PDF, PPTX


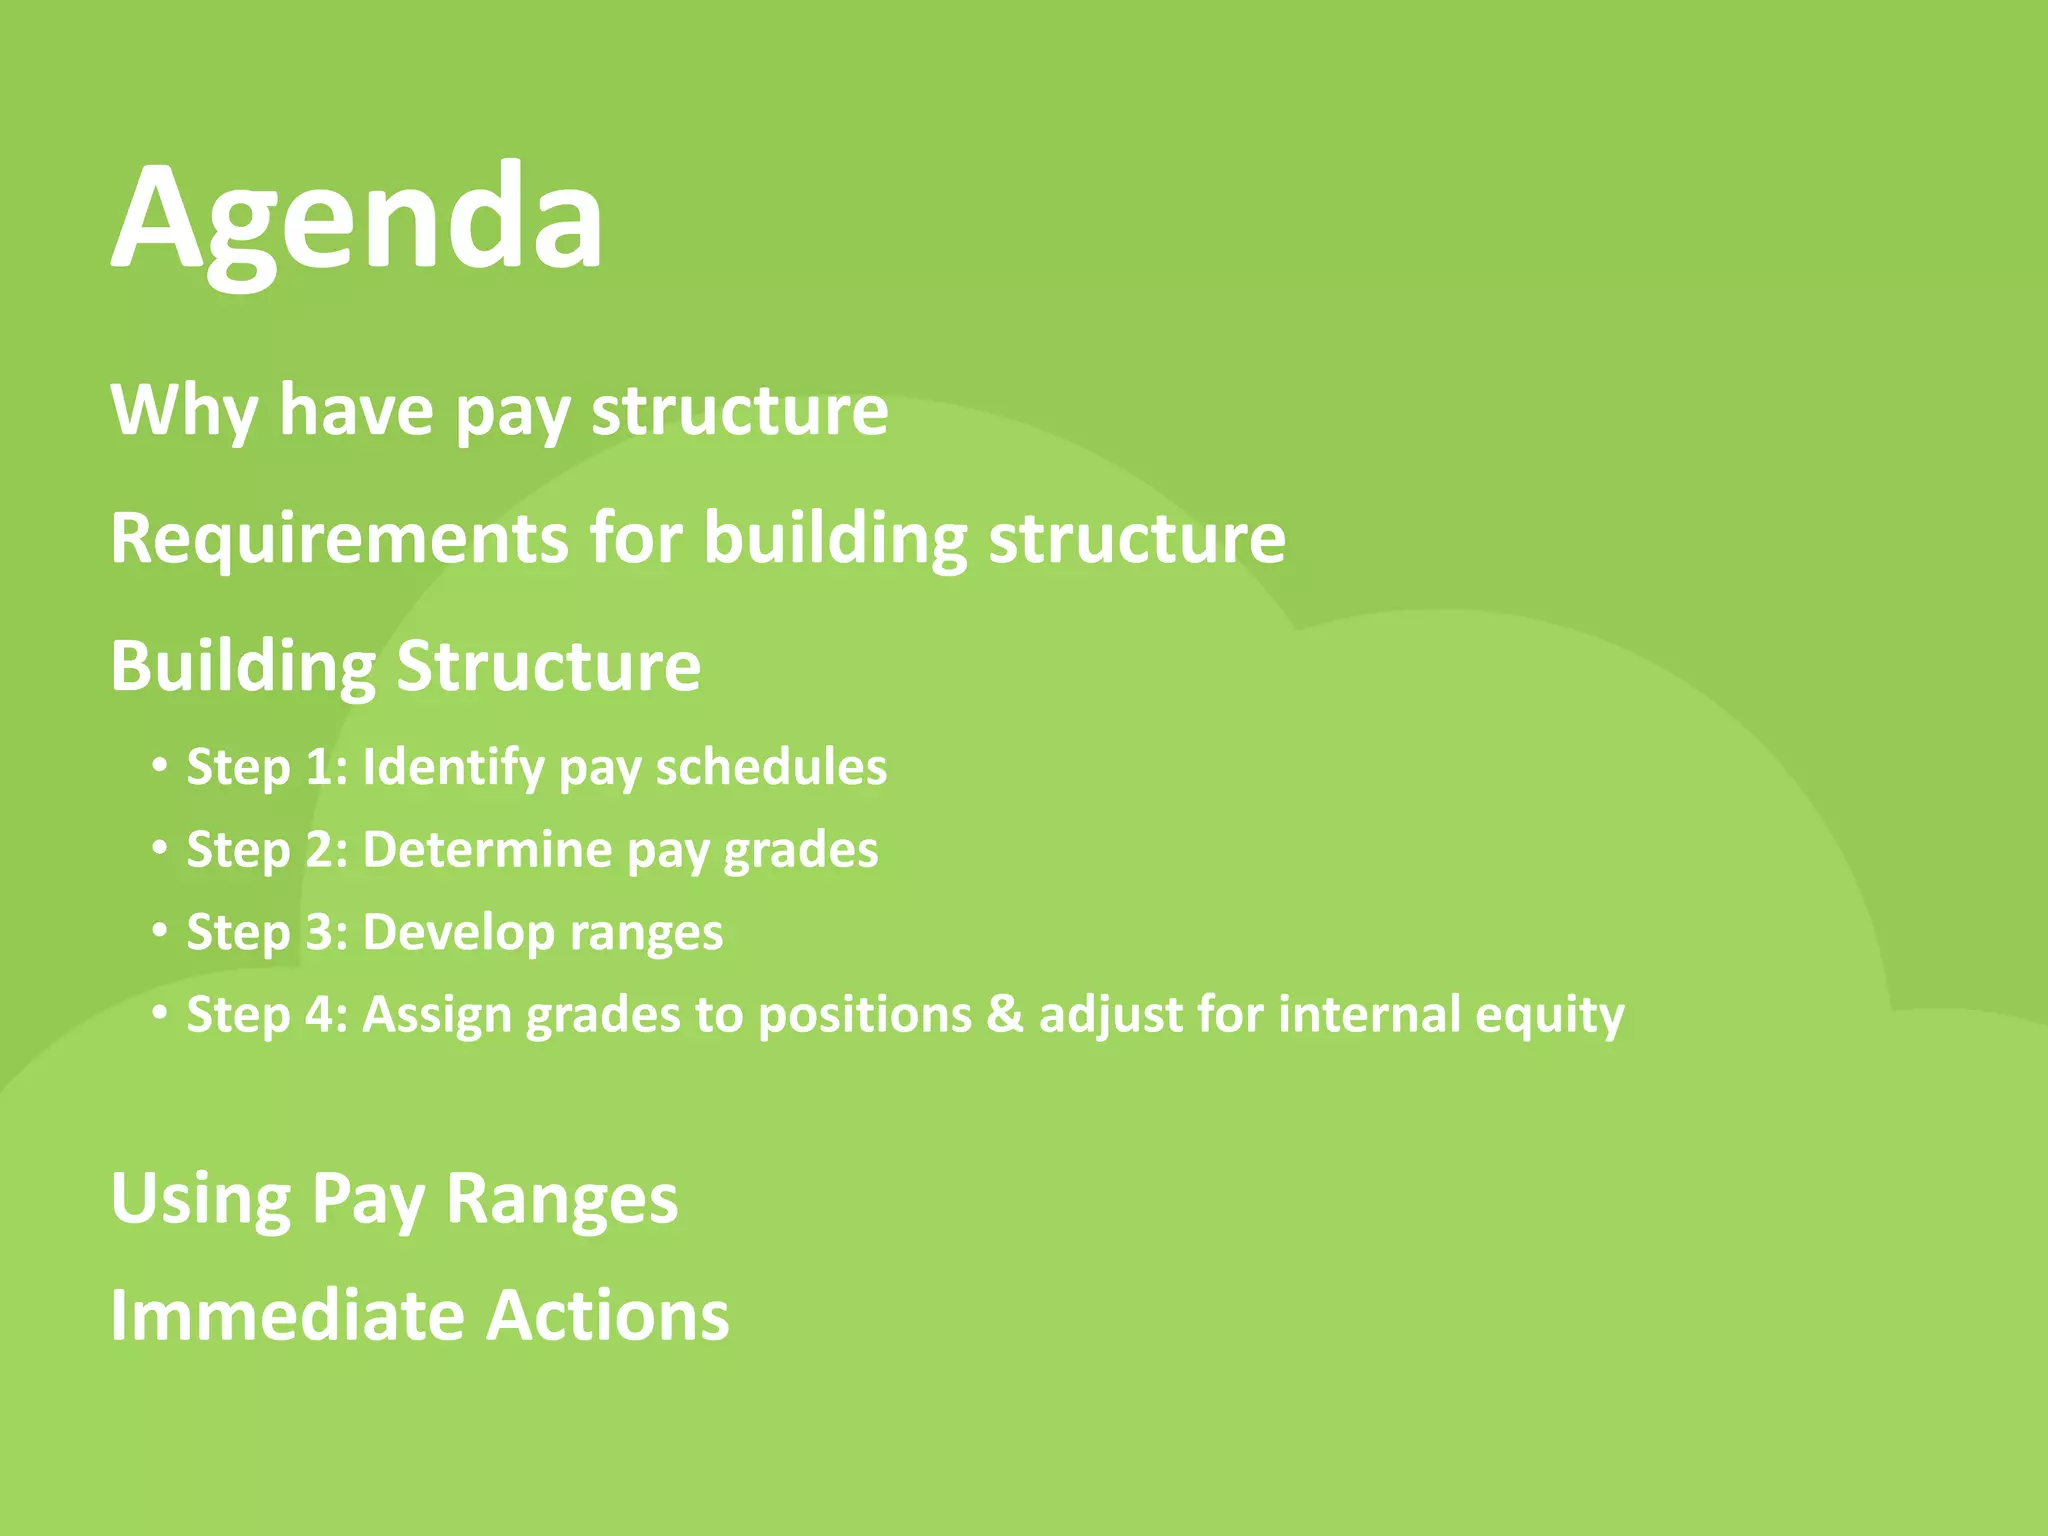
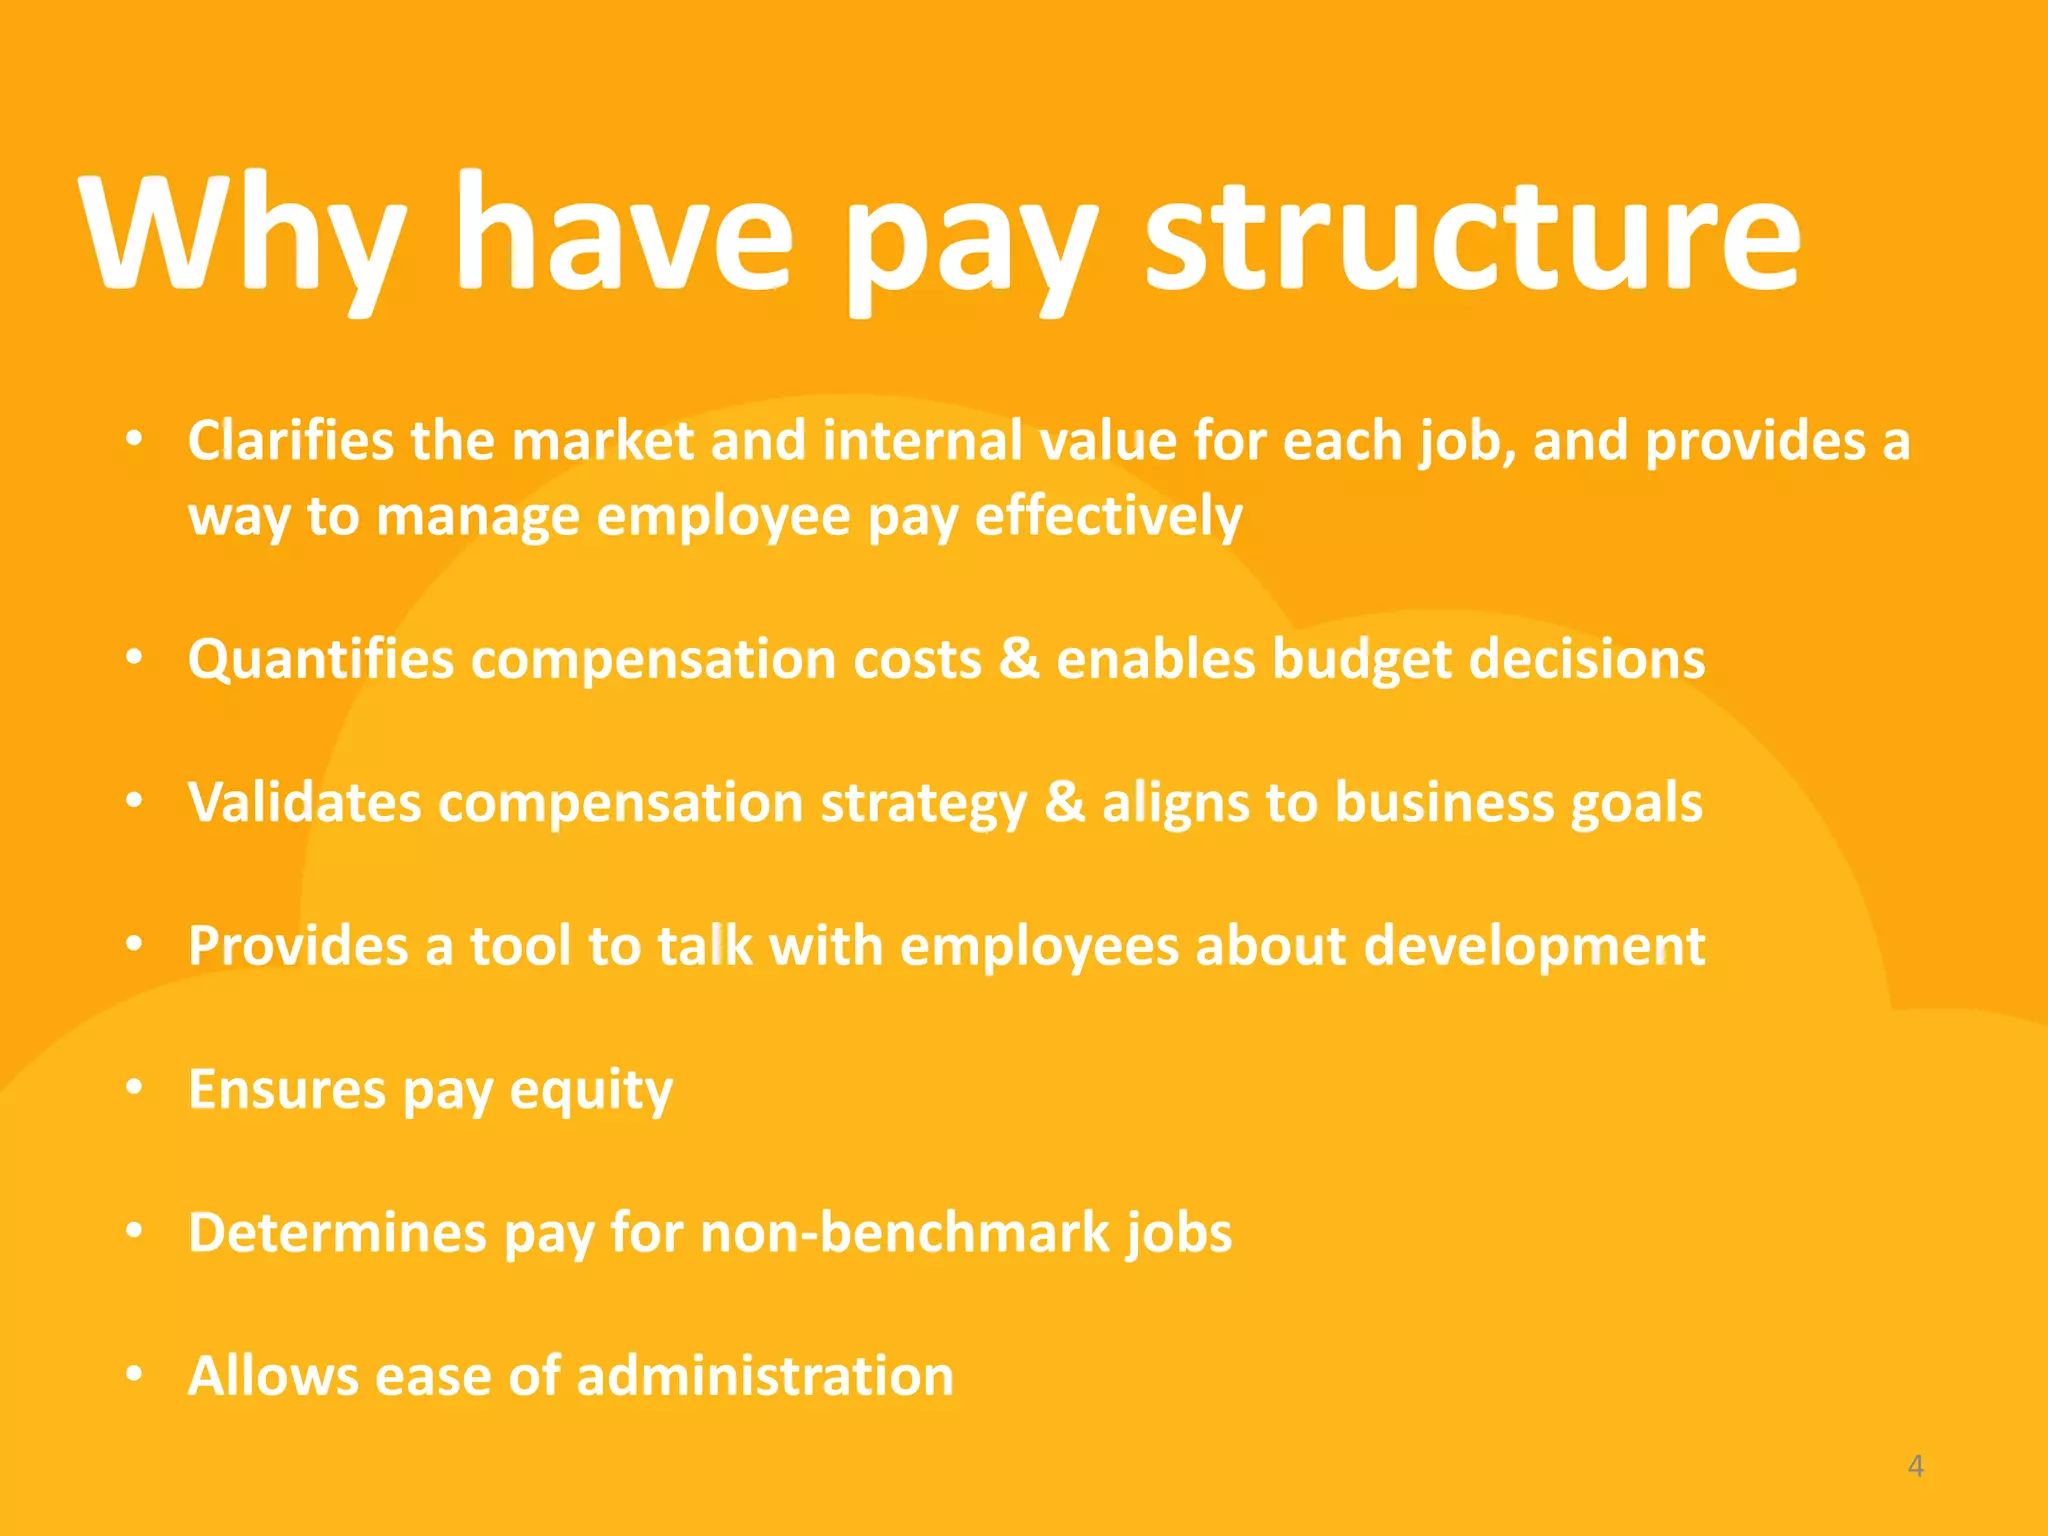
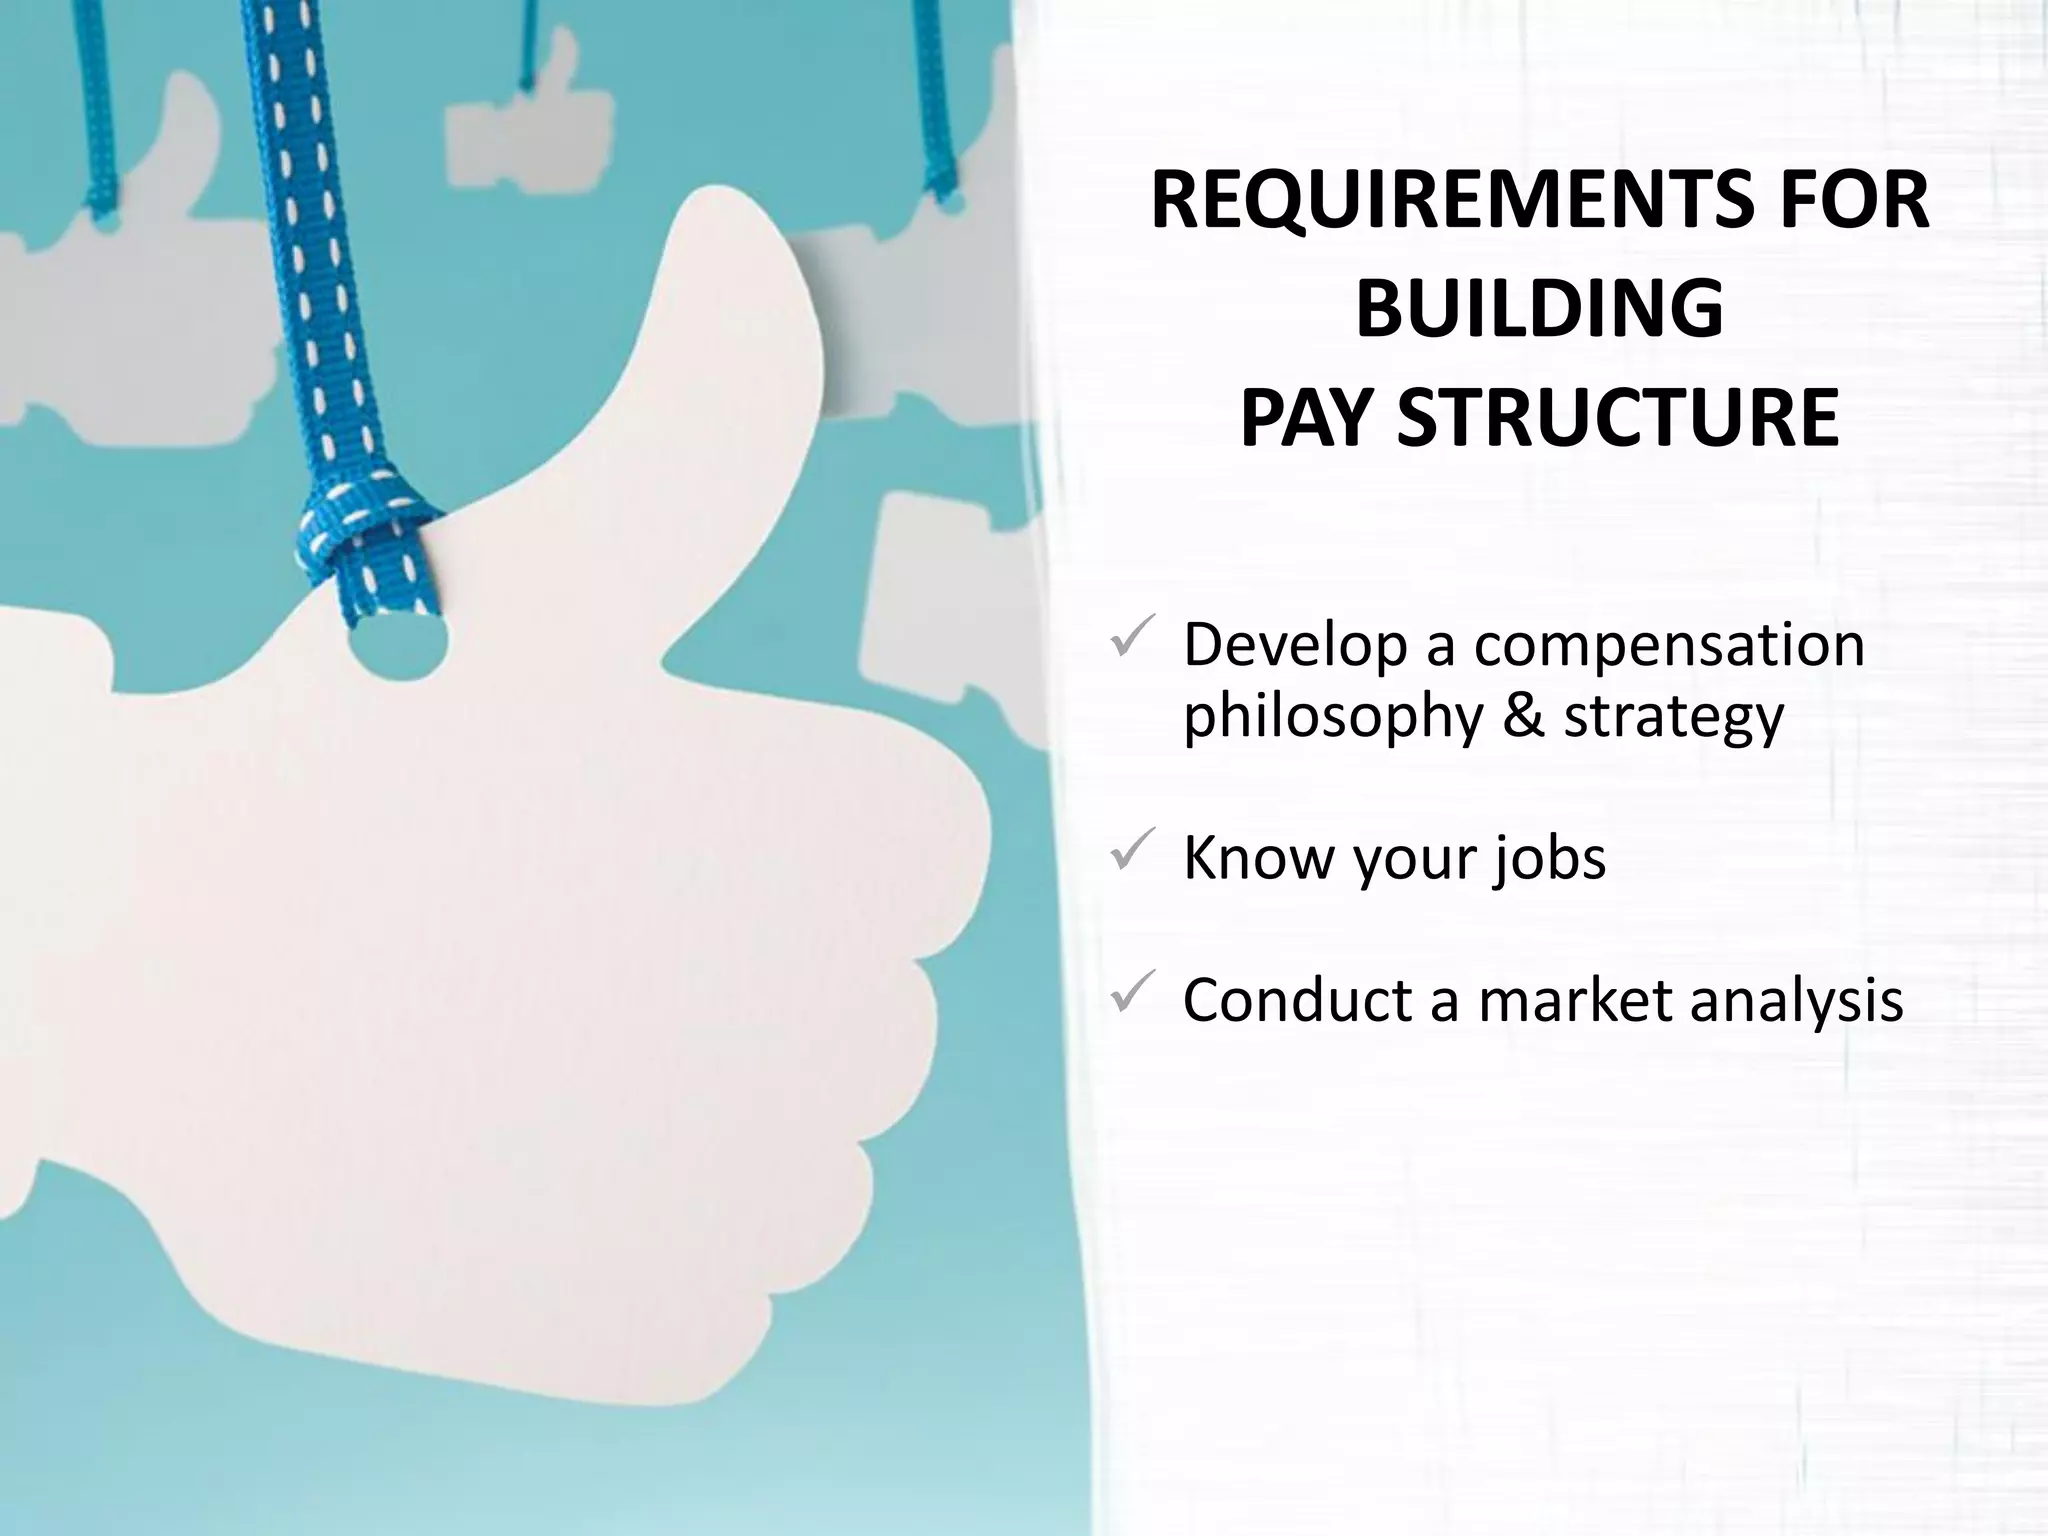
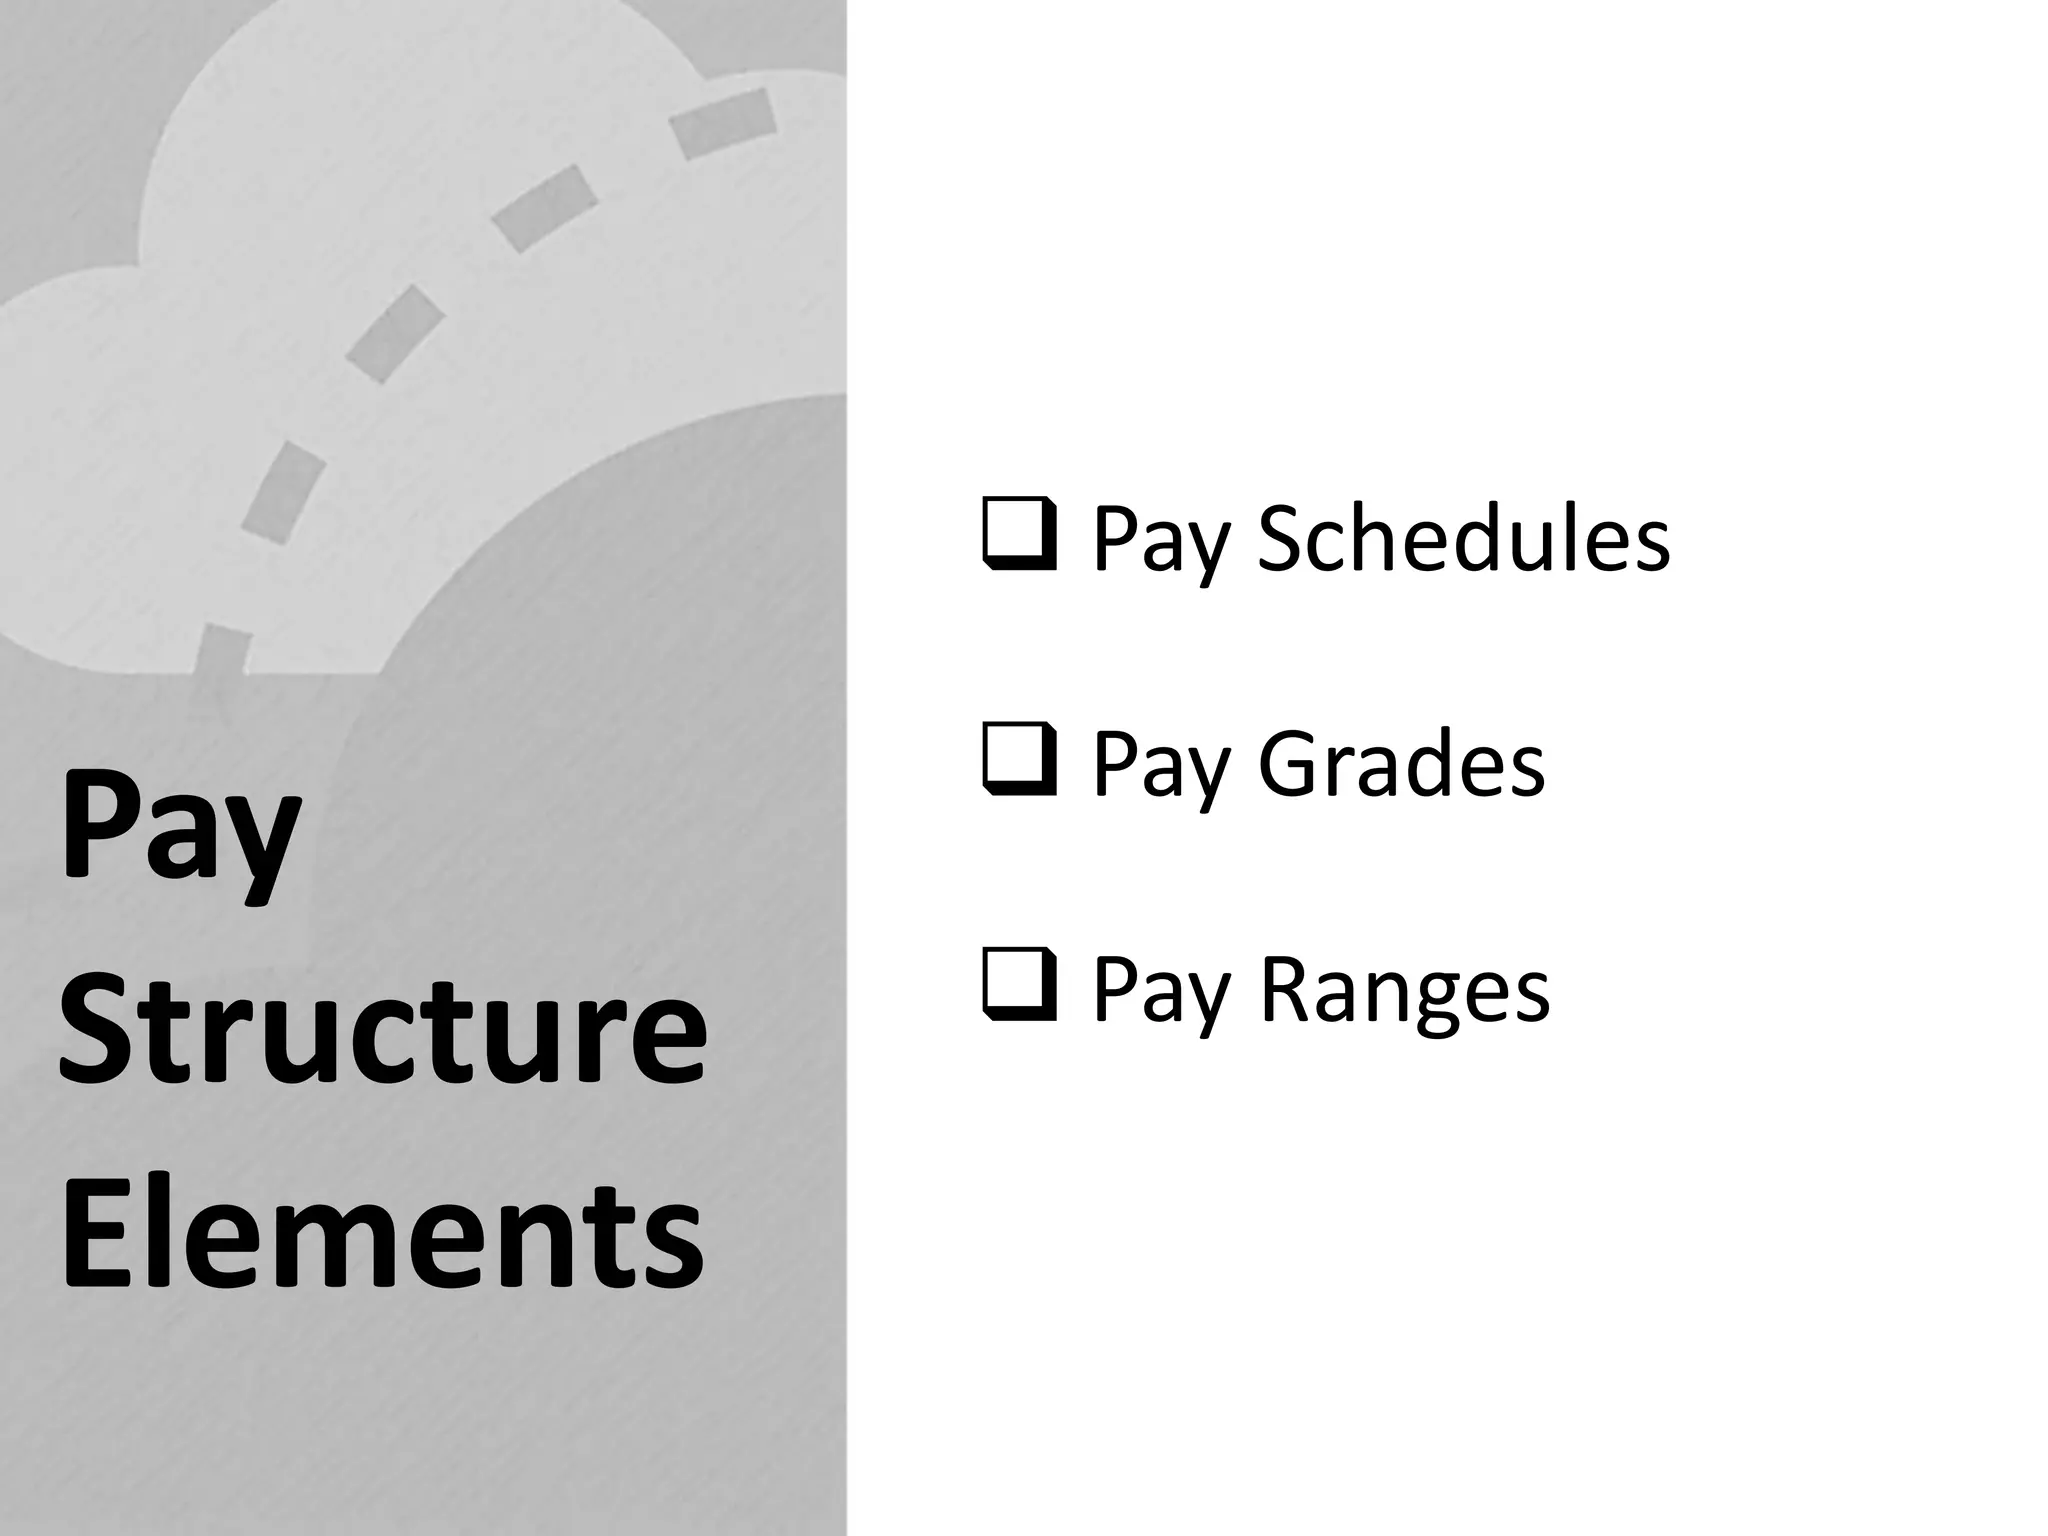


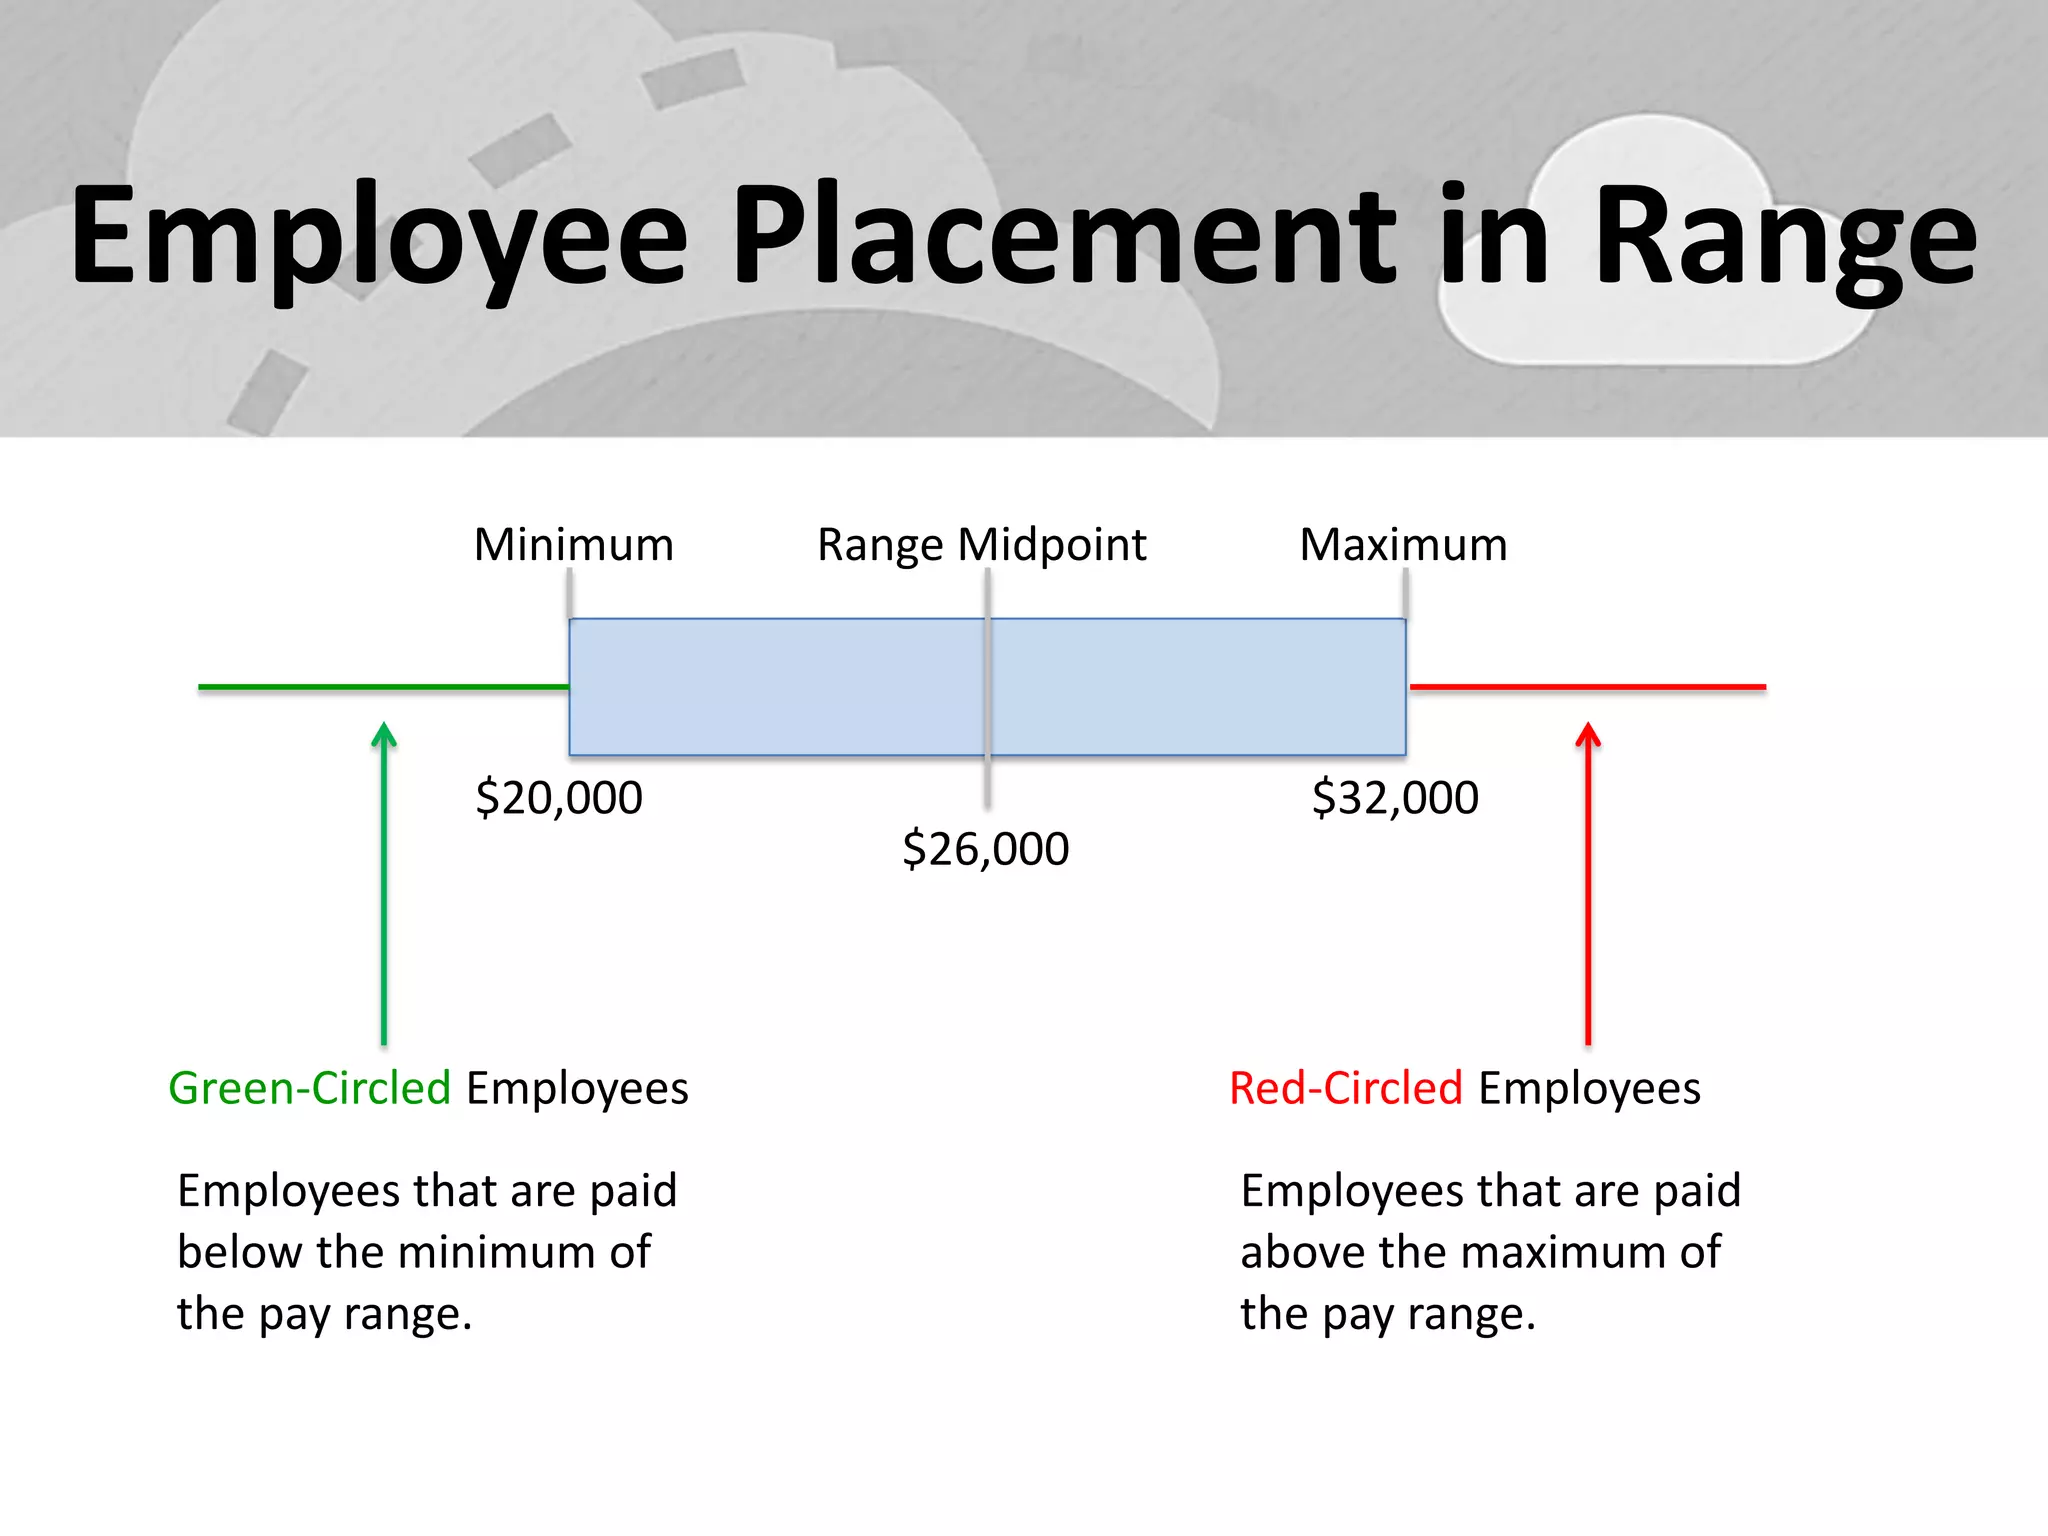
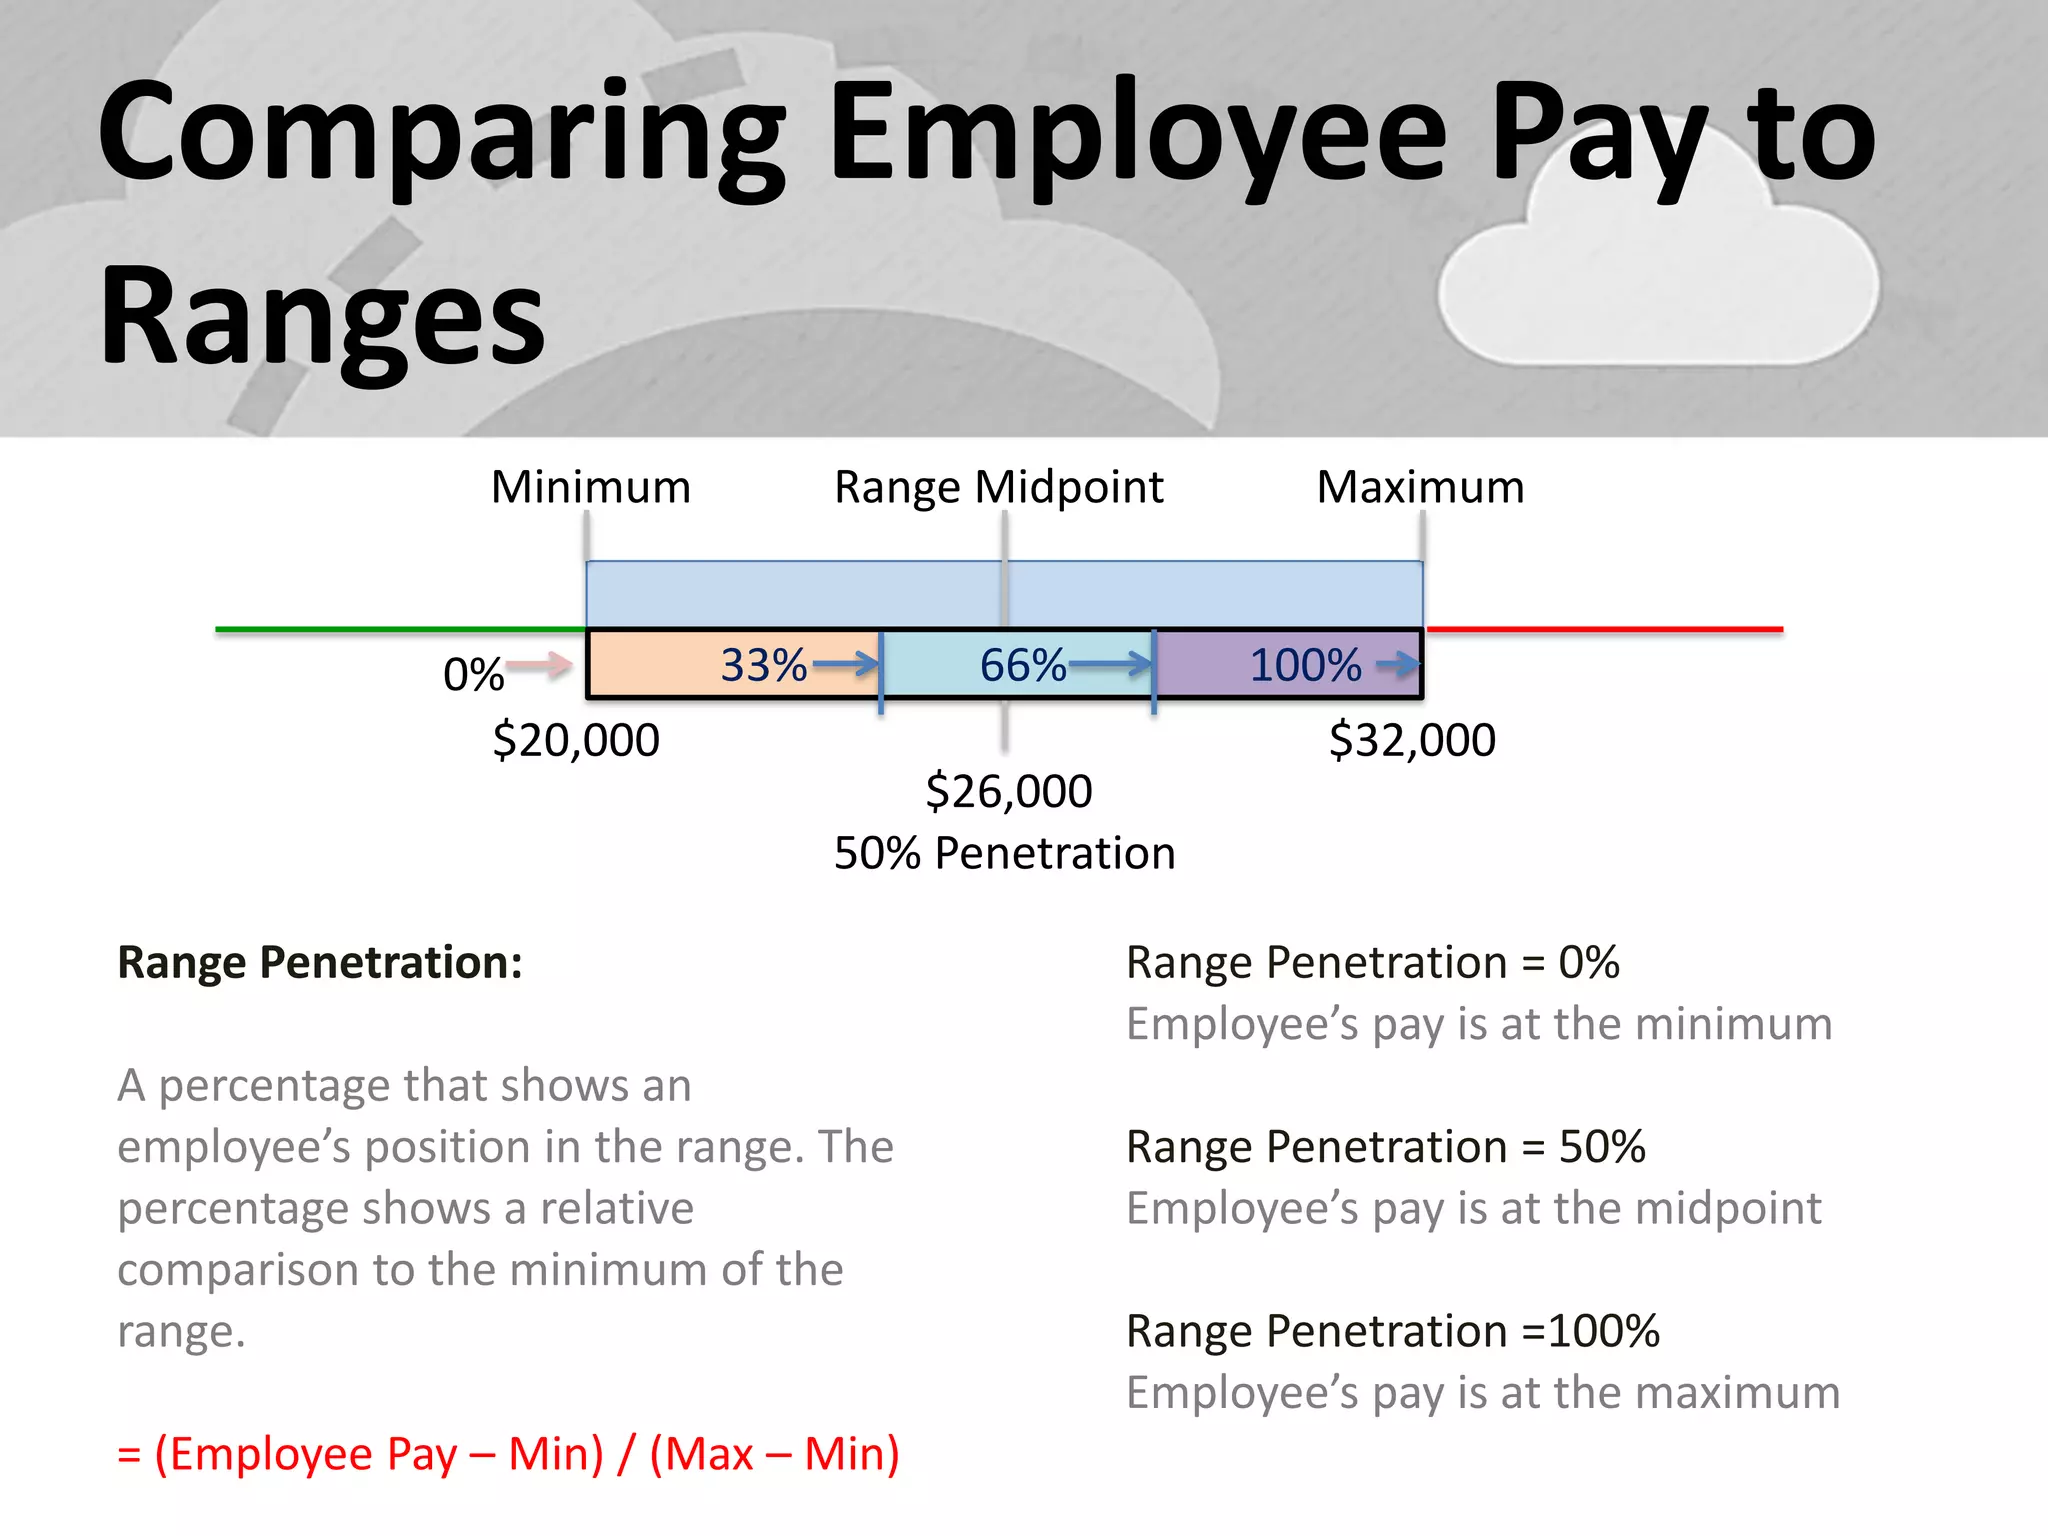


The document outlines a four-step process for building a smart compensation structure, including identifying pay schedules, determining pay grades, developing pay ranges, and ensuring internal equity. It emphasizes the importance of a clear pay structure for managing employee compensation, aligning it with business goals, and promoting pay equity. Additionally, it provides guidance on analyzing job responsibilities and market data to support compensation decisions.