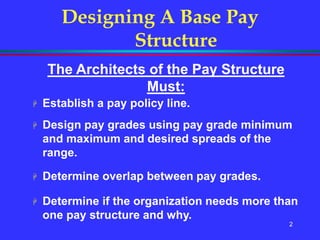
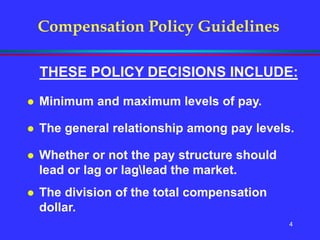
SlideShare a Scribd company logo
1 of 48
1
Designing A Base Pay
Structure
After determining internal equity
relationships among jobs, and
Identifying competitive pay practices
in the market place,
The next order of business is the
design of a pay structure.
2
Designing A Base Pay
Structure
The Architects of the Pay Structure
Must:
 Establish a pay policy line.
 Design pay grades using pay grade minimum
and maximum and desired spreads of the
range.
 Determine overlap between pay grades.
 Determine if the organization needs more than
one pay structure and why.
3
Compensation Policy Guidelines
Decisions that provide
guidelines for the compensation
manager to follow in developing
a pay structure are made at the
highest levels of the
organization.
4
Compensation Policy Guidelines
THESE POLICY DECISIONS INCLUDE:
 Minimum and maximum levels of pay.
 The general relationship among pay levels.
 Whether or not the pay structure should
lead or lag or laglead the market.
 The division of the total compensation
dollar.
5
Compensation Policy Guidelines
Additionally
Senior management decides how best
to administer its pay policies. How
much, to whom, when, where and
how.
6
Pay Structure Design
Questions and Issues
 What is the lowest rate of pay that can be
offered and still hire desirable employees ?
 What is the rate of pay necessary to retain
employees ?
 Will the organization want to recognize
seniority and merit through the base pay
schedule ?
7
Pay Structure Design
Questions and Issues
 Is it wise or necessary to offer more than
one rate of pay to employees performing
either identical or similar kinds of work ?
 What is considered to be a sufficient
difference in base rates of pay among jobs
in a class-series that requires varying levels
of knowledge, skills, responsibilities, and
duties.
8
Pay Structure Design
Questions and Issues
 Does the organization wish to recognize
dangerous working conditions in its base
pay schedule ?
 Should there be a difference in changes in
base pay progression opportunities
among jobs of varying worth ?
9
Pay Structure Design
Questions and Issues
 Do employees have a significant
opportunity to progress to higher level
jobs ? If so, what should be the
relationship between promotion to a
higher job and changes in base pay ?
 Will policies and regulations permit
incumbents to earn rates of pay higher
than established maximums and lower
than established minimums ? What
should be the reasons for allowing
such deviations ?
10
 How will the pay structure accommodate
across-the-board, cost-of-living, or other
adjustments not related to employee
tenure, performance, or responsibility
and duty changes ?
Pay Structure Design
Questions and Issues
11
Pay Structure Architecture
With the generation of internal and
external pay data and information,
managers are now ready to design a
pay schedule.
 To do so they must:
 Determine a trend or pay policy line.
 Decide on the need for one or more
pay structures.
12
Pay Structure Architecture
 Display job data
 Establish the characteristics of the
pay structure (number, width, and
height of pay grades, and overlap)
 Lock overlapping pay structures
(when using more than one)
13
Determining A Pay Policy Line
Each organization must develop its
own pay policy line, which is a trend
line or line of best fit that best
represents the middle value of jobs
that have been evaluated or
classified to have particular worth.
14
Determining A Pay Policy Line
 The procedure most organizations follow in
establishing a pay policy or trend line is to
identify the market rates for various
benchmark jobs that cover the entire
spectrum from lowest to highest rates of
pay.
 By plotting on a chart the pay-rate
information obtained through surveys, a
scatter diagram or scatter plot can be
developed.
15
Determining A Pay Policy Line
 Different procedures are available for
developing a trend line from a scatter
diagram...Line of sight...Two-point...
 And the least squares methods.
 Another simple procedure is to obtain the
market rate or going rate of pay for the lowest
and highest paid jobs. Connecting these
points can also provide a first approximation
for a pay policy line.
16
Determining A Pay Policy Line
 Many organizations use the pay policy line
to set midpoint values for all their jobs.
 Pay policy lines are useful when plotting
survey data and comparing them with the
internal pay structure.
 From the pay policy line, organizations
establish the minimum and maximum pay
levels, the relationship between pay grades,
and the range of a pay grade.
17
 There are a number of logical and
rational considerations for having
multiple pay structures that focus on
the forces that influence the actual pay
of the various occupational groups
comprising most organizations.
The Need For More Than One Pay
Structure
18
 A major reason for using
multiple pay structures is that
rates of pay for more advanced
jobs increase geometrically
rather than linearly.
The Need For More Than One
Pay Structure
19
The Need For More Than One
Pay Structure
 It is not unusual for large organizations
to have at least three pay structure
lines:
 Blue collar manual labor, craft, and trade
workers.
 Nonexempt white collar salaried workers.
 Managerial, administrative, and
professional exempt employees.
20
 Some organizations have a
fourth pay structure for their
highly paid executives.
The Need For More Than One
Pay Structure
21
 Even when there is an apparent need
for more than one trend line or pay
policy line that would lead to more
than one pay structure, there is a
statistical procedure for avoiding
multiple structures.
Displaying Job Data
22
Displaying Job Data
 This procedure allows pay data to be
presented by means of some form of
curvilinear relationship rather than a
relationship that must be a straight line.
 A pay structure using arithmetic
progression will produce a straight pay
police line.
23
Displaying Job Data
 Geometric progression where pay rates
vary by some constant rate of increase
will produce a curved pay policy line.
 To display a geometric progression in a
straight line a logarithmic scale is used.
24
Displaying Job Data
 Two values of central tendency most used
in analyzing pay relationships are the:
 Mean
 Median
 When the market value or going rate of a
job is being determined, the average value
or mean is frequently the value selected.
25
Displaying Job Data
But it is not always the best
choice...
In the final analysis it depends on
the distribution of the data.
26
Identifying The Lowest And
Highest Rates Of Pay
 In identifying the lowest rate of pay it
is important to pay attention to:
 Legal requirements.
 The prevailing union scales in local
markets.
 All area wage scales.
27
Identifying The Lowest And
Highest Rates Of Pay
 A high low-end rate pushes all rates
too high.....And a low low-end rate
promotes to much turnover.
 Highest rates of pay are a more
subjective consideration.
28
Identifying The Lowest And
Highest Rates Of Pay
 The highest and lowest average
values should be the midpoint of the
pay for those jobs assigned this rate
when there is a range of pay
available for each category.
29
 The basic design criterion that determines
pay differences in moving through a pay
structure is the midpoint-to-midpoint
differences.
 Midpoint-to-midpoint pay difference is the
percentage change in the middle value from
one adjacent pay grade to the next.
Determining Progression From Lowest
To Highest Pay Rate
30
 Midpoint-to-midpoint pay
progressions range from as low as
3% to as high as 25%. and possibly
higher is some cases.
Determining Progression From Lowest
To Highest Pay Rate
31
Determining Progression From Lowest
To Highest Pay Rate
 Normally, low midpoint-to-midpoint
differences are found in pay structures
of lower-paid, unskilled, semiskilled,
and clerical employees.
 High differences are found in pay
structures of the executives and the
senior managers of an organization.
32
Determining Progression From Lowest
To Highest Pay Rate
 The following issues should be considered
when determining the appropriate midpoint-
to-midpoint differences:
 The smaller the difference between
midpoints the more pay rates available to
assign to a specific job.
 The more rates of pay the more opportunity
for assigning different rates of pay to jobs
with minor differences.
33
Determining Progression From Lowest
To Highest Pay Rate
 The greater the differences between
pay rates the easier it is for
jobholders to perceive differences in
worth between jobs.
 A small difference between
midpoints may force an organization
to have more than one pay structure.
34
Determining Progression From Lowest
To Highest Pay Rate
 For jobs at the lower end of the pay
structure, a 6% to 7.5% difference in
midpoints may be appropriate;
 For those in the middle of the pay
structure an 8% to 10% difference would
typically apply; and
 At the executive end of the structure the
difference would normally range from 15%
to 25%.
35
Developing Pay Grades
 Pay grades are nothing more than
convenient groupings of a wide
variety of jobs or classes similar in
work difficulty and complexity
requirements but possibly having
nothing else in common.
36
Developing Pay Grades
 It may provide for a single rate, or it may
allow for a range of pay within a certain
grade.
 The top or maximum rate of pay of a pay
grade states that this is the most that work
produced by a job in this grade is worth to
the organization.
 The bottom places a minimal value on the
contributions of the assigned job.
37
Developing Pay Grades
 The distance between minimum and
maximum recognizes the range of
performance and experience of
incumbents in the assigned job(s).
38
General Characteristics
Of Pay Grade Systems
 Each grade provides for a range of pay.
 Within a pay grade range there is a
minimum, a midpoint, and a maximum pay.
 The range from the minimum to the
maximum within a single pay grade may
vary from 20 to 100 percent. The most
common range is from 30 to 50 percent.
39
General Characteristics
Of Pay Grade Systems
 The number of steps within a grade may
also vary. Grades having steps will
normally have from 3 to 10 steps, with 6
to 7 in-grade steps most common.
 There is a direct relationship between the
rate of increase per step and the number
of steps within a grade.
40
General Characteristics
Of Pay Grade Systems
 The midpoint of each pay grade is
normally a constant percentage greater
than the one preceding it. This percentage
normally varies from 5 to 10 percent.
 Adjoining pay grades normally overlap. If
there is a 30 percent range within a pay
grade and there is a 10 percent difference
between midpoints, there will be a 67
percent overlap.
41
General Characteristics
Of Pay Grade Systems
 The requirements of the
organization will provide answers
to the correct number of grades,
the number of steps within
grades, and their rates of
progression within and between
grades.
42
General Characteristics
Of Pay Grade Systems
The number of pay grades to be
included within a pay structure
varies with the circumstances--
there is no right number.
43
Pay Structure Terms
 Single-Rate Pay Grade
 A flat rate structure that appears
in organizations in which pay rate
negotiations between
management and unions are
common practice, in some small
organizations, or in industries
using skilled craftworkers.
44
Pay Structure Terms
 Multiple-Point Pay Structure
 Some organizations that use point-
factor job evaluation plans
establish a rate of pay for every
possible point score.
45
Pay Structure Terms
 Broadbanding
 The grouping of jobs of
significant differences or worth
or value within one band or pay
grade.
46
Pay Structure Terms
 Broadbanding (cont)
 This pay grouping or expanded
pay grade may have a range
varying from 50 percent to 100
percent and include jobs that
have responsibilities and duties
that vary in complexity and
difficulty and require significantly
different knowledge and skills.
47
Pay Structure Terms
 Range or Spread Dimension
 The difference between the upper
and lower limits of the grade. It
may be expressed in absolute
dollar amounts or as a percentage.
48
Pay Structure Terms
 Pay Grade Width
 Procedures for establishing a pay
grade width are not as specific or
precise as those related to the
spread or height of the pay grade.
 When using a point-factor plan,
points often are the x axis values.

More Related Content

Similar to Work structure and pay structure - HRM

Pay structure decisions presentation
Pay structure decisions presentationPay structure decisions presentation
Pay structure decisions presentationEdchel Sorianosos
 
Chapter 6 implementing and managing pay system
Chapter 6 implementing and managing pay systemChapter 6 implementing and managing pay system
Chapter 6 implementing and managing pay systemmilamilamila00
 
Global Sales Compensation Mix
Global Sales Compensation MixGlobal Sales Compensation Mix
Global Sales Compensation Mixsilvychahal
 
9 Salary Surveys A Snapshot Market data obtained from salary surv.docx
9 Salary Surveys A Snapshot Market data obtained from salary surv.docx9 Salary Surveys A Snapshot Market data obtained from salary surv.docx
9 Salary Surveys A Snapshot Market data obtained from salary surv.docxsleeperharwell
 
Project report on compensation and benefits
Project report on compensation and benefitsProject report on compensation and benefits
Project report on compensation and benefitssukesh gowda
 
certified compensation and benefits manager sample-material
certified compensation and benefits manager sample-materialcertified compensation and benefits manager sample-material
certified compensation and benefits manager sample-materialVskills
 
Building market competitive compensation
Building market competitive compensationBuilding market competitive compensation
Building market competitive compensationAkshay Pandey
 
Webinar - Closing the Gap: How Organizations are Making Fair Pay a Reality
Webinar - Closing the Gap: How Organizations are Making Fair Pay a RealityWebinar - Closing the Gap: How Organizations are Making Fair Pay a Reality
Webinar - Closing the Gap: How Organizations are Making Fair Pay a RealityPayScale, Inc.
 
6 Cutting-Edge HR Metrics to Measure in 2019
6 Cutting-Edge HR Metrics to Measure in 20196 Cutting-Edge HR Metrics to Measure in 2019
6 Cutting-Edge HR Metrics to Measure in 2019Namely
 
Chapter EighteenManagement Making It WorkChapter OutlineMan.docx
Chapter EighteenManagement Making It WorkChapter OutlineMan.docxChapter EighteenManagement Making It WorkChapter OutlineMan.docx
Chapter EighteenManagement Making It WorkChapter OutlineMan.docxchristinemaritza
 
Salary survey c level-2021
Salary survey c level-2021Salary survey c level-2021
Salary survey c level-2021Kristina Florya
 
ECA - National Salary Comparison - ed 2013
ECA - National Salary Comparison - ed 2013ECA - National Salary Comparison - ed 2013
ECA - National Salary Comparison - ed 2013Timoté Geimer
 
www.tex-cetera.com CHAPTER 9 Compe.docx
www.tex-cetera.com CHAPTER 9 Compe.docxwww.tex-cetera.com CHAPTER 9 Compe.docx
www.tex-cetera.com CHAPTER 9 Compe.docxericbrooks84875
 
Types of-pay-structure
Types of-pay-structureTypes of-pay-structure
Types of-pay-structurePRAVEEN CH
 
Webinar - Pay Transparency Legislation Series, Ep. 8: The Importance of Meani...
Webinar - Pay Transparency Legislation Series, Ep. 8: The Importance of Meani...Webinar - Pay Transparency Legislation Series, Ep. 8: The Importance of Meani...
Webinar - Pay Transparency Legislation Series, Ep. 8: The Importance of Meani...PayScale, Inc.
 

Similar to Work structure and pay structure - HRM (20)

Pay structure decisions presentation
Pay structure decisions presentationPay structure decisions presentation
Pay structure decisions presentation
 
Chapter 6 implementing and managing pay system
Chapter 6 implementing and managing pay systemChapter 6 implementing and managing pay system
Chapter 6 implementing and managing pay system
 
Global Sales Compensation Mix
Global Sales Compensation MixGlobal Sales Compensation Mix
Global Sales Compensation Mix
 
9 Salary Surveys A Snapshot Market data obtained from salary surv.docx
9 Salary Surveys A Snapshot Market data obtained from salary surv.docx9 Salary Surveys A Snapshot Market data obtained from salary surv.docx
9 Salary Surveys A Snapshot Market data obtained from salary surv.docx
 
Project report on compensation and benefits
Project report on compensation and benefitsProject report on compensation and benefits
Project report on compensation and benefits
 
Salary structure
Salary structureSalary structure
Salary structure
 
certified compensation and benefits manager sample-material
certified compensation and benefits manager sample-materialcertified compensation and benefits manager sample-material
certified compensation and benefits manager sample-material
 
Building market competitive compensation
Building market competitive compensationBuilding market competitive compensation
Building market competitive compensation
 
Chapter 16
Chapter 16Chapter 16
Chapter 16
 
Webinar - Closing the Gap: How Organizations are Making Fair Pay a Reality
Webinar - Closing the Gap: How Organizations are Making Fair Pay a RealityWebinar - Closing the Gap: How Organizations are Making Fair Pay a Reality
Webinar - Closing the Gap: How Organizations are Making Fair Pay a Reality
 
6 Cutting-Edge HR Metrics to Measure in 2019
6 Cutting-Edge HR Metrics to Measure in 20196 Cutting-Edge HR Metrics to Measure in 2019
6 Cutting-Edge HR Metrics to Measure in 2019
 
Salary survey С-level 2019
Salary survey С-level 2019Salary survey С-level 2019
Salary survey С-level 2019
 
Chapter EighteenManagement Making It WorkChapter OutlineMan.docx
Chapter EighteenManagement Making It WorkChapter OutlineMan.docxChapter EighteenManagement Making It WorkChapter OutlineMan.docx
Chapter EighteenManagement Making It WorkChapter OutlineMan.docx
 
Module 1 (3rd part)
Module 1 (3rd part)Module 1 (3rd part)
Module 1 (3rd part)
 
Salary survey c level-2021
Salary survey c level-2021Salary survey c level-2021
Salary survey c level-2021
 
ECA - National Salary Comparison - ed 2013
ECA - National Salary Comparison - ed 2013ECA - National Salary Comparison - ed 2013
ECA - National Salary Comparison - ed 2013
 
www.tex-cetera.com CHAPTER 9 Compe.docx
www.tex-cetera.com CHAPTER 9 Compe.docxwww.tex-cetera.com CHAPTER 9 Compe.docx
www.tex-cetera.com CHAPTER 9 Compe.docx
 
Types of-pay-structure
Types of-pay-structureTypes of-pay-structure
Types of-pay-structure
 
Rules for Keeping Pay Competitive
Rules for Keeping Pay CompetitiveRules for Keeping Pay Competitive
Rules for Keeping Pay Competitive
 
Webinar - Pay Transparency Legislation Series, Ep. 8: The Importance of Meani...
Webinar - Pay Transparency Legislation Series, Ep. 8: The Importance of Meani...Webinar - Pay Transparency Legislation Series, Ep. 8: The Importance of Meani...
Webinar - Pay Transparency Legislation Series, Ep. 8: The Importance of Meani...
 

More from jalajaAnilkumar

hypothesis testing - research oriented
hypothesis testing  -  research orientedhypothesis testing  -  research oriented
hypothesis testing - research orientedjalajaAnilkumar
 
Talent retention presentation for degree
Talent retention presentation for degreeTalent retention presentation for degree
Talent retention presentation for degreejalajaAnilkumar
 
workmens compensation - gives insight on HR policies
workmens compensation - gives insight on HR policiesworkmens compensation - gives insight on HR policies
workmens compensation - gives insight on HR policiesjalajaAnilkumar
 
Work Life Balance and Demographic Variables.pdf
Work Life Balance and Demographic Variables.pdfWork Life Balance and Demographic Variables.pdf
Work Life Balance and Demographic Variables.pdfjalajaAnilkumar
 
Cybersecurity_Issues and challenges.pptx
Cybersecurity_Issues and challenges.pptxCybersecurity_Issues and challenges.pptx
Cybersecurity_Issues and challenges.pptxjalajaAnilkumar
 
Work Life Balance and Demographic Variables.pptx
Work Life Balance and Demographic Variables.pptxWork Life Balance and Demographic Variables.pptx
Work Life Balance and Demographic Variables.pptxjalajaAnilkumar
 

More from jalajaAnilkumar (10)

hypothesis testing - research oriented
hypothesis testing  -  research orientedhypothesis testing  -  research oriented
hypothesis testing - research oriented
 
Talent retention presentation for degree
Talent retention presentation for degreeTalent retention presentation for degree
Talent retention presentation for degree
 
workmens compensation - gives insight on HR policies
workmens compensation - gives insight on HR policiesworkmens compensation - gives insight on HR policies
workmens compensation - gives insight on HR policies
 
Work Life Balance and Demographic Variables.pdf
Work Life Balance and Demographic Variables.pdfWork Life Balance and Demographic Variables.pdf
Work Life Balance and Demographic Variables.pdf
 
Cybersecurity_Issues and challenges.pptx
Cybersecurity_Issues and challenges.pptxCybersecurity_Issues and challenges.pptx
Cybersecurity_Issues and challenges.pptx
 
Work Life Balance and Demographic Variables.pptx
Work Life Balance and Demographic Variables.pptxWork Life Balance and Demographic Variables.pptx
Work Life Balance and Demographic Variables.pptx
 
types of incentives.pdf
types of incentives.pdftypes of incentives.pdf
types of incentives.pdf
 
SHRM-1.pptx
SHRM-1.pptxSHRM-1.pptx
SHRM-1.pptx
 
hrm-170103182928.pdf
hrm-170103182928.pdfhrm-170103182928.pdf
hrm-170103182928.pdf
 
ppt_sm.pptx
ppt_sm.pptxppt_sm.pptx
ppt_sm.pptx
 

Recently uploaded

The Most Excellent Way | 1 Corinthians 13
The Most Excellent Way | 1 Corinthians 13The Most Excellent Way | 1 Corinthians 13
The Most Excellent Way | 1 Corinthians 13Steve Thomason
 
Incoming and Outgoing Shipments in 1 STEP Using Odoo 17
Incoming and Outgoing Shipments in 1 STEP Using Odoo 17Incoming and Outgoing Shipments in 1 STEP Using Odoo 17
Incoming and Outgoing Shipments in 1 STEP Using Odoo 17Celine George
 
The basics of sentences session 2pptx copy.pptx
The basics of sentences session 2pptx copy.pptxThe basics of sentences session 2pptx copy.pptx
The basics of sentences session 2pptx copy.pptxheathfieldcps1
 
_Math 4-Q4 Week 5.pptx Steps in Collecting Data
_Math 4-Q4 Week 5.pptx Steps in Collecting Data_Math 4-Q4 Week 5.pptx Steps in Collecting Data
_Math 4-Q4 Week 5.pptx Steps in Collecting DataJhengPantaleon
 
Arihant handbook biology for class 11 .pdf
Arihant handbook biology for class 11 .pdfArihant handbook biology for class 11 .pdf
Arihant handbook biology for class 11 .pdfchloefrazer622
 
Micromeritics - Fundamental and Derived Properties of Powders
Micromeritics - Fundamental and Derived Properties of PowdersMicromeritics - Fundamental and Derived Properties of Powders
Micromeritics - Fundamental and Derived Properties of PowdersChitralekhaTherkar
 
Separation of Lanthanides/ Lanthanides and Actinides
Separation of Lanthanides/ Lanthanides and ActinidesSeparation of Lanthanides/ Lanthanides and Actinides
Separation of Lanthanides/ Lanthanides and ActinidesFatimaKhan178732
 
Employee wellbeing at the workplace.pptx
Employee wellbeing at the workplace.pptxEmployee wellbeing at the workplace.pptx
Employee wellbeing at the workplace.pptxNirmalaLoungPoorunde1
 
Industrial Policy - 1948, 1956, 1973, 1977, 1980, 1991
Industrial Policy - 1948, 1956, 1973, 1977, 1980, 1991Industrial Policy - 1948, 1956, 1973, 1977, 1980, 1991
Industrial Policy - 1948, 1956, 1973, 1977, 1980, 1991RKavithamani
 
Grant Readiness 101 TechSoup and Remy Consulting
Grant Readiness 101 TechSoup and Remy ConsultingGrant Readiness 101 TechSoup and Remy Consulting
Grant Readiness 101 TechSoup and Remy ConsultingTechSoup
 
Kisan Call Centre - To harness potential of ICT in Agriculture by answer farm...
Kisan Call Centre - To harness potential of ICT in Agriculture by answer farm...Kisan Call Centre - To harness potential of ICT in Agriculture by answer farm...
Kisan Call Centre - To harness potential of ICT in Agriculture by answer farm...Krashi Coaching
 
mini mental status format.docx
mini    mental       status     format.docxmini    mental       status     format.docx
mini mental status format.docxPoojaSen20
 
Solving Puzzles Benefits Everyone (English).pptx
Solving Puzzles Benefits Everyone (English).pptxSolving Puzzles Benefits Everyone (English).pptx
Solving Puzzles Benefits Everyone (English).pptxOH TEIK BIN
 
SOCIAL AND HISTORICAL CONTEXT - LFTVD.pptx
SOCIAL AND HISTORICAL CONTEXT - LFTVD.pptxSOCIAL AND HISTORICAL CONTEXT - LFTVD.pptx
SOCIAL AND HISTORICAL CONTEXT - LFTVD.pptxiammrhaywood
 
URLs and Routing in the Odoo 17 Website App
URLs and Routing in the Odoo 17 Website AppURLs and Routing in the Odoo 17 Website App
URLs and Routing in the Odoo 17 Website AppCeline George
 
Sanyam Choudhary Chemistry practical.pdf
Sanyam Choudhary Chemistry practical.pdfSanyam Choudhary Chemistry practical.pdf
Sanyam Choudhary Chemistry practical.pdfsanyamsingh5019
 
Presentation by Andreas Schleicher Tackling the School Absenteeism Crisis 30 ...
Presentation by Andreas Schleicher Tackling the School Absenteeism Crisis 30 ...Presentation by Andreas Schleicher Tackling the School Absenteeism Crisis 30 ...
Presentation by Andreas Schleicher Tackling the School Absenteeism Crisis 30 ...EduSkills OECD
 
Organic Name Reactions for the students and aspirants of Chemistry12th.pptx
Organic Name Reactions  for the students and aspirants of Chemistry12th.pptxOrganic Name Reactions  for the students and aspirants of Chemistry12th.pptx
Organic Name Reactions for the students and aspirants of Chemistry12th.pptxVS Mahajan Coaching Centre
 

Recently uploaded (20)

Código Creativo y Arte de Software | Unidad 1
Código Creativo y Arte de Software | Unidad 1Código Creativo y Arte de Software | Unidad 1
Código Creativo y Arte de Software | Unidad 1
 
The Most Excellent Way | 1 Corinthians 13
The Most Excellent Way | 1 Corinthians 13The Most Excellent Way | 1 Corinthians 13
The Most Excellent Way | 1 Corinthians 13
 
Incoming and Outgoing Shipments in 1 STEP Using Odoo 17
Incoming and Outgoing Shipments in 1 STEP Using Odoo 17Incoming and Outgoing Shipments in 1 STEP Using Odoo 17
Incoming and Outgoing Shipments in 1 STEP Using Odoo 17
 
The basics of sentences session 2pptx copy.pptx
The basics of sentences session 2pptx copy.pptxThe basics of sentences session 2pptx copy.pptx
The basics of sentences session 2pptx copy.pptx
 
_Math 4-Q4 Week 5.pptx Steps in Collecting Data
_Math 4-Q4 Week 5.pptx Steps in Collecting Data_Math 4-Q4 Week 5.pptx Steps in Collecting Data
_Math 4-Q4 Week 5.pptx Steps in Collecting Data
 
Arihant handbook biology for class 11 .pdf
Arihant handbook biology for class 11 .pdfArihant handbook biology for class 11 .pdf
Arihant handbook biology for class 11 .pdf
 
Micromeritics - Fundamental and Derived Properties of Powders
Micromeritics - Fundamental and Derived Properties of PowdersMicromeritics - Fundamental and Derived Properties of Powders
Micromeritics - Fundamental and Derived Properties of Powders
 
Separation of Lanthanides/ Lanthanides and Actinides
Separation of Lanthanides/ Lanthanides and ActinidesSeparation of Lanthanides/ Lanthanides and Actinides
Separation of Lanthanides/ Lanthanides and Actinides
 
Employee wellbeing at the workplace.pptx
Employee wellbeing at the workplace.pptxEmployee wellbeing at the workplace.pptx
Employee wellbeing at the workplace.pptx
 
Industrial Policy - 1948, 1956, 1973, 1977, 1980, 1991
Industrial Policy - 1948, 1956, 1973, 1977, 1980, 1991Industrial Policy - 1948, 1956, 1973, 1977, 1980, 1991
Industrial Policy - 1948, 1956, 1973, 1977, 1980, 1991
 
Grant Readiness 101 TechSoup and Remy Consulting
Grant Readiness 101 TechSoup and Remy ConsultingGrant Readiness 101 TechSoup and Remy Consulting
Grant Readiness 101 TechSoup and Remy Consulting
 
Kisan Call Centre - To harness potential of ICT in Agriculture by answer farm...
Kisan Call Centre - To harness potential of ICT in Agriculture by answer farm...Kisan Call Centre - To harness potential of ICT in Agriculture by answer farm...
Kisan Call Centre - To harness potential of ICT in Agriculture by answer farm...
 
mini mental status format.docx
mini    mental       status     format.docxmini    mental       status     format.docx
mini mental status format.docx
 
Solving Puzzles Benefits Everyone (English).pptx
Solving Puzzles Benefits Everyone (English).pptxSolving Puzzles Benefits Everyone (English).pptx
Solving Puzzles Benefits Everyone (English).pptx
 
SOCIAL AND HISTORICAL CONTEXT - LFTVD.pptx
SOCIAL AND HISTORICAL CONTEXT - LFTVD.pptxSOCIAL AND HISTORICAL CONTEXT - LFTVD.pptx
SOCIAL AND HISTORICAL CONTEXT - LFTVD.pptx
 
URLs and Routing in the Odoo 17 Website App
URLs and Routing in the Odoo 17 Website AppURLs and Routing in the Odoo 17 Website App
URLs and Routing in the Odoo 17 Website App
 
Sanyam Choudhary Chemistry practical.pdf
Sanyam Choudhary Chemistry practical.pdfSanyam Choudhary Chemistry practical.pdf
Sanyam Choudhary Chemistry practical.pdf
 
Presentation by Andreas Schleicher Tackling the School Absenteeism Crisis 30 ...
Presentation by Andreas Schleicher Tackling the School Absenteeism Crisis 30 ...Presentation by Andreas Schleicher Tackling the School Absenteeism Crisis 30 ...
Presentation by Andreas Schleicher Tackling the School Absenteeism Crisis 30 ...
 
Organic Name Reactions for the students and aspirants of Chemistry12th.pptx
Organic Name Reactions  for the students and aspirants of Chemistry12th.pptxOrganic Name Reactions  for the students and aspirants of Chemistry12th.pptx
Organic Name Reactions for the students and aspirants of Chemistry12th.pptx
 
Staff of Color (SOC) Retention Efforts DDSD
Staff of Color (SOC) Retention Efforts DDSDStaff of Color (SOC) Retention Efforts DDSD
Staff of Color (SOC) Retention Efforts DDSD
 

Work structure and pay structure - HRM

  • 1. 1 Designing A Base Pay Structure After determining internal equity relationships among jobs, and Identifying competitive pay practices in the market place, The next order of business is the design of a pay structure.
  • 2. 2 Designing A Base Pay Structure The Architects of the Pay Structure Must:  Establish a pay policy line.  Design pay grades using pay grade minimum and maximum and desired spreads of the range.  Determine overlap between pay grades.  Determine if the organization needs more than one pay structure and why.
  • 3. 3 Compensation Policy Guidelines Decisions that provide guidelines for the compensation manager to follow in developing a pay structure are made at the highest levels of the organization.
  • 4. 4 Compensation Policy Guidelines THESE POLICY DECISIONS INCLUDE:  Minimum and maximum levels of pay.  The general relationship among pay levels.  Whether or not the pay structure should lead or lag or laglead the market.  The division of the total compensation dollar.
  • 5. 5 Compensation Policy Guidelines Additionally Senior management decides how best to administer its pay policies. How much, to whom, when, where and how.
  • 6. 6 Pay Structure Design Questions and Issues  What is the lowest rate of pay that can be offered and still hire desirable employees ?  What is the rate of pay necessary to retain employees ?  Will the organization want to recognize seniority and merit through the base pay schedule ?
  • 7. 7 Pay Structure Design Questions and Issues  Is it wise or necessary to offer more than one rate of pay to employees performing either identical or similar kinds of work ?  What is considered to be a sufficient difference in base rates of pay among jobs in a class-series that requires varying levels of knowledge, skills, responsibilities, and duties.
  • 8. 8 Pay Structure Design Questions and Issues  Does the organization wish to recognize dangerous working conditions in its base pay schedule ?  Should there be a difference in changes in base pay progression opportunities among jobs of varying worth ?
  • 9. 9 Pay Structure Design Questions and Issues  Do employees have a significant opportunity to progress to higher level jobs ? If so, what should be the relationship between promotion to a higher job and changes in base pay ?  Will policies and regulations permit incumbents to earn rates of pay higher than established maximums and lower than established minimums ? What should be the reasons for allowing such deviations ?
  • 10. 10  How will the pay structure accommodate across-the-board, cost-of-living, or other adjustments not related to employee tenure, performance, or responsibility and duty changes ? Pay Structure Design Questions and Issues
  • 11. 11 Pay Structure Architecture With the generation of internal and external pay data and information, managers are now ready to design a pay schedule.  To do so they must:  Determine a trend or pay policy line.  Decide on the need for one or more pay structures.
  • 12. 12 Pay Structure Architecture  Display job data  Establish the characteristics of the pay structure (number, width, and height of pay grades, and overlap)  Lock overlapping pay structures (when using more than one)
  • 13. 13 Determining A Pay Policy Line Each organization must develop its own pay policy line, which is a trend line or line of best fit that best represents the middle value of jobs that have been evaluated or classified to have particular worth.
  • 14. 14 Determining A Pay Policy Line  The procedure most organizations follow in establishing a pay policy or trend line is to identify the market rates for various benchmark jobs that cover the entire spectrum from lowest to highest rates of pay.  By plotting on a chart the pay-rate information obtained through surveys, a scatter diagram or scatter plot can be developed.
  • 15. 15 Determining A Pay Policy Line  Different procedures are available for developing a trend line from a scatter diagram...Line of sight...Two-point...  And the least squares methods.  Another simple procedure is to obtain the market rate or going rate of pay for the lowest and highest paid jobs. Connecting these points can also provide a first approximation for a pay policy line.
  • 16. 16 Determining A Pay Policy Line  Many organizations use the pay policy line to set midpoint values for all their jobs.  Pay policy lines are useful when plotting survey data and comparing them with the internal pay structure.  From the pay policy line, organizations establish the minimum and maximum pay levels, the relationship between pay grades, and the range of a pay grade.
  • 17. 17  There are a number of logical and rational considerations for having multiple pay structures that focus on the forces that influence the actual pay of the various occupational groups comprising most organizations. The Need For More Than One Pay Structure
  • 18. 18  A major reason for using multiple pay structures is that rates of pay for more advanced jobs increase geometrically rather than linearly. The Need For More Than One Pay Structure
  • 19. 19 The Need For More Than One Pay Structure  It is not unusual for large organizations to have at least three pay structure lines:  Blue collar manual labor, craft, and trade workers.  Nonexempt white collar salaried workers.  Managerial, administrative, and professional exempt employees.
  • 20. 20  Some organizations have a fourth pay structure for their highly paid executives. The Need For More Than One Pay Structure
  • 21. 21  Even when there is an apparent need for more than one trend line or pay policy line that would lead to more than one pay structure, there is a statistical procedure for avoiding multiple structures. Displaying Job Data
  • 22. 22 Displaying Job Data  This procedure allows pay data to be presented by means of some form of curvilinear relationship rather than a relationship that must be a straight line.  A pay structure using arithmetic progression will produce a straight pay police line.
  • 23. 23 Displaying Job Data  Geometric progression where pay rates vary by some constant rate of increase will produce a curved pay policy line.  To display a geometric progression in a straight line a logarithmic scale is used.
  • 24. 24 Displaying Job Data  Two values of central tendency most used in analyzing pay relationships are the:  Mean  Median  When the market value or going rate of a job is being determined, the average value or mean is frequently the value selected.
  • 25. 25 Displaying Job Data But it is not always the best choice... In the final analysis it depends on the distribution of the data.
  • 26. 26 Identifying The Lowest And Highest Rates Of Pay  In identifying the lowest rate of pay it is important to pay attention to:  Legal requirements.  The prevailing union scales in local markets.  All area wage scales.
  • 27. 27 Identifying The Lowest And Highest Rates Of Pay  A high low-end rate pushes all rates too high.....And a low low-end rate promotes to much turnover.  Highest rates of pay are a more subjective consideration.
  • 28. 28 Identifying The Lowest And Highest Rates Of Pay  The highest and lowest average values should be the midpoint of the pay for those jobs assigned this rate when there is a range of pay available for each category.
  • 29. 29  The basic design criterion that determines pay differences in moving through a pay structure is the midpoint-to-midpoint differences.  Midpoint-to-midpoint pay difference is the percentage change in the middle value from one adjacent pay grade to the next. Determining Progression From Lowest To Highest Pay Rate
  • 30. 30  Midpoint-to-midpoint pay progressions range from as low as 3% to as high as 25%. and possibly higher is some cases. Determining Progression From Lowest To Highest Pay Rate
  • 31. 31 Determining Progression From Lowest To Highest Pay Rate  Normally, low midpoint-to-midpoint differences are found in pay structures of lower-paid, unskilled, semiskilled, and clerical employees.  High differences are found in pay structures of the executives and the senior managers of an organization.
  • 32. 32 Determining Progression From Lowest To Highest Pay Rate  The following issues should be considered when determining the appropriate midpoint- to-midpoint differences:  The smaller the difference between midpoints the more pay rates available to assign to a specific job.  The more rates of pay the more opportunity for assigning different rates of pay to jobs with minor differences.
  • 33. 33 Determining Progression From Lowest To Highest Pay Rate  The greater the differences between pay rates the easier it is for jobholders to perceive differences in worth between jobs.  A small difference between midpoints may force an organization to have more than one pay structure.
  • 34. 34 Determining Progression From Lowest To Highest Pay Rate  For jobs at the lower end of the pay structure, a 6% to 7.5% difference in midpoints may be appropriate;  For those in the middle of the pay structure an 8% to 10% difference would typically apply; and  At the executive end of the structure the difference would normally range from 15% to 25%.
  • 35. 35 Developing Pay Grades  Pay grades are nothing more than convenient groupings of a wide variety of jobs or classes similar in work difficulty and complexity requirements but possibly having nothing else in common.
  • 36. 36 Developing Pay Grades  It may provide for a single rate, or it may allow for a range of pay within a certain grade.  The top or maximum rate of pay of a pay grade states that this is the most that work produced by a job in this grade is worth to the organization.  The bottom places a minimal value on the contributions of the assigned job.
  • 37. 37 Developing Pay Grades  The distance between minimum and maximum recognizes the range of performance and experience of incumbents in the assigned job(s).
  • 38. 38 General Characteristics Of Pay Grade Systems  Each grade provides for a range of pay.  Within a pay grade range there is a minimum, a midpoint, and a maximum pay.  The range from the minimum to the maximum within a single pay grade may vary from 20 to 100 percent. The most common range is from 30 to 50 percent.
  • 39. 39 General Characteristics Of Pay Grade Systems  The number of steps within a grade may also vary. Grades having steps will normally have from 3 to 10 steps, with 6 to 7 in-grade steps most common.  There is a direct relationship between the rate of increase per step and the number of steps within a grade.
  • 40. 40 General Characteristics Of Pay Grade Systems  The midpoint of each pay grade is normally a constant percentage greater than the one preceding it. This percentage normally varies from 5 to 10 percent.  Adjoining pay grades normally overlap. If there is a 30 percent range within a pay grade and there is a 10 percent difference between midpoints, there will be a 67 percent overlap.
  • 41. 41 General Characteristics Of Pay Grade Systems  The requirements of the organization will provide answers to the correct number of grades, the number of steps within grades, and their rates of progression within and between grades.
  • 42. 42 General Characteristics Of Pay Grade Systems The number of pay grades to be included within a pay structure varies with the circumstances-- there is no right number.
  • 43. 43 Pay Structure Terms  Single-Rate Pay Grade  A flat rate structure that appears in organizations in which pay rate negotiations between management and unions are common practice, in some small organizations, or in industries using skilled craftworkers.
  • 44. 44 Pay Structure Terms  Multiple-Point Pay Structure  Some organizations that use point- factor job evaluation plans establish a rate of pay for every possible point score.
  • 45. 45 Pay Structure Terms  Broadbanding  The grouping of jobs of significant differences or worth or value within one band or pay grade.
  • 46. 46 Pay Structure Terms  Broadbanding (cont)  This pay grouping or expanded pay grade may have a range varying from 50 percent to 100 percent and include jobs that have responsibilities and duties that vary in complexity and difficulty and require significantly different knowledge and skills.
  • 47. 47 Pay Structure Terms  Range or Spread Dimension  The difference between the upper and lower limits of the grade. It may be expressed in absolute dollar amounts or as a percentage.
  • 48. 48 Pay Structure Terms  Pay Grade Width  Procedures for establishing a pay grade width are not as specific or precise as those related to the spread or height of the pay grade.  When using a point-factor plan, points often are the x axis values.