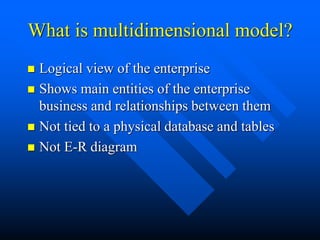
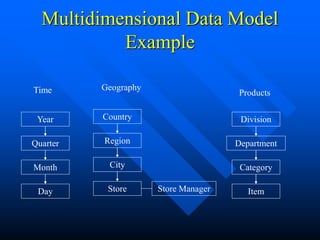
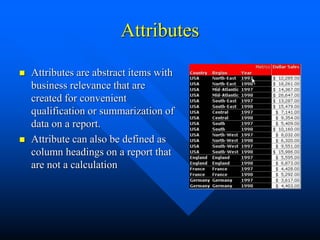
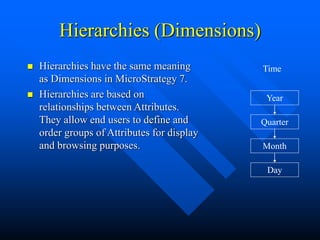
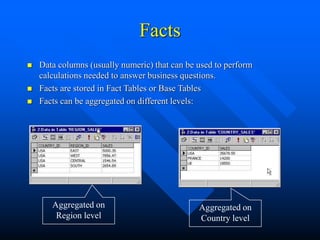
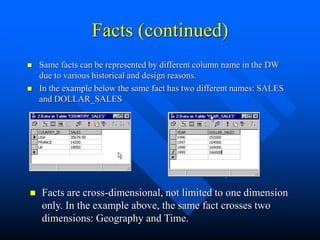
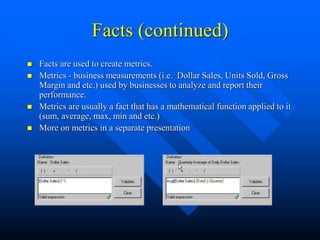
Multidimensional Modeling
MIS 497
What is multidimensional model?
 Logical view of the enterprise
 Shows main entities of the enterprise
business and relationships between them
 Not tied to a physical database and tables
 Not E-R diagram
Model Components
 Dimensions (Hierarchies in MSTR 7)
 Attributes
 Facts
 Relationships
Multidimensional Data Model
Example
Time
Year
Quarter
Month
Day
Geography
Country
Region
City
Store
Products
Division
Department
Category
Item
Store Manager
Attributes
 Attributes are abstract items with
business relevance that are
created for convenient
qualification or summarization of
data on a report.
 Attribute can also be defined as
column headings on a report that
are not a calculation
Attribute relationships
 One to One
– Each customer has only one SSN.
 One to Many
– Each customer can have several addresses.
 Many to Many
– Each customer can buy many items, an item can be
purchased by many customers (item means SKU, not
the same physical object).
 Many to One
– Several phone numbers can belong to one store, and
one store only.
Attribute relationships
 Out of all relationships, Many to Many is the trickiest one.
If not modeled carefully, M;N can lead to double-counting
and other unhappy consequences.
 Practical ways of dealing with M;N relationships:
– Create a relationship table
– Create a compound key
» Not advisable, but sometimes necessary
Hierarchies (Dimensions)
 Hierarchies have the same meaning
as Dimensions in MicroStrategy 7.
 Hierarchies are based on
relationships between Attributes.
They allow end users to define and
order groups of Attributes for display
and browsing purposes.
Time
Year
Quarter
Month
Day
Facts
 Data columns (usually numeric) that can be used to perform
calculations needed to answer business questions.
 Facts are stored in Fact Tables or Base Tables
 Facts can be aggregated on different levels:
Aggregated on
Region level
Aggregated on
Country level
Facts (continued)
 Same facts can be represented by different column name in the DW
due to various historical and design reasons.
 In the example below the same fact has two different names: SALES
and DOLLAR_SALES
 Facts are cross-dimensional, not limited to one dimension
only. In the example above, the same fact crosses two
dimensions: Geography and Time.
Facts (continued)
 Facts are used to create metrics.
 Metrics - business measurements (i.e. Dollar Sales, Units Sold, Gross
Margin and etc.) used by businesses to analyze and report their
performance.
 Metrics are usually a fact that has a mathematical function applied to it
(sum, average, max, min and etc.)
 More on metrics in a separate presentation
What to read for more information:
 MicroStrategy 7 Project designer guide.
 Have a good look at VMALL Data Model
– Identify attributes, hierarchies and facts – you’ll
need them for the Workshop.

4. Multidimensional Modeling.ppt

  • 1.
  • 2.
    What is multidimensionalmodel?  Logical view of the enterprise  Shows main entities of the enterprise business and relationships between them  Not tied to a physical database and tables  Not E-R diagram
  • 3.
    Model Components  Dimensions(Hierarchies in MSTR 7)  Attributes  Facts  Relationships
  • 4.
  • 5.
    Attributes  Attributes areabstract items with business relevance that are created for convenient qualification or summarization of data on a report.  Attribute can also be defined as column headings on a report that are not a calculation
  • 6.
    Attribute relationships  Oneto One – Each customer has only one SSN.  One to Many – Each customer can have several addresses.  Many to Many – Each customer can buy many items, an item can be purchased by many customers (item means SKU, not the same physical object).  Many to One – Several phone numbers can belong to one store, and one store only.
  • 7.
    Attribute relationships  Outof all relationships, Many to Many is the trickiest one. If not modeled carefully, M;N can lead to double-counting and other unhappy consequences.  Practical ways of dealing with M;N relationships: – Create a relationship table – Create a compound key » Not advisable, but sometimes necessary
  • 8.
    Hierarchies (Dimensions)  Hierarchieshave the same meaning as Dimensions in MicroStrategy 7.  Hierarchies are based on relationships between Attributes. They allow end users to define and order groups of Attributes for display and browsing purposes. Time Year Quarter Month Day
  • 9.
    Facts  Data columns(usually numeric) that can be used to perform calculations needed to answer business questions.  Facts are stored in Fact Tables or Base Tables  Facts can be aggregated on different levels: Aggregated on Region level Aggregated on Country level
  • 10.
    Facts (continued)  Samefacts can be represented by different column name in the DW due to various historical and design reasons.  In the example below the same fact has two different names: SALES and DOLLAR_SALES  Facts are cross-dimensional, not limited to one dimension only. In the example above, the same fact crosses two dimensions: Geography and Time.
  • 11.
    Facts (continued)  Factsare used to create metrics.  Metrics - business measurements (i.e. Dollar Sales, Units Sold, Gross Margin and etc.) used by businesses to analyze and report their performance.  Metrics are usually a fact that has a mathematical function applied to it (sum, average, max, min and etc.)  More on metrics in a separate presentation
  • 12.
    What to readfor more information:  MicroStrategy 7 Project designer guide.  Have a good look at VMALL Data Model – Identify attributes, hierarchies and facts – you’ll need them for the Workshop.