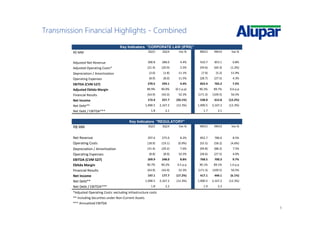
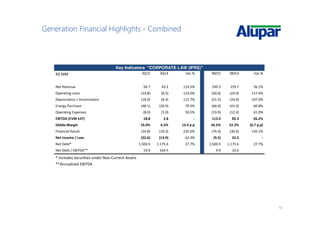
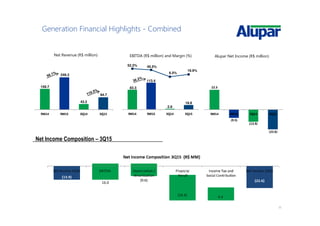
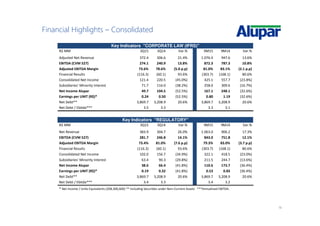
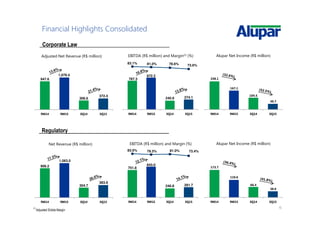
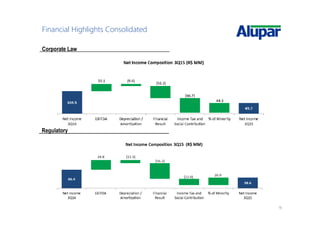
- Alupar's consolidated net income decreased 52.5% in 3Q15 and 32.6% in 9M15 compared to the same periods in 2014.
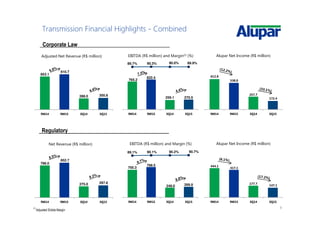
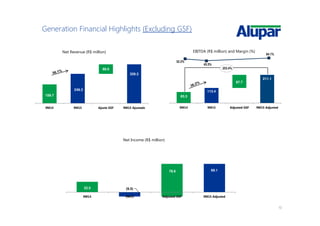
- Consolidated EBITDA increased 13.8% in 3Q15 and 10.8% in 9M15, while the adjusted EBITDA margin decreased.
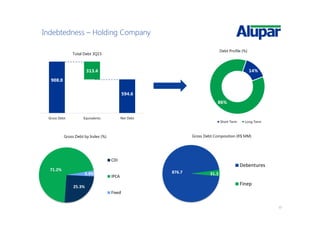
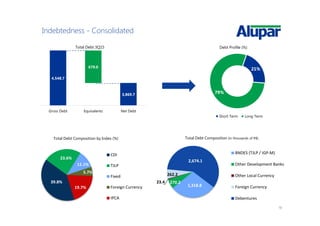
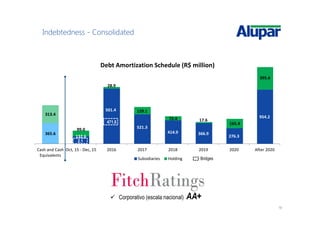
- Financial results worsened significantly in both periods due to higher net debt and interest rates.
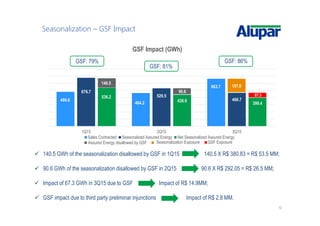
- Transmission segment results improved in both revenue and EBITDA for 3Q15 and 9M15, while generation was impacted by seasonal effects from reduced assured energy allowed under GSF rules.