1. 1Scientific Reports | 6:29936 | DOI: 10.1038/srep29936
www.nature.com/scientificreports
3D Imaging of Nanoparticle
Distribution in BiologicalTissue
by Laser-Induced Breakdown
Spectroscopy
Y. Gimenez1
, B. Busser1
, F. Trichard1
,A. Kulesza1
, J. M. Laurent2
,V. Zaun3
, F. Lux1
,
J. M. Benoit1
,G. Panczer1
, P. Dugourd1
,O. Tillement1
, F. Pelascini3
, L. Sancey1
&V. Motto-Ros1
Nanomaterials represent a rapidly expanding area of research with huge potential for future medical
applications. Nanotechnology indeed promises to revolutionize diagnostics, drug delivery, gene
therapy, and many other areas of research. For any biological investigation involving nanomaterials,
it is crucial to study the behavior of such nano-objects within tissues to evaluate both their efficacy
and their toxicity. Here, we provide the first account of 3D label-free nanoparticle imaging at the
entire-organ scale.The technology used is known as laser-induced breakdown spectroscopy (LIBS) and
possesses several advantages such as speed of operation, ease of use and full compatibility with optical
microscopy.We then used two different but complementary approaches to achieve 3D elemental
imaging with LIBS: a volume reconstruction of a sliced organ and in-depth analysis.This proof-of-
concept study demonstrates the quantitative imaging of both endogenous and exogenous elements
within entire organs and paves the way for innumerable applications.
Nanoparticles (NPs) have been an attractive research topic in preclinical and medical fields both for imaging1–4
and therapeutic purposes5–7
. For the latter, NPs can be used for drug/gene delivery8–10
, immunotherapy11,12
, or
radiosensitization13–15
. The applicability of nanomaterials is largely governed by their size. While large-size NPs
are generally used for delivery purposes, recent studies note that smaller NPs (<12 nm) are better candidates for
tumor targeting. These small NPs may indeed have better accumulation and penetration in tumors and also pres-
ent less toxicity because they are preferentially eliminated through the kidneys16–18
. However, the characterization
of these pharmacologically attractive candidates within biological organs remains highly challenging, particularly
because of their small size. Any modification applied to such small NPs (for example, fluorescence labeling) may
modify their shape, size, and/or charge and therefore affect their biodistribution19
. Moreover, the label may escape
or detach from the NP. Consequently, nanomaterials dedicated to in vivo applications must be thoroughly eval-
uated. NPs must be tailored to their intended application and a broad monitoring of every stage of pharmacoki-
netics (absorption, distribution, metabolism, and excretion) is crucial for determining the biological activity and
toxicity of NPs. These processes require the use of imaging approaches, ideally with 3D capabilities4,20
.
Only a few techniques allow the study of the biodistribution of nanomaterials in biological tissues and in
3D. Among them, optical imaging may be the most widely used. This technique is applicable to any NP from
the subcellular to the whole-body scale and has a typical resolution of 200 nm20,21
. However, in this case, nano-
materials must be tagged with dyes. NP labeling is also generally required for nuclear imaging, such as positron
emission tomography (PET). The relatively low resolution (typically 1.2 mm) of PET is adapted for studies at
the whole-body scale4
. Magnetic resonance imaging (MRI) can be used to follow NPs containing elements with
nuclear spin, such as ultrasmall superparamagnetic iron oxide (USPIO) particles or gadolinium (Gd) chelates22,23
.
However, similar to computed tomography (CT)24
, MRI cannot discriminate the tissue from the contrast agent,
which limits its role to enhancing contrast dynamics. Except in very specific cases, elemental imaging is the only
way to conduct investigations using label-free, i.e., modification-free, metal-based nanoparticles.
1
Institut Lumière Matière, UMR5306 Université de Lyon 1 – CNRS, Université de Lyon, 69622Villeurbanne cedex,
France. 2
Andor Technology, Springvale Business Park, Belfast BT12 7AL, UK. 3
CRITT Matériaux Alsace, 67305
Schiltigheim, France. Correspondence and requests for materials should be addressed toV.M.-R. (email: vincent.
motto-ros@univ-lyon1.fr)
received: 01 February 2016
accepted: 27 June 2016
Published: 20 July 2016
OPEN
2. www.nature.com/scientificreports/
2Scientific Reports | 6:29936 | DOI: 10.1038/srep29936
Among the elemental imaging approaches such as transmission electron microscopy combined with energy
dispersive X-ray analysis (TEM-EDX)21,25
, synchrotron radiation microanalysis (SXRF)26–28
, and laser ablation
inductively coupled plasma mass spectrometry (LA-ICP-MS)29–31
, TEM-EDX is the only technique that achieves
sub-nm resolution, thus allowing the direct visualization of a single NP. All the other techniques probe areas or
volumes that are generally much larger than the NP size. However, these techniques can successfully image the
biodistribution of NPs, especially when the elements constituting the particles are different from the elements of
the tissue itself32–36
. These scanning techniques could generate 3D images through a “layer by layer” analysis, but
their relatively slow acquisition rate (generally limited to ∼1 Hz/pixel) strongly limits the analysis of large samples
and their application to 3D elemental imaging.
We recently developed an alternative elemental imaging technique based on laser-induced breakdown spec-
troscopy (LIBS) to image the distribution of different NPs containing Gd, calcium (Ca), or gold (Au) injected
into rodents37–40
. LIBS is a technique with a large range of applications41,42
and is generally attractive when field
deployment is required43,44
. By applying LIBS to biological imaging, we recently demonstrated the possibility
of imaging elements at the organ scale with ppm-scale sensitivity and a pixel size of up to 10 × 10 μm2
ref. 37.
Although LIBS is not as sensitive as LA-ICP-MS (<500 ppb) or as high-resolution as μXRF (<1 μm), LIBS has the
advantage of a fast operating speed and an all-optical tabletop instrument that is compatible with standard optical
microscopy. The scanning speed can be up to 100 times faster than other techniques, allowing 3D investigations to
be conducted on large biological samples within reasonable time periods. Here, we demonstrate for the first time
that LIBS imaging can be used for the 3D imaging of biological organs. This methodological proof-of-concept
study was conducted in the context of the renal clearance of theranostic Gd-based NPs in rodents. These NPs -
named AGuIX - have a size of less than 5 nm and are developed for image-guided radiotherapy13,38
. We present
different methodologies for 3D imaging across different length scales, from the global NP distribution within the
entire organ to specific regions of interest with higher resolution. Our results demonstrate that LIBS is suitable for
label-free, NP 3D imaging of biological tissue and represents a promising and powerful approach for preclinical
investigations.
Insights into LIBS biological imaging
In LIBS, the laser-induced plasma generated by focusing laser pulses on the surface of the sample of interest
allows a specific optical response to be elicited from the elements constituting the sample41,42
. This specific
response, resulting from the electronic relaxation of atoms and ions excited by the high plasma temperature, is
collected and analyzed using an optical spectrometer. The elemental “signal” (atomic and ionic emission lines) is
then extracted from the recorded spectrum, and elemental maps can be obtained in a pixel-by-pixel manner by
scanning the sample surface over the region of interest (Fig. 1).
The implementation of LIBS is simple because a single laser pulse can simultaneously sample the material by
laser ablation and excite the vaporized elements by heating the plasma plume. Hence, the acquisition speed for
LIBS is mainly governed by the laser frequency rate. The apparent simplicity of the setup endows LIBS with a
series of advantages over other elemental imaging methods; these benefits include an all-optical design, operation
in ambient atmosphere, and fast acquisition. Apart from the instrumentation, this technique has also great assets
regarding its analytical potential, such as the lack of restrictions on the number of elements that can be simultane-
ously detected assuming elemental lines within the probed spectral range. LIBS is especially efficient for metals,
which often have intense emission lines in the UV-visible range, although organic elements can also be detected.
It also has quantitative capabilities, either through the use of standards with known concentrations37
or specific
multi-calibration methods, as described below.
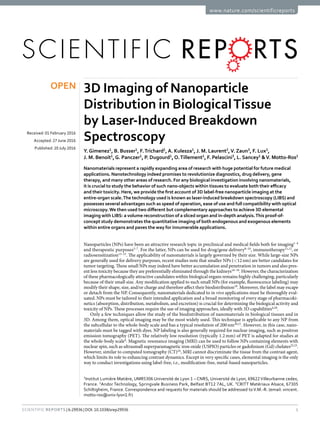
Figure 1. General protocol for LIBS imaging. (a) Schematic view of the LIBS instrument showing the major
components: the microscope objective used to focus the laser pulse, the motorized platform supporting the
sample and the optical detection system connected to the spectrometer via an optical fiber. (b) Example of
single-shot emission spectra covering the 315–345 nm spectral range recorded in different regions of the mouse
kidney with the characteristic emission lines of calcium (Ca), sodium (Na), and Gd. (c) Example of relative-
abundance images of Gd (green) and Ca (violet) represented in a false color scale.
3. www.nature.com/scientificreports/
3Scientific Reports | 6:29936 | DOI: 10.1038/srep29936
With LIBS, the accessible imaging performances (spatial resolution and sensitivity) are inextricably linked
to the laser ablation process. The resolution is ultimately governed by the size of the ablation craters, whereas
the sensitivity largely relies on the amount of vaporized material and also on the excitation capability of the laser
pulse37
. In addition, laser ablation is a violent process because it is accompanied by different mechanisms, such as
shock wave formation and thermal diffusion through the sample. These effects might cause much more sample
deterioration than caused by the ablation itself and might make it difficult to analyze thin tissue slices (∼10 μm).
All these points emphasize that application of LIBS to tissue imaging mainly depends on the optimization of the
laser/biological matter interaction. Performance can be improved to an extent by optimizing irradiation param-
eters (wavelength, energy density, pulse duration, and beam profile quality). Nevertheless, hardening of the sam-
ples is always preferable to improve the mechanical stability of the sample and, therefore, the ablation shot-to-shot
repeatability.
Results
From 2D to 3D LIBS imaging. To date, the best LIBS imaging performances have been obtained after
fixing and embedding the biological samples in epoxy resin, which is a typical protocol for electron microscopy
experiments. This process allows the tissue to be embedded in a hard form with minimal modifications of the
biological structure45
. Besides, although the distribution of metals can be rather heterogeneous inside the tissue,
their low concentrations (generally lower than ∼0.1%) allow the sample to be considered as a unique matrix. In
other words, matrix effect from one position to another can be neglected. In our experiments, infrared nano-
second laser pulses of 500 μJ were focused by a 15x magnification objective. A typical 2D distribution of Gd and
Ca within a coronal murine kidney section is presented in Fig. 2a,b. The ablation craters are ∼5 μm, and this
image was obtained with a lateral resolution of 10 μm (Fig. 2c). From a biological point of view, this image clearly
showed NP accumulation (i.e., Gd) in the cortex (peripheral region of the kidney) and in specific zones of the
medulla (central region). In the cortex, NPs are heterogeneously distributed with zones containing either high
or low concentrations of NPs. In the medulla, NPs are only observed in regions surrounding the collecting ducts
(shown by yellow arrows in Fig. 2b). In addition to monitoring NPs, it might be interesting to follow the elements
that naturally exist in the organ, especially if they provide information about its anatomical structure. As an exam-
ple, Ca is a constitutive element of the tissue that is more homogeneously distributed in the organ; however, it is
more concentrated in the renal corpuscles (shown by white arrows, Fig. 2b).
When attempting to conduct 3D LIBS imaging, it is important to find an equilibrium between the resolution
achieved in the 3 spatial dimensions and the time needed to obtain the information from a sample of a given
size. We present two complementary methodologies that allow the 3D elemental analysis of murine kidneys
containing Gd-NPs. The first strategy was to slice an epoxy-embedded kidney into consecutive ∼200 μm-thick
sections to study the global distribution of NPs throughout the entire organ. This experiment allowed several
sections of the kidney to be mapped and assembled in a stack and then modeled as a volume. The second 3D
imaging strategy exploited the invasive nature of LIBS with repeated 2D analysis of the same renal regions. This
in-depth elemental imaging process enabled the progressive analysis of a volume with a resolution of ∼10 μm in
all dimensions.
3D imaging at the organ scale: slicing the sample. The epoxy-embedded kidney was sliced using a
high-precision cut-off machine. On average, 8 slices were obtained from a mouse kidney sample cut in coronal
planes. Each slice was 200 μm thick (±5 μm) and was separated from the following slice by 200 μm (±10 μm)
(Fig. 3b). We performed a 30,000-measurement LIBS mapping (120 × 250) sequence with a lateral resolution of
Figure 2. High-definition 2D elemental image. (a) Quantitative Gd (green) and relative Ca (violet)
biodistributions in a coronal murine kidney section, 3 hours after Gd-based NP administration (500 × 720
pixels, spatial resolution of 10 μm). The Gd concentration is expressed in millimoles per liter (mM). The gray
squares (1) and (2) indicate the specific regions analyzed by in depth imaging ablation (see below). (b) 2x
magnification of the square region presented in (a). The yellow arrows indicate the edge of a large collecting
duct, and the white arrows indicate renal corpuscles. (c) Example of a single-shot crater observed in scanning
electron microscopy.
4. www.nature.com/scientificreports/
4Scientific Reports | 6:29936 | DOI: 10.1038/srep29936
35 μm on both sides of each slice. The time required to analyze one map (i.e., one side of each slice) was less than
1 hour at a 10 Hz laser repetition rate. Elemental images of Gd, Ca, and Na were finally obtained for all the ana-
lyzed faces, constituting a total of 15 consecutive sections (Fig. 3a).
The quantification of Gd was performed using a new method developed specifically for LIBS imaging. Each
slice was analyzed independently by inductively coupled plasma optical emission spectrometry (ICP-OES) after
the LIBS measurements. These analyses provided the total mass of Gd in each section. This Gd mass was then
compared slice by slice to the LIBS Gd intensity, which was obtained by summing all the pixel intensities on both
sides of each slice (Fig. 3c). The observed good agreement suggested that the small volume of material analyzed
by LIBS was sufficiently representative of the entire slice volume. In addition, the important variation in Gd mass
along the different slices allows a calibration curve to be built (Fig. 3d). Once the volume of biological tissue
contained in each slice was determined (Supplementary Fig. 1), the relative-abundance image of Gd was subse-
quently transformed into a quantitative-abundance image, expressed in millimoles per liter (mM) (Fig. 3a). This
calibration yielded an extrapolated relative limit of detection (LoD) for Gd of 15 ppm for a single-shot measure-
ment. This limit of detection (LoD) was estimated as 3 times the noise, estimated from the spectrum baseline,
divided by the slope of the analytical curve, and considering a resin density 1.2 kg/L. Finally, the global Gd con-
centration was determined to be 3.2 mM in the entire kidney. This value was in perfect agreement with previous
studies performed in similar experimental conditions38
.
The series of consecutive elemental images were then stacked into 3D images. Complete 3D models covering
the entire organ volume were then constructed for Gd, Na, and Ca. With these models, cross-sectional views can
be redrawn at any depth and/or orientation. Examples of 3D representations are illustrated in Fig. 4 for Gd, Ca,
and Na. The Gd distribution clearly showed the NP accumulation in the cortex (Fig. 4a). The homogeneous dis-
tribution of Ca allowed volumetric information regarding the sample to be collected (Fig. 4b). Sodium was more
concentrated in the medulla (Fig. 4c), which might reflect its physiological, active reabsorption in this region. The
combination of different elemental distributions allowed visualization of the NP distribution during the physi-
ological renal elimination of the NPs (Fig. 4d–f). The high cortical Gd concentrations contrasted with the high
concentrations of Na predominantly in the medulla (Fig. 4d,e).
3D imaging by in-depth ablation. The in-depth ablation process was performed by repeating the laser
shots over the same area of interest. As mentioned previously, this layer-by-layer mode provided several consec-
utive 2D sequences and allowed a higher resolution (∼10 μm) to be achieved in all 3 dimensions. In this LIBS
3D-imaging strategy, the minimal accessible depth resolution depends on the amount of material removed, which
is correlated with both the laser pulse properties and the material itself. The depth resolution might be affected by
the properties of the resin used for sample embedding, and in general, the best resolutions are achieved with the
hardest samples. Moreover, the sample surface must be adequately refreshed layer after layer, by operating in an
Figure 3. Global 3D NP distribution and quantification. (a) Series of elemental images of Gd, Ca and Na
obtained on each side of 8 adjacent coronal sections. The kidney was sampled 3 hours after the administration
of Gd-based nanoparticles. (b) Sample embedded in epoxy resin and subsequent slicing. Distances (1) and (2)
are both equal to 200 μm and respectively correspond to the width of the organ slices and of the cutting-off saw
(wasted material), (c) Slice-by-slice comparison between the LIBS Gd intensity and Gd mass determined by
ICP-OES. (d) LIBS intensity calibration.
5. www.nature.com/scientificreports/
5Scientific Reports | 6:29936 | DOI: 10.1038/srep29936
abrasion-like regime. With our laser pulse properties (500 μJ, 1064 nm, 5 ns), this regime was obtained by setting
the lateral resolution at 12 μm.
We performed 7 consecutive scans (Fig. 5a) in an area centered on a collecting duct system (square #1 in
Fig. 2a). Every single 2D sequence yielded a 120 × 120 pixel image. The laser focus was adjusted before every
additional layer with an incremental value of 15 μm, i.e., the depth resolution. 3D models were then constructed
for both Gd and Ca. The 3D renderings for Gd, Ca and an overlay of both elements are shown in Fig. 5b. The NPs
appeared to be trapped in the urothelium, i.e., the epithelial cells from the collecting duct. The sample surface
was observed with scanning electron microscopy (SEM) (Fig. 5c). SEM images showed that the material was
removed uniformly over the entire scanned area, layer after layer. The expected and measured total depth of this
experiment was 100 μm. This value was measured at different positions of the sample using an optical microscope.
This ablation mode induced the creation of rectilinear edges around the ablated surface, creating artefactual side
effects with strong signal degradation visible in the close-to-the-edges pixels. Consequently, we removed the 5
external pixels of each line and row during the analysis to construct the 3D model (Fig. 5a,b).
We performed another analysis from a peripheral zone of the kidney, in the region delimited by square #2 in
Fig. 2a. In this case, 14 consecutive scans were performed with the same experimental and sequencing parameters
(120 × 120 pixels with a 12 μm step). To determine whether the properties of the resin would influence the analy-
sis, we used a different embedding resin containing less hardener. In this case, we observed an increased amount
of removed material per laser pulse, which was estimated to be an approximately 35 μm depth per layer. The 2D
Figure 4. 3D imaging at the entire-organ scale. Examples of elemental 3D representations, i.e., Ca (violet),
Na (red), and Gd (green). (a) 3D coronal visualization of the Gd in the kidney. Light green shows the high Gd
concentrations. (b) Distribution of Ca approximates the global volume of the organ. (c) Distribution of Na
allows the visualization of the contrast between the low cortical Na concentrations and the elevated medullar
concentrations. (d–f) Sections of the kidney allowing the observation of the combination of Gd with Na on the
coronal or axial sections (d,e) or with Ca (f).
Figure 5. 3D depth profile imaging: collecting ducts. (a) Successive in-depth images of Gd (green) and Ca
(violet) in an ∼2 mm2
region located in the medulla (lateral resolution of 12 μm and depth resolution of 15 μm).
(b) Example of 3D representations of Gd and Ca and a dual-color overlay for Gd/Na. (c) Wide-angle and
magnified images of the sample surface recorded via SEM after the completion of the seven successive 2D LIBS
scans. The total ablated depth indicated by the yellow arrow was 100 μm.
6. www.nature.com/scientificreports/
6Scientific Reports | 6:29936 | DOI: 10.1038/srep29936
images of 7 from the 14 consecutive acquisitions are shown for Gd in Fig. 6a, and a 3D rendering for an overlay
of Gd and Na is also presented in Fig. 6b. This experiment demonstrated the possibility of analyzing a surface
deep within the sample (i.e., 500 μm depth); however, global signal deterioration occurred after a depth of 200 μm
(Fig. 6c). This finding might be explained by a loss in the signal collection due to the geometry of our detection
system. In this particular case, the signal degradation was compensated using a normalization by the level of the
spectrum background. The 3D observation shown in Fig. 6b allowed an observation of the natural tortuous archi-
tecture of the cortex. The strong heterogeneity of NPs in the cortical architecture is clearly noticeable. The regions
containing high and low levels of Gd are thought to be the proximal and distal tubules, respectively.
Discussion
We developed an innovative method with 3D capability to image NPs in tissue at the organ scale and with a
cellular-level degree of information (∼10 μm). The proposed label-free, quantitative, and multi-elemental
approach has no equivalent because of its speed of operation, its ease of use, and its full compatibility with optical
microscopy. Two 3D strategies were detailed. The first strategy consisted of slicing the biological sample into
consecutive sections. This process allows the global distribution of nanoparticles to be studied in the entire organ
volume. The second strategy exploits the laser ablation properties to gradually obtain the depth-profile of the
sample by conducting repeated 2D sequences of the same area. In this in-depth imaging method, specific zones of
the sample were observed with a cellular scale resolution (∼10 μm). The two strategies are highly complementary
because they provide information about the NP distribution at different scales and with a reasonable time of anal-
ysis. Although the methodology was demonstrated for Gd-based NPs on a model-type sample, i.e., a kidney, there
is no restriction on using this technology for tissues with more complex architectures (such as the brain, lungs or
tumors) or for any type of metal-based NP (gold, silver, platinum, and others). This methodology has the poten-
tial to become a valuable tool in preclinical investigations, in particular for studying the elimination, toxicity, and
pharmacokinetics of nanomaterials, as well as for any biological or medical application involving metallic ions.
In addition, the proposed calibration method was demonstrated for Gd. It can be extended to any other elements
as long as the volume of material analyzed by LIBS is sufficiently representative of the slice volume. This strategy
avoids the use of external calibrators, which solves the issue of finding or developing specific reference samples.
The invasive nature of LIBS imaging undeniably restricts its use on preclinical animal samples or on human
biopsies. The use of epoxy prevents complementary immunohistological analysis of tissues. Accordingly, we are
currently working on the optimization of the technique for the analysis of paraffin-embedded samples. Efforts are
being made to integrate Raman and fluorescence imaging systems to extend the optical capability of our bio-LIBS
instrument. For specific applications requiring higher sensitivity, the use of a second laser pulse that is tuned to
specifically excite the element of interest would significantly improve its performance in terms of sensitivity. In
addition, although 10–100 Hz acquisition rates have already been achieved, companies are currently attempting
to improve the technology by developing both Gaussian lasers with a high frequency rate and high-speed detec-
tors. These future improvements would allow an increase in the LIBS imaging speed to the KHz scale. The ideal
development of a fully automated sample sectioning, measurement, and fast analysis setup would also bring the
bio-LIBS technology to the leading edge of 3D elemental imaging of biological tissue.
Figure 6. 3D depth profile imaging: cortex. (a) Successive images of Gd (green) in an ∼2 mm2
region located
in the cortex (lateral resolution of 12 μm and depth resolution of 35 μm). Seven images are presented from a
total of 14. (b) Example of a 3D representation of both Gd and Na (red) for the ∼500 μm total depth analysis.
(c) Evolution of the Gd intensity, determined using the 5% of pixels with the highest Gd intensity, as a function
of the probed layer.
7. www.nature.com/scientificreports/
7Scientific Reports | 6:29936 | DOI: 10.1038/srep29936
Methods
Sample preparation. The animal experiments were approved by the local ethics committee (CECCAPP,
agreement #LS-2013-004). All animal procedures are in accordance with the French Government’s Guidelines.
Briefly, female NMRI nude mice (7 weeks’ old, Janvier, Le Genest-Saint-Isle, France) were anesthetized with iso-
flurane (4% initiation, 2% maintenance). Gd-based NPs (8 mg of AGuIX) were IV injected in anesthetized mice.
Kidneys were sampled at the indicated times after injection and were embedded in epoxy. After sampling, each
kidney was perfused and fixed with 2% glutaraldehyde in 0.1 M sodium cacodylate buffer (pH of 7.4) overnight.
The samples were then rinsed three times for 10 minutes each in 0.1 M sodium cacodylate buffer and dehydrated
in a series of ethanol solutions of increasing concentration, ending with propylene oxide. The samples were then
embedded in EPON using a mix of EMBed-812/DDSA/NMA (5:4:2). DMP-30 was used as a hardener (2% of
the mix volume). For Fig. 6, the proportion of these reagents was (5:6:1). The surface of the sample was prepared
using a high-precision cut-off machine (Accutom 50 from Struers, Champigny sur Marne, France). The sections
were 200 μm thick and separated by 200 μm.
Experimental setup and data acquisition. The instrumental setup was based on a homemade optical
microscope. The LIBS experiment used Nd:YAG laser pulses of 1064 nm, focused onto the sample by a 15x mag-
nification objective (LMM-15X-P01, Thorlabs). The pulse duration was 5 ns, and the repetition rate was 10 Hz.
During the experiments, the sample could be translated along the 3 axes by an XYZ motorized stage with a travel
range of 50 mm in each direction. The measurements were performed at room temperature and under ambient
conditions. During the sample scan, trigonometric surface positioning was used to compensate for any flatness
anomalies and to accurately control the objective-to-sample distance. A beam shutter was used to control the
delivery of the laser pulse to the sample such that only one plasma plume was produced for each position of
the sample. The light emitted by the plume was collected by a quartz lens and focused onto the entrance of a
round-to-linear fiber bundle composed of 19 fibers with a 200-μm core diameter. With this collection system,
the observed surface was equal to the whole optical fiber diameter (∼1 mm) and allows light emission from the
all the plasma volume to be collected. The output of the fiber bundle was connected to a Czerny-Turner spec-
trometer equipped with a 1200 l/mm grating blazed at 300 nm and an intensified charge-coupled device (ICCD)
camera (Shamrock 303 and iStar, Andor Technology, respectively). The ICCD camera was synchronized with
the Q switch of the laser, and the spectrum was acquired with a delay of 500 ns and a gate of 3000 μs. The width
of the entrance slit of the spectrometer was set to 30 μm. In this configuration, a spectral measurement range of
30 nm was possible with a spectral resolution of approximately 0.15 nm. To perform the mapping experiments at
the greatest possible speed, the movement of the sample was synchronized with the opening of the beam shutter,
and the spatial resolution was set by adjusting the speed of the translation stage. The laser energy was stabilized
throughout the experiment by using a servo control loop to improve the long-term stability of the laser out-
put. This loop was achieved by using a power meter and a computer-controlled attenuator (ATT1064, Quantum
Composers). Homemade software developed in the LabVIEW environment controlled the entire system and
allowed the performance of automated sequences to scan the region of interest of the tissue sample with a specific
lateral resolution.
Construction of elemental images. An advanced spectrum treatment was developed to rapidly extract
the intensity for each measurement site and for each species of interest. This algorithm can be applied either in
real time, during the mapping scan, or afterward. A single emission line was selected for each element of interest,
and the algorithm defined a baseline fit using a polynomial function and subtracted it from the emission signal.
Emission lines were selected based on two criteria: each selected line was required to be the strongest line in
the probed range and to be unaffected by any possible interference from other lines. To determine the intensity
signals for the elements of interest, the algorithm required less than 1 ms, suggesting that a full map (~30,000
spectra) can be processed in less than 30 seconds. A 2D matrix was then provided for each species. Each cell of
this matrix represented the intensity signal from a point on the sample surface for the given element and could
then be displayed as an image using a false-color scale. The selected emission lines and associated wavelengths are
summarized in Supplementary Table I. To measure the strongest lines associated with Gd ions in the UV-visible
region, the central wavelength of the spectrometer was set to 333 nm. The spectral range covered in this case, 315
to 350 nm, also allowed the detection of lines originating from Na and Ca.
Inductively coupled plasma optical emission spectrometry (ICP-OES) analysis. The samples were
heated at 550°, and dispersed in 67% HNO3 before sonication. Subsequently, the samples were diluted with a 5%
HNO3 (w/w) matrix to adjust the volume to 20 mL; the samples were then filtered (0.22 μm) and analyzed by
ICP-OES (Vista MPX, Varian, France) to determine the elemental content with a precision of 5%. For calibration
of the ICP-OES, single-element standard solutions were prepared by successive dilution in a 5% HNO3 (w/w)
matrix from a 1000-ppm Gd standard acquired from SCP Science.
3D elemental renderings. All the 2D sequences were analyzed consecutively, ensuring that no significant
angular and/or spatial deviation was present. Elemental images, which were extracted from spectra as described
above, were then processed using ImageJ software (NIH, Bethesda, MD, www.nih.gov). Images were contrasted
only in a linear manner, slightly smoothed (using a 0.5-pixel Gaussian smoothing), and virtually flipped when
necessary and then converted from 16-bit to 8-bit images. The interpolation between the subsequent images
was computed using the digital compositing software Morpheus Photo Morpher v3.17. The procedure was suc-
cessfully used for adjacent slices until sufficient interpolation was achieved; finally, z-stacks were computed. The
slice-by-slice reconstructions were visualized by means of surface rendering methods using the open-source soft-
ware package 3D Slicer v4.4. A false-color scale (green for Gd, red for Na and violet for Ca) was used to present
8. www.nature.com/scientificreports/
8Scientific Reports | 6:29936 | DOI: 10.1038/srep29936
a visual result in the form of elemental renderings. The threshold range was split into high and low intensities,
leaving a narrow gap to improve the contrast between them. A metallic effect was also applied, and the image was
captured at the angle considered to maximize the 3D effect.
References
1. NCT01815333. Clinical and Technical Feasibility of a Ultrasuperparamagnetic Nanoparticle Iron Oxide (USPIO)-Enhanced
Magnetic Resonance Lymph Node Imaging. ClinicalTrialsgov.
2. NCT02106598. Targeted Silica Nanoparticles for Image-Guided Intraoperative Sentinel Lymph Node Mapping in Head and Neck
Melanoma, Prostate and Cervical/Uterine Cancer Patients. ClinicalTrialsgov.
3. Chen, F. et al. In vivo tumor targeting and image-guided drug delivery with antibody-conjugated, radiolabeled mesoporous silica
nanoparticles. ACS Nano 7, 9027–9039 (2013).
4. Phillips, E. et al. Clinical translation of an ultrasmall inorganic optical-PET imaging nanoparticle probe. Sci. Transl. Med. 6, 260
(2014).
5. Tasciotti, E. et al. Mesoporous silicon particles as a multistage delivery system for imaging and therapeutic applications. Nat.
Nanotechnol. 3, 151–157 (2008).
6. Dufort, S., Sancey, L. & Coll, J. L. Physico-chemical parameters that govern nanoparticles fate also dictate rules for their molecular
evolution. Adv. drug deliver. Rev. 64, 179–189 (2012).
7. Torchilin, V. P. Multifunctional, stimuli-sensitive nanoparticulate systems for drug delivery. Nat. Rev. Drug Discov. 13, 813–827
(2014).
8. Tanaka, T. et al. Sustained small interfering RNA delivery by mesoporous silicon particles. Cancer Res. 70, 3687–3696 (2010).
9. Park, J. H. et al. Biodegradable luminescent porous silicon nanoparticles for in vivo applications. Nat. Mater. 8, 331–336 (2009).
10. Dahlman, J. E., Kauffman, K. J., Langer, R. & Anderson, D. G. Nanotechnology for in vivo targeted siRNA delivery. Adv. Genet. 88,
37–69 (2014).
11. Chow, E. K. & Ho, D. Cancer nanomedicine: from drug delivery to imaging. Sci. Transl. Med. 5, 216 (2013).
12. Park, Y. M. et al. Nanoparticle-based vaccine delivery for cancer immunotherapy. Immune Netw. 13, 177–183 (2013).
13. Sancey, L. et al. The use of theranostic gadolinium-based nanoprobes to improve radiotherapy efficacy. Br. J. Radiol. 14, 134 (2014).
14. Porcel, E. et al. Gadolinium-based nanoparticles to improve the hadrontherapy performances. Nanomedicine 10, 1601–1608 (2014).
15. Lux, F. et al. Gadolinium-based nanoparticles for theranostic MRI-radiosensitization. Nanomedicine 10, 1801–1815 (2015).
16. Chauhan, V. P. et al. Normalization of tumour blood vessels improves the delivery of nanomedicines in a size-dependent manner.
Nat. Nanotechnol. 8, 383–388 (2012).
17. Reuter, K. G. et al. Targeted PRINT Hydrogels: The Role of Nanoparticle Size and Ligand Density on Cell Association,
Biodistribution, and Tumor Accumulation. Nano Lett. 15, 6371–6378 (2015).
18. Choi, H. S. et al. Design considerations for tumour-targeted nanoparticles. Nat. Nanotech. 5, 42–47 (2010).
19. Hrkach, J. et al. Preclinical Development and Clinical Translation of a PSMA-Targeted Docetaxel Nanoparticle with a Differentiated
Pharmacological Profile. Sci. Transl. Med. 4, 128–139 (2012).
20. Kunjachan, S., Ehling, J., Storm, G., Kiessling, F. & Lammers, T. Noninvasive Imaging of Nanomedicines and Nanotheranostics:
Principles, Progress, and Prospects. Chem. Rev. 19, 10907–10937 (2015).
21. Gravier, J. et al. FRET imaging approaches for in vitro and in vivo characterization of synthetic lipid nanoparticles. Mol. Pharm. 11,
3133–3144 (2014).
22. Kimura, K. et al. High-resolution MR lymphography using ultrasmall superparamagnetic iron oxide (USPIO) in the evaluation of
axillary lymph nodes in patients with early stage breast cancer: preliminary results. Breast Cancer 17, 241–246 (2010).
23. Bianchi, A. et al. Quantitative biodistribution and pharmacokinetics of multimodal gadolinium-based nanoparticles for lungs using
ultrashort TE MRI. Magma. 27, 303–316 (2014).
24. Wang, Y. et al. Label-Free Au Cluster Used for in vivo 2D and 3D Computed Tomography of Murine Kidneys. Anal. Chem. 87,
343–345 (2015).
25. Rima, W. et al. Internalization pathways into cancer cells of gadolinium-based radiosensitizing nanoparticles. Biomaterials 34,
181–195 (2013).
26. Chao, W., Harteneck, B. D., Liddle, J. A., Anderson, E. H. & Attwood, D. T. Soft X-ray microscopy at a spatial resolution better than
15 nm. Nature 435, 1210–1213 (2005).
27. Wogelius, R. A. et al. Trace metals as biomarkers for eumelanin pigment in the fossil record. Science 333, 1622–1626 (2011).
28. Sakdinawat, A. & Attwood, D. T. Nanoscale X-ray imaging. Nat. Photonics 4, 840–848 (2010).
29. Shariatgorji, M., Svenningsson, P. & Andren, P. E. Mass spectrometry imaging, an emerging technology in neuropsychopharmacology.
Neuropsychopharmacology 39, 34–49 (2014).
30. Watrous, J. D. & Dorrestein, P. C. Imaging mass spectrometry in microbiology. Nat. Rev. Microbiol. 9, 683–694 (2011).
31. Zoriy, M., Dehnhardt, M., Matusch, A. & Becker, J. S. Comparative imaging of P, S, Fe, Cu, Zn and C in thin section of rat brain tumor
as well as control tissues by laser ablation inductively couples plasma mass spectrometry. Spectrochim. Acta B. 63, 375–382 (2008).
32. Pascolo, L. et al. Detection of PLGA-based nanoparticles at a single-cell level by synchrotron radiation FTIR spectromicroscopy and
correlation with X-ray fluorescence microscopy. Int. J. Nanomedicine 9, 2791–2801 (2014).
33. Crossley, E. L., Aitken, J. B., Vogt, S., Harris, H. H. & Rendina, L. M. Selective aggregation of a platinum-gadolinium complex within
a tumor-cell nucleus. Angew. Chem. Int. Ed. Engl. 49, 1231–1233 (2010).
34. Bourassa, D. et al. 3D imaging of transition metals in the zebrafish embryo by X-ray fluorescence microtomography. Metallomics 6,
1648–1655 (2014).
35. Drescher, D. et al. Quantitative imaging of gold and silver nanoparticles in single eukaryotic cells by laser ablation ICP-MS. Anal.
Chem. 84, 9684–9688 (2012).
36. Hare, D. J. et al. Three-dimensional elemental bio-imaging of Fe, Zn, Cu, Mn and P in a 6-hydroxydopamine lesioned mouse brain.
Metallomics 2, 745–753 (2010).
37. Sancey, L. et al. Laser spectrometry for multi-elemental imaging of biological tissues. Nat. Sc. Rep. 4, 6065 (2014).
38. Sancey, L. et al. Long-Term in vivo Clearance of Gadolinium-Based AGuIX Nanoparticles and Their Biocompatibility after Systemic
Injection. ACS Nano 9, 2477 (2015).
39. Moussaron, A. et al. Ultrasmall Nanoplatforms as Calcium-Responsive Contrast Agents for Magnetic Resonance Imaging. Small 11,
4900 (2015).
40. Kunjachan, S. et al. Nanoparticle Mediated Tumor Vascular Disruption: A Novel Strategy in Radiation Therapy. Nano Letters 15,
7488 (2015).
41. Cremers, D. A. & Radziemski, L. J. Handbook of Laser-Induced Breakdown Spectroscopy (Wiley, Chichester, 2006).
42. Miziolek, A. W., Palleschi, V. & Schechter, I. Laser-Induced Breakdown Spectroscopy: Fundamentals and Applications (Cambridge
University Press, 2006).
43. Meslin, P. Y. et al. Soil diversity and hydration as observed by ChemCam at Gale crater, Mars. Science 341, 1238670 (2013).
44. Williams, R. M. et al. Martian fluvial conglomerates at Gale crater. Science 340, 1068–1072 (2013).
45. Kizilyaprak, C., Longo, G., Daraspe, J. & Humbel, B. M. Investigation of resins suitable for the preparation of biological sample for
3-D electron microscopy. J. Struct. Biol. 189, 135–146 (2015).
9. www.nature.com/scientificreports/
9Scientific Reports | 6:29936 | DOI: 10.1038/srep29936
Acknowledgements
The authors gratefully acknowledge the LABEX PRIMES (ANR-11-LABX-0063) of Lyon 1 University within
the programs “Investissements d’Avenir” (ANR-11-IDEX-0007), the Lyon Science Transfert and INSERM/INCa
within the project “LAST”, the French Alsace Région and the Feder (European community funds) for financial
support. The authors also gratefully acknowledge the CTμ(Centre Technologique des Microstructures) for their
kind help in including the samples.
AuthorContributions
L.S. and V.Z. prepared all the biological samples. V.M.-R developed the LIBS imaging system and data analysis
software. G.P. and J.M.L. contributed to designing the LIBS experiment. Y.G. realized all the 3D LIBS models.
V.M.-R., Y.G., F.T., B.B. and L.S. prepared all figures shown in the manuscript. L.S. and V.Z. prepared the samples.
F.T., Y.G. and V.M.-R. analyzed the samples and treated the data. A.K., V.M.-R and F.P. developed the quantitative
methodology. J.M.B. performed the AFM investigations. F.P. performed the SEM investigations. Y.G., L.S., B.B.
and V.M.-R. wrote the main manuscript text. P.D., F.L., F.P., J.M.L., V.Z. and O.T. participated in writing the
article. All authors reviewed the manuscript.
Additional Information
Supplementary information accompanies this paper at http://www.nature.com/srep
Competing financial interests: The authors declare no competing financial interests.
How to cite this article: Gimenez, Y. et al. 3D Imaging of Nanoparticle Distribution in Biological Tissue by
Laser-Induced Breakdown Spectroscopy. Sci. Rep. 6, 29936; doi: 10.1038/srep29936 (2016).
This work is licensed under a Creative Commons Attribution 4.0 International License. The images
or other third party material in this article are included in the article’s Creative Commons license,
unless indicated otherwise in the credit line; if the material is not included under the Creative Commons license,
users will need to obtain permission from the license holder to reproduce the material. To view a copy of this
license, visit http://creativecommons.org/licenses/by/4.0/