This paper analyzes 360-degree videos on YouTube to characterize their properties. The authors collected a dataset of over 2,000 360-degree YouTube videos across different categories. They found that 360-degree videos have substantially higher bit rates and resolutions than regular videos due to their spherical format. However, 360-degree videos exhibit less variability in bit rates and less motion than regular videos. Understanding these characteristics can help optimize delivery of 360-degree videos over networks.
![Characterization of 360-degree Videos
Shahryar Afzal, Jiasi Chen, K. K. Ramakrishnan
University of California, Riverside
ABSTRACT
Online streaming of Virtual Reality and 360◦ videos is rapidly grow-
ing, as more and more major content providers and news outlets
adopt the format to enrich the user experience. We characterize
360◦ videos by examining several thousand YouTube videos across
more than a dozen categories. 360◦ videos, at first sight, seem to
pose a challenge for the network to stream because of their substan-
tially higher bit rates and larger number of resolutions. However, a
careful examination of video characteristics reveals that there are
significant opportunities for reducing the actual bit rate delivered
to client devices based on the user’s field of view. We study the
bit rate and the motion in 360◦ videos, and compare them against
regular videos by investigating several important metrics. We find
that 360◦ videos are less variable in terms of bit rate, and have less
motion than regular videos. Our expectation is that variability in
the bit rates due to the motion of the camera in regular videos (or
switching between cameras) is now translated to responsiveness
requirements for end to end 360◦ streaming architectures.
CCS CONCEPTS
• Networks → Network measurement;
KEYWORDS
360◦ videos, Measurements, Video delivery
ACM Reference format:
Shahryar Afzal, Jiasi Chen, K. K. Ramakrishnan. 2017. Characterization of
360-degree Videos. In Proceedings of VR/AR Network ’17, Los Angeles, CA,
USA, August 25, 2017, 7 pages.
https://doi.org/10.1145/3097895.3097896
1 INTRODUCTION
New rich multimedia experiences are being introduced to the online
user, including virtual reality (VR) and 360◦ video formats. VR video
content is currently served by several major platforms, with both
professional content providers such as NBC (who broadcast the
2016 Summer Olympics in VR), news outlets (e.g., CNN, New York
Times) and user-generated content platforms such as Facebook and
YouTube. 1
1In the paper, we use the terms “360◦ ” and “VR” interchangeably, as also the terms
“regular” and “non-360◦ ”.
Permission to make digital or hard copies of all or part of this work for personal or
classroom use is granted without fee provided that copies are not made or distributed
for profit or commercial advantage and that copies bear this notice and the full citation
on the first page. Copyrights for components of this work owned by others than ACM
must be honored. Abstracting with credit is permitted. To copy otherwise, or republish,
to post on servers or to redistribute to lists, requires prior specific permission and/or a
fee. Request permissions from permissions@acm.org.
VR/AR Network ’17, August 25, 2017, Los Angeles, CA, USA
© 2017 Association for Computing Machinery.
ACM ISBN 978-1-4503-5055-6/17/08...$15.00
https://doi.org/10.1145/3097895.3097896
In spite of the considerable work being done with regard to
video delivery over communication networks, challenges continue
to be presented as content creation and consumption evolve at a
rapid pace. New forms of videos require new ways of transmit-
ting the data efficiently so as to reduce the burden on the network
and the user. While improved video encoding [1], bit rate adapta-
tion [2], and multicast [3] have all previously been proposed and
well-studied to reduce data transfers from video streaming, it is
important to understand and address the challenges presented by
emerging forms of video streaming. In this paper, we focus on en-
hancing our understanding of the characteristics of 360◦ videos
and their requirements on streaming.
With the advent of 360◦ video, users finally have the opportunity
to actively engage with the video. However, 360◦ videos typically
consume more bandwidth than regular videos, since they require
more data to cover all spatial directions. For example, YouTube VR
recommends a resolution of 3840x2160 pixels, compared to usual
1080p ratio of 1920x1080 [4]. This four-fold increase in resolution
will certainly contribute to the growth of video traffic, especially for
wireless networks such as cellular and even WiFi. Current wireless
networks may have trouble to meet this growing demand. While it
is important to deliver high quality video to help achieve a reason-
able level of viewer quality of experience (QoE), the high capacity
requirements imposed by such rich video formats require us to
rethink how we can satisfy user QoE while finding a practical and
acceptable way of limiting bandwidth consumption.
Video delivery methods have evolved over time. Similarly, con-
tent providers have adapted the production and encoding of video
based on both consumption patterns and the variation of available
bandwidth to the user. In particular, the development of DASH
enables the delivery of content at a quality most suitable to the
available bandwidth (e.g., to minimize stalling of stream). Many of
these enhancements come from an understanding of the video char-
acteristics, delivery environment and user consumption, through
measurements. We believe similar understanding of 360◦ video
characteristics will greatly enable the evolution of efficient proto-
cols over both wired Internet and wireless channels. These new
video streams have inherent characteristics that are related to hu-
man factor considerations. For example, a user may not view a VR
video for as long of a duration as a regular video, due to feeling
uneasy or experiencing motion-sickness. So, understanding how
360◦ content has been created and their duration is also useful.
Additionally, possibly due to expected bandwidth limitations or
camera capabilities, the resolutions at which 360◦ video is encoded
is also different than what is being used for regular videos. While
these are expected challenges, we also examine the bit rate and
motion in the videos in greater detail to see if there are ways to
mitigate these challenges. In particular, we look at the variability
in the bit rate and the possible underlying cause for that variability](https://image.slidesharecdn.com/360tr-240123185038-b0bfb2dc/85/360_tr-pdf-1-320.jpg)
![Characterization of 360-degree Videos
Shahryar Afzal, Jiasi Chen, K. K. Ramakrishnan
University of California, Riverside
ABSTRACT
Online streaming of Virtual Reality and 360◦ videos is rapidly grow-
ing, as more and more major content providers and news outlets
adopt the format to enrich the user experience. We characterize
360◦ videos by examining several thousand YouTube videos across
more than a dozen categories. 360◦ videos, at first sight, seem to
pose a challenge for the network to stream because of their substan-
tially higher bit rates and larger number of resolutions. However, a
careful examination of video characteristics reveals that there are
significant opportunities for reducing the actual bit rate delivered
to client devices based on the user’s field of view. We study the
bit rate and the motion in 360◦ videos, and compare them against
regular videos by investigating several important metrics. We find
that 360◦ videos are less variable in terms of bit rate, and have less
motion than regular videos. Our expectation is that variability in
the bit rates due to the motion of the camera in regular videos (or
switching between cameras) is now translated to responsiveness
requirements for end to end 360◦ streaming architectures.
CCS CONCEPTS
• Networks → Network measurement;
KEYWORDS
360◦ videos, Measurements, Video delivery
ACM Reference format:
Shahryar Afzal, Jiasi Chen, K. K. Ramakrishnan. 2017. Characterization of
360-degree Videos. In Proceedings of VR/AR Network ’17, Los Angeles, CA,
USA, August 25, 2017, 7 pages.
https://doi.org/10.1145/3097895.3097896
1 INTRODUCTION
New rich multimedia experiences are being introduced to the online
user, including virtual reality (VR) and 360◦ video formats. VR video
content is currently served by several major platforms, with both
professional content providers such as NBC (who broadcast the
2016 Summer Olympics in VR), news outlets (e.g., CNN, New York
Times) and user-generated content platforms such as Facebook and
YouTube. 1
1In the paper, we use the terms “360◦ ” and “VR” interchangeably, as also the terms
“regular” and “non-360◦ ”.
Permission to make digital or hard copies of all or part of this work for personal or
classroom use is granted without fee provided that copies are not made or distributed
for profit or commercial advantage and that copies bear this notice and the full citation
on the first page. Copyrights for components of this work owned by others than ACM
must be honored. Abstracting with credit is permitted. To copy otherwise, or republish,
to post on servers or to redistribute to lists, requires prior specific permission and/or a
fee. Request permissions from permissions@acm.org.
VR/AR Network ’17, August 25, 2017, Los Angeles, CA, USA
© 2017 Association for Computing Machinery.
ACM ISBN 978-1-4503-5055-6/17/08...$15.00
https://doi.org/10.1145/3097895.3097896
In spite of the considerable work being done with regard to
video delivery over communication networks, challenges continue
to be presented as content creation and consumption evolve at a
rapid pace. New forms of videos require new ways of transmit-
ting the data efficiently so as to reduce the burden on the network
and the user. While improved video encoding [1], bit rate adapta-
tion [2], and multicast [3] have all previously been proposed and
well-studied to reduce data transfers from video streaming, it is
important to understand and address the challenges presented by
emerging forms of video streaming. In this paper, we focus on en-
hancing our understanding of the characteristics of 360◦ videos
and their requirements on streaming.
With the advent of 360◦ video, users finally have the opportunity
to actively engage with the video. However, 360◦ videos typically
consume more bandwidth than regular videos, since they require
more data to cover all spatial directions. For example, YouTube VR
recommends a resolution of 3840x2160 pixels, compared to usual
1080p ratio of 1920x1080 [4]. This four-fold increase in resolution
will certainly contribute to the growth of video traffic, especially for
wireless networks such as cellular and even WiFi. Current wireless
networks may have trouble to meet this growing demand. While it
is important to deliver high quality video to help achieve a reason-
able level of viewer quality of experience (QoE), the high capacity
requirements imposed by such rich video formats require us to
rethink how we can satisfy user QoE while finding a practical and
acceptable way of limiting bandwidth consumption.
Video delivery methods have evolved over time. Similarly, con-
tent providers have adapted the production and encoding of video
based on both consumption patterns and the variation of available
bandwidth to the user. In particular, the development of DASH
enables the delivery of content at a quality most suitable to the
available bandwidth (e.g., to minimize stalling of stream). Many of
these enhancements come from an understanding of the video char-
acteristics, delivery environment and user consumption, through
measurements. We believe similar understanding of 360◦ video
characteristics will greatly enable the evolution of efficient proto-
cols over both wired Internet and wireless channels. These new
video streams have inherent characteristics that are related to hu-
man factor considerations. For example, a user may not view a VR
video for as long of a duration as a regular video, due to feeling
uneasy or experiencing motion-sickness. So, understanding how
360◦ content has been created and their duration is also useful.
Additionally, possibly due to expected bandwidth limitations or
camera capabilities, the resolutions at which 360◦ video is encoded
is also different than what is being used for regular videos. While
these are expected challenges, we also examine the bit rate and
motion in the videos in greater detail to see if there are ways to
mitigate these challenges. In particular, we look at the variability
in the bit rate and the possible underlying cause for that variability](https://image.slidesharecdn.com/360tr-240123185038-b0bfb2dc/75/360_tr-pdf-1-2048.jpg)
![VR/AR Network ’17, August 25, 2017, Los Angeles, CA, USA Shahryar Afzal, Jiasi Chen, K. K. Ramakrishnan
(e.g., motion) of 360◦ videos in contrast to regular videos. Under-
standing all these aspects will help in future design and continual
improvement of video delivery mechanisms.
The contributions of this paper are as follows:
• We collect a dataset of YouTube 360◦ videos and report on
their aggregate statistics, including bit rates, resolutions, and
durations.
• We develop a technique to estimate the effective resolution
of 360◦ videos based on the typical “field of view” of a VR
headset. This helps us to understand the strategies that may
be available for mitigating the bandwidth requirements for
360◦ videos.
• We compare the intra-video variability of bit rates of 360◦
and regular videos. Our main observation is that the bit
rate variability of the 360◦ videos is considerably lower than
for the regular videos. We hypothesize that the underlying
cause is the reduced motion in 360◦ videos, and examine
the motion characteristics of several representative 360◦ and
regular videos.
2 CURRENT PRACTICE
Background: Videos are recorded using specialized 360◦ recording
setups, consisting of between 2-6 individual cameras (e.g., 6 GoPros
arranged in a cubic arrangement). The videos are synchronized in
time and stitched in space using specialized software to create a
spherical view. The spherical coordinates are converted to rectan-
gular format (similar to the process of flattening the globe of the
Earth into a 2-dimensional map), then compressed to H.264 format
or another format of the user’s choice. Once processing is complete,
the user uploads the video to the server, optionally adding metadata
to alert the server of the 360◦ format and that special processing is
required. The server may perform additional processing to convert
to video to a streaming format (e.g., MPEG-DASH). The video is
then ready to stream to viewers using the content provider’s choice
of streaming protocol. Viewers can play back the video using a
custom video player provided by the content provider. The user
can rotate the field of view of the video using her mouse/finger (if
she is using a web browser/mobile app) or through head motions
(if she is wearing a VR headset).
Current Practice: We examined packet traces to see how sev-
eral popular content providers (Facebook, YouTube) stream 360◦
videos in desktop players. We find that Facebook treats 360◦ video
streaming as a progressive file transfer, transferring the entire
video (using byte ranges), no matter where the user is looking
at in the scene. Although Facebook has publicly described spatial
video chunking [5], we were unable to find evidence of this in the
desktop 360◦ video player, as the byte range requests increase se-
quentially even if we rotate the view. This both wastes network
resources and may result in high costs for the user in the current
usage-based charging environment, especially for a user who is
receiving video data that she does not even view. NBC uses a similar
tactic to Facebook where only one file is transferred progressively.
YouTube treats 360◦ videos similar to regular MPEG-DASH
videos: it encodes these videos at different resolutions and streams
the video chunks at the quality appropriate for the available net-
work bandwidth. CNN also uses similar DASH-like chunking at
different resolution encodings.
Category # of Videos Category # of Videos
All 2285 Roller coaster 325
Animals 216 Scenery 315
Cartoon 197 Shark 24
Concert 67 Skydiving 70
Documentary 122 Space 126
Driving 176 Sports 139
Horror 180 Video game 197
Movie trailer 131
Table 1: YouTube video dataset
x
y
z
(a)
-100 -50 0 50 100
Vertical angle
60
65
70
75
Number
of
tiles
(b)
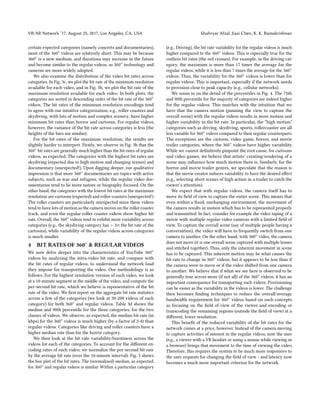
Figure 1: Number of tiles downloaded as user’s head rotation
changes.
3 YOUTUBE MEASUREMENTS
In this section, we describe our measurements of YouTube 360◦
videos in order to understand their characteristics in-depth. We
first selected a number of videos from YouTube, and then classified
them based on their genre, using the following methodology. We ob-
tained an initial set of 360◦ videos by searching YouTube using the
keyword “360”, and including a filter for 360◦ videos. This gave us
approximately 700 of the 360◦ videos. To expand this set of videos
and find their non-360◦ counterparts, we categorize the videos, and
use the category names as new search keywords, resulting in a total
of 4570 videos (2285 regular and 2285 360◦ Videos). Specifically, we
calculate the term frequency across all the video titles, removing
filler words such as “the” and “and”) and map them to the appropri-
ate category (e.g., basketball and soccer map to “Sports” category).
We stop collecting videos from a category once the search results
are deemed less relevant (according to YouTube’s relevance rank-
ing) (i.e., after the nth page of search results, with n determined
qualitatively per-category). The number of videos we collected in
each category is shown in Table 1.
Summary statistics: A simple first question that arises is: how
does the duration of 360◦ videos differ from non-360◦ videos? We
expect that 360◦ videos, being a relatively new format, will mainly
be used by early adopters who are still determining the best way
to use the new format, and therefore are still experimenting with
shorter clips. In addition, longer videos are also unlikely due to
users experiencing fatigue with current VR headsets. To verify this,
we plot the CDF of the duration of the 360◦ and non-360◦ videos in
Fig. 2a. The default soft limit on the uploaded video duration is 15
minutes, but users can extend the maximum allowable duration by
verifying their account information. We observe that 360◦ videos
have a shorter duration than non-360◦ videos (median duration
143s vs 490.5s, respectively), and also have a shorter tail, matching
our expectation.](https://image.slidesharecdn.com/360tr-240123185038-b0bfb2dc/85/360_tr-pdf-2-320.jpg)
![Characterization of 360-degree Videos VR/AR Network ’17, August 25, 2017, Los Angeles, CA, USA
(a) Duration (b) Number of Resolutions (c) Resolution Distribution (d) Bit rates
Figure 2: Summary statistics of 360◦ versus non-360◦ videos.
(a) Duration across cate-
gories
(b) Bit rate of Maximum Res-
olution
(c) Bit rate of Minimum Res-
olution
Median 90th %ile
Driving
360
7558 16273
Driving
reg
2031.8 4627.2
Horror
360
4185.4 14078
Horror
reg
1648.1 3848.2
Roller 360 5516.5 20115
Roller reg 2377.3 5681.9
(d) Median and 90th %ile Bit
rates (kbps)
Figure 3: Per-category measurements of 360◦ vs non-360◦ videos.
We then examine the resolution of 360◦ videos. YouTube recom-
mends a minimum resolution of 7168x3584 for uploads [4]. YouTube
transcodes the videos into various preset resolutions, e.g., to support
adaptive streaming. We wish to understand what are the typical
preset resolutions, and how they differ from the resolutions of reg-
ular videos. By examining packet traces, we found that the set of
the encodings available for desktops and mobile devices (Android
YouTube app) were identical in the vast majority of cases, so we
focus on the videos encoded for desktops for the remainder of this
section. In Fig. 2c, we plot the fraction of the total set of videos
which are encoded at each resolution (filtering out uncommon res-
olutions with <100 videos). We observe that 360◦ videos tend to
have higher maximum resolutions than regular videos, but similar
minimum resolutions. The minimum resolution we observe across
all videos is 82x144, and the maximum we observe is 8192x8192.
Also, we also observe that a small number of videos (55) have a
square resolution (e.g., 4096 by 4096), which is due to the left eye
and right eye being encoded separately and stacked on top of each
other (steroscopic encoding). 360◦ videos also tend to have a larger
number of distinct resolutions, as shown in Fig. 2b, where we plot
the CDF of the number of resolutions encoded for each video.
Effective resolution based on field of view: We next wish to com-
pare the bit rates of 360◦ and regular videos. However, note that only
a portion of the 360◦ video is seen by the user, since VR headsets
have a limited field of view. Therefore, comparing the advertised
bit rate of 360◦ videos with the advertised bit rate of regular videos
may be an unfair comparison. To address this, we introduce the
notion of “effective resolution” of the 360◦ videos: namely, based
on a typical field-of-view of a VR headset (likely to be similar, if not
slightly higher than with a Flash player on a browser), we calculate
the fraction of the video pixels viewed. This calculation is based on
YouTube’s equirectangular projection, which converts the rectan-
gular video streamed by the server to a spherical representation
that is viewed by the user in the VR headset.
As an example, assume that the VR headset has a 110◦ horizontal
field of view and a 90◦ vertical field of view. A naive calculation of
the fraction of the video viewed would be: 90◦
180◦ × 110◦
360◦ = 15%. To im-
prove this estimate, we can take into account the user’s vertical head
position. When the user faces upwards or downwards, the equirect-
angular projection results in a larger number of tiles being down-
loaded, as in Fig. 1a. Assuming that the user typically looks ahead,
left, right or behind, but occasionally glances upwards/downwards,
we can calculate the average fraction of tiles downloaded. The de-
tails can be found in a technical report [6]. In Fig. 1b, we plot the
number of tiles downloaded as the user rotates her head vertically
(still assuming a 110◦ horizontal and a 90◦ vertical field of view,
and that the video is divided into 288 tiles at a 15◦ angle. .) The
resulting percentage of tiles downloaded is thus slightly higher
than the naive calculation, coming to 22% (64 tiles in Fig. 1b).
Using this definition of effective resolution, in Fig. 2d, we plot
the CDF of the bit rate for 360◦ and regular videos. Clearly, the bit
rates of the 360◦ videos are generally higher. However, by factoring
in the effective resolution experienced by the user, we can see that
the bit rate of the 360◦ videos experienced by the user in her limited
field of view is similar to that of the regular videos.
Per-category comparison of 360◦ videos: We next discuss
the characteristics of regular and 360◦ videos across different cate-
gories. We first measure the median duration of videos in different
categories (Fig. 3a). The categories are sorted by descending dura-
tion of regular videos. While regular videos have long duration in](https://image.slidesharecdn.com/360tr-240123185038-b0bfb2dc/85/360_tr-pdf-3-320.jpg)
![Characterization of 360-degree Videos VR/AR Network ’17, August 25, 2017, Los Angeles, CA, USA
a
n
i
m
a
l
s
3
6
0
(
1
a
)
a
n
i
m
a
l
s
r
e
g
(
1
b
)
c
a
r
t
o
o
n
3
6
0
(
2
a
)
c
a
r
t
o
o
n
r
e
g
(
2
b
)
c
o
n
c
e
r
t
3
6
0
(
3
a
)
c
o
n
c
e
r
t
r
e
g
(
3
b
)
d
o
c
u
m
e
n
t
a
r
y
3
6
0
(
4
a
)
d
o
c
u
m
e
n
t
a
r
y
r
e
g
(
4
b
)
d
r
i
v
i
n
g
3
6
0
(
5
a
)
d
r
i
v
i
n
g
r
e
g
(
5
b
)
h
o
r
r
o
r
3
6
0
(
6
a
)
h
o
r
r
o
r
r
e
g
(
6
b
)
m
o
v
i
e
T
r
a
i
l
e
r
3
6
0
(
7
a
)
m
o
v
i
e
T
r
a
i
l
e
r
r
e
g
(
7
b
)
r
o
l
l
e
r
C
o
a
s
t
e
r
3
6
0
(
8
a
)
r
o
l
l
e
r
C
o
a
s
t
e
r
r
e
g
(
8
b
)
s
c
e
n
e
r
y
3
6
0
(
9
a
)
s
c
e
n
e
r
y
r
e
g
(
9
b
)
s
h
a
r
k
3
6
0
(
1
0
a
)
s
h
a
r
k
r
e
g
(
1
0
b
)
s
k
y
d
i
v
i
n
g
3
6
0
(
1
1
a
)
s
k
y
d
i
v
i
n
g
r
e
g
(
1
1
b
)
s
p
a
c
e
3
6
0
(
1
2
a
)
s
p
a
c
e
r
e
g
(
1
2
b
)
s
p
o
r
t
s
3
6
0
(
1
3
a
)
s
p
o
r
t
s
r
e
g
(
1
3
b
)
v
i
d
e
o
g
a
m
e
3
6
0
(
1
4
a
)
v
i
d
e
o
g
a
m
e
r
e
g
(
1
4
b
)
Category
0
0.5
1
1.5
2
Normalized
Bitrate
Figure 4: Variable bit rate across video categories: “Zoomed-in” from Fig. 5 for detail.
1a
1b
2a
2b
3a
3b
4a
4b
5a
5b
6a
6b
7a
7b
8a
8b
9a
9b
10a
10b
11a
11b
12a
12b
13a
13b
14a
14b
Category
0
10
20
30
Normalized
Bitrate
Figure 5: Variable bit rate across video categories
Motion characteristics: We next investigate the motion char-
acteristics of 360◦ versus regular videos. We wish to understand
whether the motion information can explain the higher bit rate
variability, as previously hypothesized. During recording of reg-
ular videos, the camera can move in 3D space, as well as rotate
(yaw, pitch, and roll). When these videos are encoded, the motion
vectors must capture both the direction and magnitude of these
3D translations as well as the rotations. 360◦ videos, on the other
hand, are invariant to rotation, by definition, because they cap-
ture all 360◦ information from the current 3D position. Therefore,
we hypothesize that 360◦ videos will have smaller motion vectors
than regular videos, since their motion vectors only need to encode
3D translations, and not rotations. On the other hand, the motion
vectors of regular videos will also change more rapidly over time,
since any movement of the camera results in more non-zero motion
vectors.
Our methodology is as follows. Using ffprobe [7], we extract
the motion vectors from two representative videos in low-motion
and high-motion categories: horror and skydiving. We compute
the magnitude of the motion vector for each macroblock at posi-
tion (x,y) in a frame, take the average across x or y, and plot the
magnitude over time.
The results are shown in Fig. 6 macroblocks at different y loca-
tions. In the spatial domain, the 360◦ skydiving video has some
spatial locality (at y = 50), while the regular skydiving video does
not. We believe that this is because a regular video camera used
in skydiving is apt to rotate randomly due to loss of user control,
and so experiences a high degree of motion across all regions of
the video, while a 360◦ video camera is invariant to rotation. In the
case of the 360◦ skydiving video, y = 50 corresponds to the ground,
which is the changing part of the scene. The horror videos do not
show spatial locality because both the 360◦ video and the regular
video are relatively stationary, similar to a surveillance camera.
Now consider the change in motion over time in Fig. 6. Com-
paring the 360◦ horror and skydiving videos, we can see that the
average motion vector magnitude is higher for the high-motion
skydiving video, which makes sense. Comparing the 360◦ and the
regular videos, we can see that per-category, the 360◦ videos have
lower motion vector magnitude. The regular videos also seem to
exhibit greater variability over time, while the 360◦ videos are more
uniform. To compare the bit rates, in Fig. 7, we plot the per-frame
bit rate for the same four videos evaluated in Fig. 6. Comparing
the 360◦ horror and skydiving videos, the bit rate variability is
higher for the high-motion skydiving video. Comparing regular
and 360◦ videos, we can see that the mean bit rate of the regular
videos varies more over time, while the 360◦ videos seem to have
a more constant mean. This is consistent with our observations
above concerning the motion vector variability across time. We
plan to look at a larger number of videos, across more categories,
to confirm this hypothesis.
5 RELATED WORK
Video compression: Recent versions of MPEG (e.g., H.264/MPEG-4,
H.265) enable regions of interest to be encoded at a higher quality
than background objects [8]. Specifically, each frame can be divided
into slices (spatial regions), and each slice encoded as I, P, or B.
Our work is complementary to this and tries to understand the
differences between spatial variations in regular and 360◦ videos,
which encoders could then leverage.
Video adaptation: Recent work has focused on adapting the video
quality based on the estimated network bandwidth [2, 9, 10]. Our
goal is complementary: to understand how much bit rate variabil-
ity a 360◦ video has, and therefore how high of a bit rate can be](https://image.slidesharecdn.com/360tr-240123185038-b0bfb2dc/85/360_tr-pdf-5-320.jpg)
![VR/AR Network ’17, August 25, 2017, Los Angeles, CA, USA Shahryar Afzal, Jiasi Chen, K. K. Ramakrishnan
(a) Horror 360◦ (b) Skydiving 360◦ (c) Horror regular (d) Skydiving regular
Figure 6: Motion vector magnitude over time.
0 500 1000 1500 2000
Frames
0
20
40
Bitrate
(Mbps)
(a) Horror 360◦
0 500 1000 1500 2000
Frames
0
20
40
60
Bitrate
(Mbps)
(b) Skydiving 360◦
0 500 1000 1500 2000
Frames
0
2
4
6
Bitrate
(Mbps)
(c) Horror regular
0 500 1000 1500 2000
Frames
0
2
4
6
8
Bitrate
(Mbps)
(d) Skydiving regular
Figure 7: Variable bit rate across time.
supplied under the given bandwidth. Recently, spatially-adaptive
chunk selection schemes have also been proposed [11, 12]. Our
work can help guide these adaptation schemes by understanding
the bit rate variability across spatial chunks.
Adaptation for 3D videos based on object QoE, redundant infor-
mation, and user perception has been studied [13–15]. The 360◦
videos we consider in this work are omnidirectional 2D videos, as
opposed to 3D videos with a fixed field of view in which the cam-
era view must shift to show different parts of the same scene. The
ideas of prioritizing objects in 3D and teleimmersive video, how-
ever, could be useful in our future work of performing in-network
manipulation of 360◦ videos.
360◦ videos: [16] studies characteristics of YouTube videos, but
does not consider more recent 360◦ videos. [17] performs a mea-
surement study of the head motions of a small set of users viewing
360◦ videos, and [18, 19] study 360◦ projection schemes. Our work
aims to add to this body of measurement studies by understanding
motion and bit rate characteristics of 360◦ videos.
6 CONCLUSIONS
This paper characterized 360◦ videos from the point of view of
network streaming, and compared them to regular videos that
have been the popular media format until now. Our comparison
shows that 360◦ videos have substantially higher bit rates and larger
number of resolutions; however, after more careful examination, we
find that the bit rates for the 360◦ videos have less variability than
the regular videos, which can be highly beneficial for the network
due to the network provisioning for the peak rates.
To explain lower bit rate variability, we demonstrated that the
average motion for the 360◦ video is less than that for a comparable
regular video. We believe that this is because the motion described
in a 360◦ video is that which is inherently in the scene, rather
than the rotation or panning of the camera in space.This implies
that the panning now occurs at the time of user viewing the video.
Thus, the new requirement on the network is that it needs to be
more responsive to the user changing the field of view. We believe
these aspects have deep implications on networked video streaming
systems for both capacity and latency requirements.
We gratefully acknowledge funding from Huawei Technologies
Co., Ltd. Innovation Research Program.
REFERENCES
[1] Alan C. Bovik. The Essential Guide to Video Processing. Academic Press, 2nd
edition, 2009.
[2] Mpeg-dash. http://dashif.org/.
[3] Jiasi Chen, Mung Chiang, Jeffrey Erman, Guangzhi Li, K.K. Ramakrishnan, and
Rakesh K Sinha. Fair and optimal resource allocation for LTE multicast (eMBMS):
Group partitioning and dynamics. IEEE INFOCOM, 2015.
[4] Upload 360-degree videos - youtube help - google help. http://support.google.
com/youtube/answer/6178631.
[5] Next-generation video encoding techniques for 360
video. https://code.facebook.com/posts/1126354007399553/
next-generation-video-encoding-techniques-for-360-video-and-vr/.
[6] Characteristics of 360-degree videos (technical report). http://www.cs.ucr.edu/
~jiasi/360_tr.pdf.
[7] Vadim Kantorov and Ivan Laptev. Efficient feature extraction, encoding and
classification for action recognition. In IEEE CVPR, 2014.
[8] Thomas Wiegand, Gary J Sullivan, Gisle Bjontegaard, and Ajay Luthra. Overview
of the h. 264/avc video coding standard. IEEE Trans. Circ. Sys. for Video Tech.,
13(7):560–576, 2003.
[9] Junchen Jiang, Vyas Sekar, and Hui Zhang. Improving Fairness, Efficiency, and
Stability in HTTP-based Adaptive Video Streaming. ACM CoNEXT, 2012.
[10] Te-Yuan Huang, Ramesh Johari, Nick McKeown, Matthew Trunnell, and Mark
Watson. A buffer-based approach to rate adaptation: Evidence from a large video
streaming service. ACM SIGCOMM, 2014.
[11] Feng Qian, Lusheng Ji, Bo Han, and Vijay Gopalakrishnan. Optimizing 360 video
delivery over cellular networks. In All Things Cellular Workshop, 2016.
[12] Xavier Corbillon, Alisa Devlic, Gwendal Simon, and Jacob Chakareski. Viewport-
adaptive navigable 360-degree video delivery. CoRR, abs/1609.08042, 2016.
[13] Pengye Xia and K. Nahrstedt. Object-level bandwidth adaptation framework for
3d tele-immersive system. 2013 IEEE ICME, pages 1–6, July 2013.
[14] Zhenyu Yang, Bin Yu, Klara Nahrstedt, and Ruzena Bajscy. A multi-stream
adaptation framework for bandwidth management in 3d tele-immersion. ACM
NOSSDAV, 2006.
[15] Wanmin Wu, Ahsan Arefin, Gregorij Kurillo, Pooja Agarwal, Klara Nahrstedt,
and Ruzena Bajcsy. Color-plus-depth level-of-detail in 3d tele-immersive video:
A psychophysical approach. ACM MMSys, 2011.
[16] Michael Zink, Kyoungwon Suh, Yu Gu, and Jim Kurose. Characteristics of youtube
network traffic at a campus network - measurements, models, and implications.
Computer Networks, 53(4):501–514, 2009.
[17] Yanan Bao, Huasen Wu, Albara Ah Ramli, Bradley Wang, and Xin Liu. Viewing
360 degree videos: Motion prediction and bandwidth optimization (poster). IEEE
ICNP, 2016.
[18] Chao Zhou, Zhenhua Li, and Yao Liu. A measurement study of oculus 360 degree
video streaming. ACM MMSys, 2017.
[19] M. Yu, H. Lakshman, and B. Girod. A framework to evaluate omnidirectional
video coding schemes. In 2015 IEEE International Symposium on Mixed and
Augmented Reality, pages 31–36, Sept 2015.](https://image.slidesharecdn.com/360tr-240123185038-b0bfb2dc/85/360_tr-pdf-6-320.jpg)
![Characterization of 360-degree Videos VR/AR Network ’17, August 25, 2017, Los Angeles, CA, USA
+β0
x
y
z
+α0 v v’’
v’
-α0
u’
u’’
-β0
Figure 8: Calculating the number of tiles needed to cover the
shaded area.
A CALCULATING EFFECTIVE RESOLUTION
OF 360◦ VIDEOS
Consider Fig. 8. Let the spherical coordinates be denoted by (θ,ϕ),
and the 3D Cartesian coordinates be denoted by (x,y,z). Suppose
the center of the user’s field-of-view isv, which is given in spherical
coordinates (yaw and pitch) from the head tracking software. The
user’s field-of-view extends by α◦
0 horizontally and β◦
0 vertically
from v. The number of tiles viewed is determined by the boundary
of the user’s field-of-view. Therefore, we need to determine the
(x,y,z) coordinates of the boundary, perform a 2D projection (e.g.,
equirectangular), and count the number of tiles covered by the
projected area.
Without loss of generality, assume thatv = (θ, 0◦). Letv′,v′′,u′,u′′
be points on the boundary of the field-of-view, as shown in Fig. 8,
and let β = π
2 − θ.
To convert to Cartesian coordinates, we have that:
x = cosα0 cos β (1)
y = sinα0 (2)
z = sin β (3)
From there, to convert to spherical coordinates, we have that:
θ = arccosz =
π
2
− β (4)
ϕ = arctan
y
x
= arctan
tanα0
cos β
(5)
Now let us consider the equirectangular projection. Let the coor-
dinate system of the 2D video be denoted by (X,Y ). The equirectan-
gular projection is defined as X = ϕ,Y = θ. Let the angular width
of each tile be GX ,GY in the horizontal and vertical directions,
respectively. We assume that there is no roll (rotation) in the user’s
field of view (we leave this calculation to future work). Then the
number of tiles of video spanned by the horizontal field-of-view
[−α0, +α0], centered at v, can be found from the difference of the
X-coordinates (ϕ=coordinates) of v′ and v′′:
NX (β) =
2 arctan tan α0
cos β
GX
(6)
The number of tiles spanned by the vertical field-of-view [−β0, +β0],
centered atv, can be found from the difference of the Y-coordinates
(θ-coordinates) of u′ and u′′:
NY =
&
2β0
GY
'
(7)
To calculate the number of tiles, we can scan over β between
vertical tile i and i + 1 and count the maximum number of tiles
needed:
N (β) =
NY −1
X
i=0
max
B(i)≤β ≤B(i+1)
NX (α0, β) (8)
B(i) =
$
β0
GY
%
+ i
!
GY (9)
where B(i) is defined as the lower angle of the ith vertical tile.
Finally, to get the average number of tiles used, we assume a
probability distribution function on the user’s pitch; i.e., we assume
knowledge of PDF fθ . Then the average number of tiles viewed is:
Z π
2
− π
2
N
π
2
− θ
fθ (θ)dθ (10)
We set α0 = 110◦
2 and β0 = 90◦
2 , which are typical horizontal and
vertical field-of-views, respectively, for VR headsets [11].](https://image.slidesharecdn.com/360tr-240123185038-b0bfb2dc/85/360_tr-pdf-7-320.jpg)


