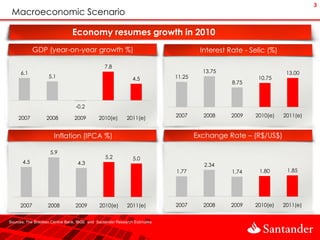
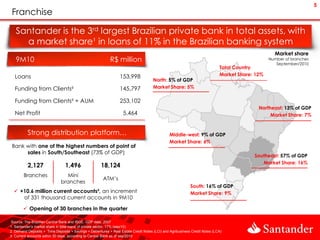
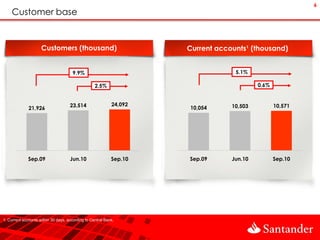
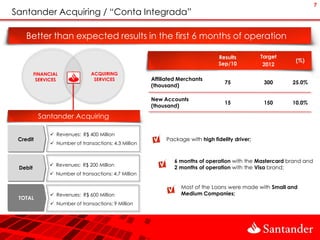
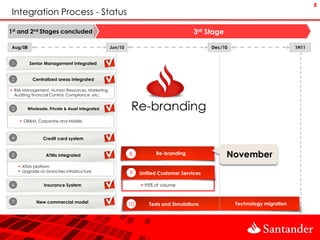
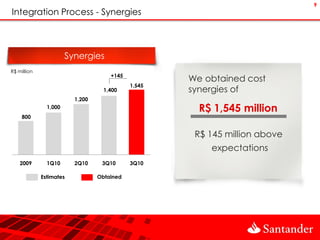
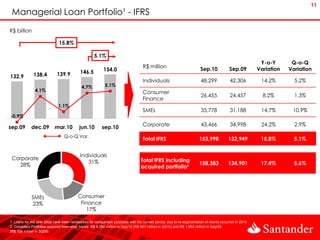
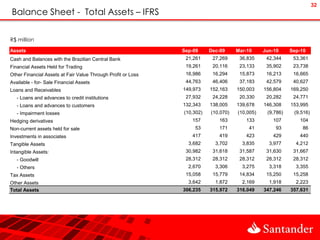
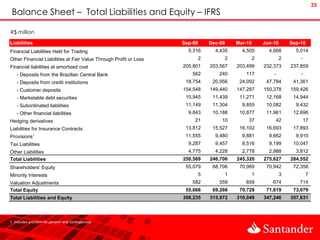
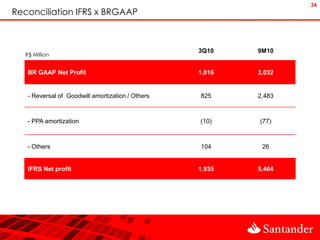
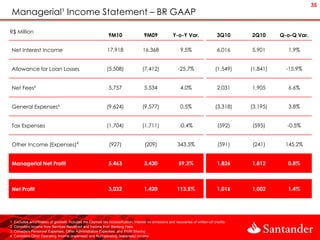
Banco Santander (Brasil) reported results for the first 9 months of 2010. The bank is the 3rd largest private bank in Brazil by total assets, with an 11% market share of loans. Despite the economic crisis, GDP growth resumed in 2010. Santander saw growth in key metrics such as loans, deposits, assets under management, and net profit. The bank has integrated acquisitions successfully and achieved cost synergies above targets. Going forward, Santander aims to continue growing its customer base and expanding its distribution network across Brazil.
1. The document summarizes Santander Brasil's 1H10 results, highlighting growth in net profits, loans, and fees.
2. Loan volumes increased across most segments, with notable growth in payroll, mortgage, and credit card loans.
3. Asset quality improved with a comfortable coverage ratio, while performance ratios like efficiency and ROAE also enhanced over the last 12 months.
Banco Santander (Brasil) reported its 2010 results. The Brazilian economy resumed growth in 2010 with GDP increasing 7.7% year-over-year after contracting 0.6% in 2009. Santander is the 3rd largest private bank in Brazil by total assets and had a market share of 11% in loans. In 2010, Santander's loan portfolio grew to R$160.6 billion while net profit increased to R$7.4 billion. The bank saw strong growth in its customer base, which expanded to over 24.8 million customers, an increase of 10.5% from the prior year.
This document provides an overview of Banco Santander's 1Q10 results in Brazil. It discusses the improving Brazilian macroeconomic environment in 2010-2011, Santander's strategy to integrate its acquisitions and become the third largest private bank in Brazil, and highlights synergies realized from the integration. Key metrics on loans, deposits, profits, and branch network are also presented.
The document provides a disclaimer and forward-looking statements regarding a presentation by Banco Santander Totta, S.A. and Banco Santander, S.A. It cautions that the presentation contains forward-looking statements that are subject to risks and uncertainties that could cause actual results to differ materially. It also states that the information in the presentation should be read in conjunction with other public disclosures and does not constitute an offer to buy or sell securities.
SANTANDER CONSUMER FINANCE-SANTANDER INVESTOR DAY 2011BANCO SANTANDER
Santander Consumer Finance se mueve en niveles récord de beneficios en 2011 y continuará haciéndolo en 2012 y 2013. Presentación Magda Salarich. Santander Investor Day 2011
The banking sector in Malaysia saw stable loan growth of 10.9% year-over-year in March 2009, driven partly by a 20-30% jump in loans to government agencies and non-bank financial institutions. However, leading loan indicators remained subdued and loan growth is expected to slow significantly to 2-3% in 2009 due to weaker economic conditions. Non-performing loan ratios continued to improve in March. The report maintains a neutral outlook on Malaysian banks, expecting them to perform better than anticipated despite the economic downturn.
This document contains a disclaimer from Banco Santander (Mexico) regarding forward-looking statements in the presentation. It cautions that actual results could differ materially from expectations due to risks and uncertainties. It also notes legal requirements for any securities offerings and says statements about historical performance do not guarantee future results. The presentation provides an overview of Santander Mexico, highlighting its strong franchise, efficient infrastructure, solid performance and profitability compared to peers.
- Embraer announced strong commercial jet sales in the third quarter including 30 firm orders and options, and its order backlog reached a record high of $21.6 billion despite currency volatility negatively impacting earnings. However, the majority of Embraer's revenues are dollar-denominated, providing a natural hedge against currency fluctuations. Embraer also uses hedging instruments to further mitigate currency exposure, recognizing a $92.9 million loss this quarter from marking currency hedges to market.
The document provides the 1Q11 results for Banco Santander (Brasil) S.A. Some key points:
- Net profit before tax increased 25.4% year-over-year to R$2,724 million in 1Q11. Net profit rose 17.5% year-over-year to R$2,071 million.
- Total revenues grew 6.6% year-over-year to R$8,690 million in 1Q11, with net interest income increasing 3.9% quarter-over-quarter.
- The bank saw double-digit growth in its loan portfolio and funding from clients, with the expanded credit portfolio rising 21.9% year-
VTB Capital "Russia Calling: London Session May-June 2011MRSK Centre
The document provides an overview of IDGC Capital's 2010 results and 2011 forecast. It highlights the company's strong growth across key financial metrics like revenue, EBITDA, and net profit between 2008-2011. Capitalization is forecast to grow at a CAGR of 64% during this period. The company has a large network across central Russia and implemented a KPI system to improve efficiency under RAB regulation. Prospects for continued growth are seen through lower depreciation and sector undervaluation relative to foreign peers.
- Benetton Group reported financial results for FY 2011 with revenues of €2.03 billion, a 1% decrease from FY 2010.
- Gross profit declined 6.9% to €882 million due to cost pressures and negative currency impacts. Operating expenses were reduced through cost cutting actions.
- Net income decreased 28.3% to €73 million, impacted by lower hedging gains compared to prior year and a lower tax rate.
- Emerging markets showed double digit revenue growth while traditional Western markets declined 4%. The wholesale channel was flat while direct sales declined slightly on a comparable basis.
The budget focuses on fiscal consolidation and boosting growth. It marginally increases tax deductions but also raises some taxes. Funding is enhanced for infrastructure through tax-free bonds and ECB changes. The power sector may benefit from coal duty exemptions and FSA commitments. However, the auto sector faces higher excise duties that could impact large carmakers. Key assumptions around GDP and oil prices make deficit targets optimistic. Overall policy measures only partially address issues around land, environment and state electricity boards.
OGX reported highlights from its 2009 results and subsequent events:
- Completed five exploratory wells in the Campos Basin with estimated volumes between 2.1 to 4.7 billion barrels of oil equivalent.
- Acquired additional exploration blocks and increased participation in existing blocks.
- Independent assessment certified over 6.7 billion barrels of risked prospective resources across OGX's portfolio.
- Chartered its first FPSO and entered into a long-term production services agreement.
- Maintained a strong cash position of R$7.3 billion to fund its extensive exploratory commitments through 2013.
This document contains forward-looking statements about Bank Zachodni WBK's future business development and economic performance that may differ materially from expectations. It cautions that various risk factors could adversely impact the business. The bank aims to strengthen its market position as a universal bank offering retail, business, and investment banking services. Its outlook forecasts low double-digit revenue growth, a cost/income ratio of 41-43%, below-market cost of risk, and around 20% annual profit growth to achieve a 2013 PAT of €480 million.
Northrop Grumman reported financial results for Q1 2008. Earnings per share were reduced by $0.61 due to a shipbuilding charge. The dividend was increased to $0.40 per share and the company repurchased $600 million in stock. Despite the charge, new business awards totaled over $12 billion and the company maintained confidence in achieving 2012 financial targets of $42 billion in sales, 10% operating margin, and $8 EPS.
Be realistic, be selective. We believe this market rally has pushed
valuations to the point where growth expectations have reached
implausible levels. In fact, profits have just begun to turn down. We are
not overly bearish – our Buy list is longer than our Sell list – but we
caution that optimism over growth can disappear as quickly as it
appeared. Domestic factors, particularly political developments, may
be a positive catalyst.
Profit recession has just begun. Industrial production peaked in
January 2008, but profits only began a broad-based decline in 1Q09.
Within our coverage, 63% of the companies that have released 1Q
earnings reported lower sequential quarterly net profits. In seven
sectors, our entire coverage list suffered profit contractions. This
suggests the recession in profits has just begun.
Market valuation implies an optimistic view of growth. The market
currently trades at 15.2x 2009 earnings, up from 12x earlier this year.
This is only 10% below the previous cycle’s mid-cycle value, but today,
we face growth of -7.7% (2009) and +9.7% (2010), taking market
earnings only 1% higher by the end of 2010 from its end-2008 level.
Market growth expectations seem to be running ahead of reality.
History tells us the bear market isn’t over. Two previous bear
markets over 1981-86 and 1993-98 lasted 57 and 58 months
respectively. It has now been 17 months from the January 2008
collapse. Those bear markets had 22-38 trend reversals of 5% or more;
we have now seen 12 since January 2008. These comparisons suggest
we are, at best, half way through this bear market.
Bet on Prime Minister Najib, but Sell hope. Our top stock picks are
in the construction sector. We expect PM Najib will deliver on the fiscal
spending promises, reinvigorating the construction and building
materials sectors. Our top Sells are stocks where high hopes and
expectations have been built in; where current prices have run well
ahead of both our and consensus target prices.
Politics a positive wildcard. Beyond rapidly executed fiscal packages,
the country’s new leadership could make further changes to longstanding
policies to attract foreign investment and win back broader
support from all Malaysians. These initiatives should be positive for
equity market at least in the short-term.
The document summarizes the performance of Global Banking and Markets in the first half of 2008. Key points include:
- Global Banking and Markets contributed 26% of the group's pre-tax profits despite challenging market conditions.
- Strength in emerging markets like Asia Pacific and Latin America helped offset losses elsewhere.
- Writedowns were taken on subprime, credit, and leveraged loan exposures totaling $3.9 billion.
- Two of the group's structured investment vehicles, Cullinan and Asscher, had their assets transferred or sold into three securities investment conduits to provide more stable funding.
The document discusses the turnaround of Sovereign Bank in two phases. Phase I from 2009-2011 focused on stabilizing the bank by improving asset quality, increasing efficiency, and strengthening the balance sheet. Key accomplishments included reducing the ratio of non-performing loans to total loans and increasing the tier 1 capital ratio. The overall goal of phase I was building a strong foundation during a challenging economic and regulatory environment.
The document summarizes key findings from the Civil Society Almanac 2010 regarding trends in UK voluntary sector funding and resources during and after the 2008 financial crisis and recession. It finds that [1] while the voluntary sector continued growing in organizations and income, the rate of expenditure growth slowed as fundraising became more difficult; [2] statutory funding remains the largest income source, particularly for large organizations, while smaller groups rely more on donations and earned income; and [3] resources remain heavily concentrated among the largest few organizations, though concentration does not appear to be worsening over time.
The document provides an overview of Macquarie Infrastructure Company's fourth quarter and full year 2011 earnings conference call. It discusses positive cash generation trends, with proportionately combined free cash flow of $145.1 million for 2011. Segment performance is reviewed for IMTT, The Gas Company, District Energy, and Atlantic Aviation. Guidance is also provided for expected 2012 performance at each business. Debt profiles and compliance with debt covenants are summarized.
Thiet ke Bao cao thuong nien -Vina 2010 (vnl)Viết Nội Dung
VNL's annual report for 2010 showed:
1) VNL achieved a 3.2% increase in NAV per share to $1.36, reversing losses from the previous year, driven by sales of residential units.
2) Vietnam's real estate market saw strong performance in low and mid-range residential sectors and improved hospitality, while office and retail remained slow.
3) The Chairman notes investors remain concerned about Vietnam's macro issues and want clarity on performance and the manager's ability to realize proceeds and return value to shareholders.
Paraná Banco reported financial results for the second quarter of 2009. Net income increased 33.3% compared to the second quarter of 2008 and 66.7% compared to the first quarter of 2009. The loan portfolio grew 4.7% over the first quarter, while deposits increased 6.5%. Insurance operations contributed 32.4% of consolidated net income for the quarter. The efficiency ratio improved to 48.8% and the net interest margin rose to 15.4%.
- Q3 2011 saw record gross billings, adjusted EBITDA, and strong free cash flow for Aimia. Gross billings increased 4.1% year-over-year to $541.8 million.
- Adjusted EBITDA grew significantly by 83.5% to $104.2 million compared to Q3 2010. Free cash flow before dividends paid was $124.8 million.
- For the first nine months of 2011, gross billings increased 1.1% to $1.6 billion. Adjusted EBITDA rose 25.8% to $252.7 million, driven by growth across the business.
HSBC France held an investor presentation on March 12, 2008 to discuss the bank's financial performance and future plans. The presentation highlighted that HSBC France achieved 10.7% growth in net operating income before loan impairment charges in 2007 compared to 2006. It also noted strong growth across various business lines including Global Banking and Markets, Personal Financial Services, and Commercial Banking. The presentation further discussed HSBC France's plans to focus on premier banking, international connectivity, and cross-selling opportunities across its business lines. Finally, it mentioned that HSBC France received a firm offer to acquire seven regional banks in France for EUR2.1 billion.
SGS Group reported financial results for the first half of 2011. Total revenue grew 12.8% at constant currency rates to CHF 2.3 billion, driven by 9.7% organic growth and acquisitions contributing 3.1%. Adjusted operating income increased 12.0% at constant currency rates to CHF 374 million, with the margin remaining stable at 16.0%. The company expects solid top line growth of over 10% for 2011 along with increased investments lowering operating margins slightly compared to 2010.
La web 2.0 permite la colaboración y compartir información entre usuarios a través de herramientas como blogs y wikis que facilitan la creación y edición de contenido en la web.
The magazine front cover targets young girls, as shown by its bright pink colors, glittery masthead, and pictures of male celebrities asking "Who's the Fittest?". It advertises the latest fashion trends and has a low price of £2.99, suggesting it aims for a young female audience. Feminine fonts and pink/purple color scheme further reflect the intended audience.
The magazine front targets men in their mid-20s and older with articles about bands like The Stone Roses and The Strokes. A red, gold, and white color scheme along with block lettering communicate a masculine style.
The magazine aims for trend-conscious youth ages 15-25, with a sophisticated red
The document discusses the need for health system transformation in Ontario. It notes that over 50% of adults and 20% of youth are overweight, contributing to increased rates of diabetes and costs. It also discusses how people are making avoidable emergency department visits and being readmitted to hospitals shortly after discharge because they are not receiving proper follow-up care. The aging population is increasing health costs substantially. The document outlines plans to shift more procedures out of hospitals and into community clinics to improve health outcomes and reduce costs. TSH will re-evaluate its programs and services as part of this transformation while continuing to engage community partners.
Graeme Mason, Planning and Corporate Affairs Director at Newcastle International Airport, gave a briefing to business leaders on April 9, 2014. He discussed how the airport is a public-private partnership and its connectivity helps drive the regional economy, supporting thousands of jobs and billions in revenue. He also covered the airport's plans to improve customer experience and facilities while supporting additional UK runway capacity and lower aviation taxes.
1) The document discusses Banco Santander's (Brasil) 1H10 results. It saw continued economic recovery in Brazil with GDP growth resuming.
2) Santander is the 3rd largest private bank in Brazil by assets and had market shares of around 10-15% in various regions of Brazil. It has over 2,000 branches and 18,000 ATMs.
3) Santander has integrated acquired banks into its operations and realized cost synergies above expectations totaling over R$1.4 billion. Its "Conta Integrada" acquiring and financial services saw better than expected results in its first few months.
Blogging - the why the how and the method for businesses and individualsPaul Boomer
The document discusses blogging and provides information on what a blog is. It notes that historically, blogs were written by individuals or small groups and covered a single topic. However, more recently "multi-author blogs" have developed with large numbers of authors and professional editing. The document outlines that blogs can provide commentary, function as personal diaries, or advertise brands. Blogs typically combine text, images, links and other media related to their topic. Readers can often leave comments. While most blogs are textual, some focus on other media like art, photos, videos or music.
Key Clinical Implications of how a Cancer EvolvesH. Jack West
Cancer adapts and evolves over time and under the selective pressure of systemic treatment, becoming increasingly resistant over time. This brief slidedoc fo summarizes key points in how cancer adaptation leads to resistance and changes our treatment recommendations.
The Scarborough Hospital in Canada hosted its first community event with a local mosque to engage the Muslim community in a discussion about health. The Scarborough Hospital serves a diverse population of almost one million people across two campuses, with over 3,700 staff including more than 700 physicians. It aims to provide outstanding and unique care for each patient as Canada's leader in healthcare for its global community, which includes Scarborough's large Muslim population.
The document summarizes the student's process in developing a media portfolio for a music magazine. It describes conducting research on existing magazines' codes and conventions, using this to inform the design of mock covers, spreads, and contents. It discusses targeting a specific audience of 16-25 year olds and addressing them through visuals, language, topics. The student learned about designing for an audience and applying researched techniques through repeated revisions to strengthen the authenticity and appeal of the final pieces.
NewcastleGateshead Initiative partner update meeting 25 Feb 2016newcastlegateshead
The document provides a summary of the agenda and presentations for a partner update meeting held by the NewcastleGateshead Initiative on 25 February 2016. The agenda included welcome remarks, presentations on leisure marketing, business tourism, devolution, inward investment, and festivals and events. Key highlights mentioned were international marketing campaigns to promote tourism in the North, major conferences and events happening in 2016-2018, and opportunities for partners to engage in areas such as marketing, business tourism, and inward investment activities.
The presentation summarizes key aspects of the female reproductive system. It discusses that gynecology is the medical specialty that focuses on the female reproductive system. It describes the three stages of labor and delivery as the dilation stage, the expulsion stage, and the placental stage. It also states that the female sex cell is an ova, also called an oocyte, which is a haploid cell containing half the genetic material needed for reproduction.
The truth about social media (Hint: it’s not media)Paul Boomer
This document discusses the differences between relational and transactional customers. It provides a case study showing that while transactional customers made up the majority (78%) of store visits, relational customers accounted for 50% of buyers and generated 59% of dollars spent and 72% of gross profit. This illustrates that focusing solely on transactional customers ignores the disproportionate value of relational customers. The document advocates understanding customer types in order to optimize marketing strategies.
ClassDojo es una aplicación que permite a los padres monitorear el comportamiento de sus hijos en la escuela. Los padres pueden crear una cuenta en ClassDojo, agregar el código de su hijo provisto por el maestro, y acceder a tres pestañas de información: la historia de la clase, el desempeño conductual del estudiante a lo largo del tiempo, y un foro de mensajes con el maestro.
The Scarborough Hospital serves Canada's most diverse population in the Scarborough area of Toronto. Two-thirds of Scarborough residents are visible minorities, with the top languages spoken being Chinese, Cantonese, and Tamil. 57% of Scarborough residents are immigrants, with 12% arriving between 2001-2006. The hospital aims to be recognized as Canada's leader in providing healthcare for a global community through its Institute for Diversity and Health Equity Research, which conducts applied research to promote culturally sensitive healthcare practices.
The document provides the 1Q11 results for Banco Santander (Brasil) S.A. Some key points:
- Net profit before tax increased 25.4% year-over-year to R$2,724 million in 1Q11. Net profit rose 17.5% year-over-year to R$2,071 million.
- Total revenues grew 6.6% year-over-year to R$8,690 million in 1Q11, with net interest income increasing 3.9% quarter-over-quarter.
- The bank saw double-digit growth in its loan portfolio and funding from clients, with the expanded credit portfolio rising 21.9% year-
- First Bank Group reported a 28.8% increase in gross earnings for the 9 months ended December 2009 compared to the same period in 2008. However, gross earnings declined 10.65% for the quarter ended March 2010 compared to the prior year quarter.
- Profit before tax declined sharply for the 9 months ended December 2009 at -72.6% but increased for the quarter ended March 2010 compared to the previous quarter.
- Capital adequacy and liquidity ratios remained strong but the loan to deposit ratio increased from 81.3% to 89.7%, indicating higher lending activity.
First Bank Group reported results for the 9 months ended December 31, 2009 and quarter ended March 31, 2010. For the 9 months ended December 31, 2009, gross earnings increased 28.8% to N196.4 billion compared to the same period in 2008. However, profit before tax declined 72.6% to N11.6 billion. In the quarter ended March 31, 2010, gross earnings declined 10.65% to N62.4 billion compared to the same quarter in 2009, while profit before tax increased significantly to N15.4 billion. First Bank remains well capitalized with a capital adequacy ratio of 17.67% as of March 31, 2010 and continues its strategy of growing earnings while improving asset
Ri Cs Global Media Comunications Cof Jun09 Ripperguest5db5323
This document provides an overview of Oi, a Brazilian telecommunications company. It discusses Oi's profile and results, as well as its future strategy. Specifically, it summarizes that:
- Oi has businesses in fixed telephony, mobile, broadband, and pay-TV, with over 58 million subscribers across Brazil.
- For its future strategy, Oi plans to focus on strengthening its convergent offer and presence in the low income segment. It will also look to expand nationally by leveraging its successful model from Region I.
- Within three years, Oi aims to consolidate its national leadership in broadband coverage by expanding to cover 87% of cities and 77% of the population in Brazil.
São Paulo, November 11, 2010 – Banco Indusval S.A., financial institution with activities primarily focused on middle market lending, operating in the Brazilian market for over 40 years, listed at the Stock, Commodities and Futures Exchange - BM&FBOVESPA under tickers IDVL3 and IDVL4, announces its financial results for the third quarter 2010 (3Q10).
This document provides an investor presentation for Banco ABC Brasil covering their strategy, business segments, funding and capital base, financial highlights, and ownership structure. It summarizes that Banco ABC Brasil provides commercial banking services in Brazil focused on corporate and middle market clients, with an emphasis on growing profitably in these segments through increased cross-selling. It also reviews the bank's diversified funding sources, strong capital and asset-liability management, improving credit quality, and majority ownership by Arab Banking Corporation.
First Bank Group reported its financial results for the first half of 2010. [1] Net earnings declined by 6.37% compared to the same period in 2009, driven by a 7.1% fall in net interest income. [2] However, credit losses saw a net recovery of $0.95 billion compared to a $39.8 billion provision in the first half of 2009. [3] Total assets grew by 4.1% while deposits increased by 6.5% over the same period.
This document summarizes the Q1 2010 results conference call of a company that produces motors, automation systems, energy transmission and distribution equipment, and paints. The call notes that the economic recovery is gradual, with growth coming first from consumers and shorter cycle industrial products. The company's revenues decreased year-over-year due to FX impacts. Profitability improved through cost controls despite lower revenues. Contact information is provided for investors.
Santander Brazil has experienced growth in income and net profit in recent years through expanding its customer base and credit portfolio. However, its strategic plan for 2011-2013 aims to maximize operating leverage and improve efficiency by focusing on sustainable credit growth, customer satisfaction, and becoming customers' bank of choice. The presentation outlines Santander Brazil's business model, performance, and strategic targets to enhance its position as Brazil's banking sector grows.
WEG reported its Q2 2010 results with the following highlights:
- Gross operating revenue increased 8.5% year-over-year to R$1.227 billion. Domestic revenue grew 3.7% while external markets grew 20%.
- Net income decreased 2.5% to R$116.1 million and EBITDA declined 4.3% to R$174 million.
- The company expanded internationally through additional investments in Mexico and South Africa and acquiring a company in Brazil.
- Management believes growth opportunities remain in energy efficiency and renewable energy areas.
Future Capital Holdings (FCH) is a financial services provider in India with over Rs. 7.57 billion in net worth that aims to leverage its parent company Pantaloon Retail's large retail presence. FCH has brought on V. Vaidyanathan, a highly experienced banking executive, as its new Vice Chairman and Managing Director to lead its expansion into consumer and wholesale financing businesses. The company intends to significantly grow its balance sheet and deliver returns to shareholders by capitalizing on the large untapped market opportunities in India's growing financial sector.
Banco Indusval reported financial results for 2Q10 and 1H10. Credit portfolio growth was moderate at 2.5% in the quarter, and default rates fell due to economic recovery. Net profit was R$8.3 million in 2Q10, up 13.7% from last quarter. Management comments indicated initiatives to improve products and services should have medium-term benefits, while credit to mid-sized companies grew and default rates declined.
Dena Bank reported net profit growth of 23.3% for the fourth quarter of 2010, ahead of estimates, driven by higher-than-expected net interest margins and higher non-interest income from recoveries. The bank's asset quality remained stable in the quarter and it expects capital infusion of Rs600 crore in the first quarter of 2011. The analyst maintains a buy rating on the stock with a target price of Rs98, citing expected advances growth of 17% and earnings growth of 16% over the next few years.
This document summarizes WEG's 2Q09 conference call results. It includes disclaimers about forward-looking statements involving risks and uncertainties. The presentation reviews difficult market conditions, revenue declines, lower margins due to reduced capacity and raw material costs. Positive aspects included expense control and cash management. Quarterly highlights showed revenue and profitability declines. Segment results varied with industrial equipment impacted most by the crisis. The global presence and business areas slides showed market diversification. Profitability, financing, capacity expansion investments and contacts were also summarized.
The document is a summary of WEG's Q3 2009 conference call discussing financial results. It notes that while the downturn was swift, recovery is gradual. Gross revenues were down 14% year-over-year due to impacts across markets, though margins are recovering faster through improved efficiency. Quarterly highlights show decreases in gross operating revenue but increases in gross margin and net income. Cost reductions and mix improvements helped profitability. Cash generation was strong and debt levels decreased. Capacity expansion investments continued with strict controls to maximize returns. Contact information is provided for further questions.
The document is a quarterly report from a Brazilian bank providing key financial highlights and performance metrics for 2Q13. Some key points:
- Net income for 2Q13 totaled BRL 64.7 million with a 14.6% return on average equity.
- The expanded credit portfolio reached BRL 16.879 billion, with BRL 14.608 billion in the Corporate segment and BRL 2.271 billion in the Middle Market segment.
- Income from banking service fees such as guarantees issued, capital markets/M&A fees, and banking tariffs totaled BRL 44.5 million in 2Q13, a 35% increase over the previous quarter.
1) Banco ABC Brasil reported first quarter 2013 net income of BRL 60.1 million, with an expanded credit portfolio reaching BRL 15.82 billion.
2) The bank achieved a return on average equity of 14.1% and is now rated investment grade by the three major global rating agencies.
3) The corporate credit portfolio grew 4.6% over the previous year to BRL 13.79 billion, while the middle market portfolio increased 7.1% to BRL 2.03 billion.
This document provides an investor presentation for ABC Brasil for the fourth quarter of 2011. It summarizes the company's business segments, financial highlights, and competitive environment. ABC Brasil focuses on providing loans and structured products to mid-sized and large companies in Brazil. Over the periods reported, the company grew its credit portfolio, maintained strong credit quality, and increased revenues from services like guarantees issued.
Tempo announced a 28% year-over-year growth in net revenues and 20% year-over-year growth in EBITDA. The company also saw a new CEO and initiated a second stock buyback program. Tempo will implement SAP software to consolidate acquired companies onto one platform. Overall, Tempo continued acquisitions and organic growth in 2008 but faced challenges from the global economic crisis, leading to a focus on efficiencies over market consolidation.
The document summarizes the key financial highlights of a company's 2nd quarter 2011 conference call. It notes that net income totaled BRL 60.2 million in 2Q11, with an annualized return on equity of 17.2%. The credit portfolio reached BRL 12,234.8 million by the end of June 2011 and remained of high quality. The quality and performance of the corporate and middle market business segments are also discussed.
4. 4
Table of Contents
Macroeconomic Scenario
Strategy
Business
Results
Loan Portfolio Quality
Final Remarks
5. 5
Franchise
Santander is the 3rd largest Brazilian private bank in total assets, with
a market share¹ in loans of 11% in the Brazilian banking system
Market share
9M10 R$ million Number of branches
September/2010
Total Country
Loans 153,998 Market Share: 12%
North: 5% of GDP
Funding from Clients² 145,797 Market Share: 5%
Funding from Clients² + AUM 253,102
Northeast: 13% of GDP
Net Profit 5,464 Market Share: 7%
Strong distribution platform… Middle-west: 9% of GDP
Market Share: 6%
Bank with one of the highest numbers of point of
sales in South/Southeast (73% of GDP)
Southeast: 57% of GDP
Market Share: 16%
2,127 1,496 18,124
Branches Mini
ATM’s
branches
South: 16% of GDP
+10.6 million current accounts³, an increment Market Share: 9%
of 331 thousand current accounts in 9M10
Opening of 30 branches in the quarter
Source: The Brazilian Central Bank and IBGE. GDP date: 2007
1. Santander’s market share in total loans of private sector: 17% (sep/10)
2. Demand Deposits + Time Deposits + Savings + Debentures + Real Estate Credit Notes (LCI) and Agribusiness Credit Notes (LCA)
3. Current accounts within 30 days, according to Central Bank as of sep/2010
6. 6
Customer base
Customers (thousand) Current accounts¹ (thousand)
9.9% 5.1%
2.5% 0.6%
23,514 24,092 10,503 10,571
21,926 10,054
Sep.09 Jun.10 Sep.10 Sep.09 Jun.10 Sep.10
1. Current accounts within 30 days, according to Central Bank.
7. 7
Santander Acquiring / “Conta Integrada”
Better than expected results in the first 6 months of operation
Results Target
(%)
Sep/10 2012
FINANCIAL ACQUIRING
SERVICES SERVICES Affiliated Merchants
75 300 25.0%
(thousand)
New Accounts
15 150 10.0%
(thousand)
Santander Acquiring
Revenues: R$ 400 Million
Credit Package with high fidelity driver;
Number of transactions: 4.3 Million
6 months of operation with the Mastercard brand and
Revenues: R$ 200 Million
Debit 2 months of operation with the Visa brand;
Number of transactions: 4.7 Million
Most of the Loans were made with Small and
Revenues: R$ 600 Million Medium Companies;
TOTAL
Number of transactions: 9 Million
8. 8
Integration Process - Status
1st and 2nd Stages concluded 3rd Stage
Aug/08 Jun/10 Dec/10 1H11
1 Senior Management Integrated
2 Centralized areas integrated
Risk Management, Human Resources, Marketing
Auditing financial Control, Compliance, etc.
3 Wholesale, Private & Asset integrated Re-branding
GB&M, Corporate and Middle
4 Credit card system
5 ATMs integrated
VI
8 Re-branding November
ATMs platform
Upgrade on branches infrastructure 9 Unified Customer Services
6 Insurance System 95% of volume
7 New commercial model Technology migration
10 Tests and Simulations
9. 9
Integration Process - Synergies
Synergies
R$ million
+145
We obtained cost
1,545
1,400 synergies of
1,200
1,000
R$ 1,545 million
800
R$ 145 million above
expectations
2009 1Q10 2Q10 3Q10 3Q10
Estimates Obtained
10. 10
Table of Contents
Macroeconomic Scenario
Strategy
Business
Results
Loan Portfolio Quality
Final Remarks
11. 11
Managerial Loan Portfolio¹ - IFRS
R$ billion
15.8%
5.1%
Y-o-Y Q-o-Q
R$ million Sep.10 Sep.09 Variation Variation
146.5 154.0
132.9 138.4 139.9 8.5%
Individuals 48,299 42,306 14.2% 5.2%
4.7% 5.1% 6.5%
4.1% Consumer
4.5% 26,455 24,457 8.2% 1.3%
Finance
1.1% 2.5%
SMEs 35,778 31,188 14.7% 10.9%
-0.9% 0.5%
-1.5% Corporate 43,466 34,998 24.2% 2.9%
sep.09 dec.09 mar.10 jun.10 sep.10
Q-o-Q Var.
Total IFRS 153,998 132,949 15.8% 5.1%
Individuals
Corporate Total IFRS including
31% 158,383 134,901 17.4% 5.6%
28% acquired portfolio²
SMEs Consumer
23% Finance
17%
1. Loans for the year 2009 have been reclassified for comparison purposes with the current period, due to re-segmentation of clients occurred in 2010
2. Considers Portfolios acquired from other banks: R$ 4,385 million in Sep/10 (R$ 941 million in 3Q10) and R$ 1,952 million in Sep/09
(R$ 139 million in 3Q09)
12. 12
Managerial Loan Portfolio - BR GAAP¹
R$ billion
16.8%
5.5%
Y-o-Y Q-o-Q
159.1 R$ million Sep.10 Sep.09 Variation Variation
144.1 150.8
136.2 142.0 8.4%
Individuals 52,606 44,171 19.1% 6.8%
5.5% 6.4%
4.2% 4.7%
Consumer
4.4% 29,059 26,455 9.8% 1.8%
Finance
1.5% 2.4%
SMEs 35,778 31,188 14.7% 10.9%
-0.7% 0.4%
-1.6%
Corporate 41,642 34,430 20.9% 2.2%
sep.09 dec.09 mar.10 jun.10 sep.10
Q-o-Q Var. Total BR GAAP 159,085 136,244 16.8% 5.5%
Corporate Individuals
26% 33%
SMEs Consumer
23% Finance
18%
1. The credit portfolio in BR GAAP is higher than in IFRS because it includes loan portfolio acquired from other banks and consolidates the credit
portfolio of our consumer finance joint ventures
13. 13
Loan by Products - IFRS
Payroll, Mortgage and Credit Cards Loans are the main highlights
Payroll Loans¹ Auto Loans to Individuals
R$ million R$ million
40.8% 7.2%
13,517 23,691
9,600 22,095
Sep.09 Sep.10 Sep.09 Sep.10
Credit Cards to Individuals Mortgage²
R$ million R$ million
26.0% 30.7%
11,233
9,383 8,593
7,447 42.0%
5,119
3,606
6,114 22.6%
4,987
Sep.09 Sep.10
Sep.09 Sep.10
Individuals Corporate
1. Considers Portfolios acquired from other banks: R$ 4,385 million in Sep/10 (R$ 941 million in 3Q10) and R$ 1,952 million in Sep/09
(R$ 139 million in 3Q09)
2. Includes loans to Individuals and Corporate
15. 15
Table of Contents
Macroeconomic Scenario
Strategy
Business
Results
Loan Portfolio Quality
Final Remarks
16. 16
Highlights
Commercial activities accelerate in the quarter, driven by focused
segments
Sound results:
Net profit of R$ R$ 5.5 billion in 9M10 (+39% versus 9M09)
Net profit of R$ R$ 1.9 billion in 3Q10 (+10% versus 2Q09)
Net profit increase driven by better quality:
Increase in Net Interest Income and Net Fees
General expenses below inflation
Improvement of asset quality with comfortable coverage ratio
Performance Ratios improved in 12 months
17. 17
Results IFRS: Net profit evolution
R$ million
9M10 net profit rose 39% in 12 months
39.5%
31.5%
5,464
9.6%
3,917
1,935
1,766
1,472
9M09 9M10 3Q09 2Q10 3Q10
18. 18
Total Revenues
R$ Million
7.8%
4.6%
8,032 7,832 8,193 Y-o-Y Q-o-Q
7,776
7,598 380 9M10 9M09 Variation Variation
386 260 577 257
1,556 1,666 1,622 1,710 1,776
Net Interest Income 17,735 16,317 8.7% 2.9%
Net Fees 5,108 4,572 11.7% 3.9%
5,656 5,850 5,833 5,865 6,037
Subtotal 22,843 20,889 9.4% 3.1%
Others¹ 1,214 1,468 -17.3% 47.9%
3Q09 4Q09 1Q10 2Q10 3Q10 Total Revenues 24,057 22,357 7.6% 4.6%
Net Interest Income Net Fees Others¹
1. Results from Financial Operations excluding the fiscal effect of Cayman hedge + Others
20. 20
Total Revenues Net of Allowance for Loan Losses
R$ Million
25.4%*
14.4%
5,090 5,628 5,629 5,581 6,382
Y-o-Y Q-o-Q
9M10 9M09 Variation Variation
Total Revenues 24,057 22,357 7.6% 4.6%
7,598 7,776 8,032 7,832 8,193
Allowance for
(6,465) (7,834) -17.5% -19.5%
loan losses¹
(2,508) (2,148) (2,403) (2,251) (1,811) Total Revenues
(500) Net of Allowance 17,592 14,523 21.1% 14.4%
3,008 for loan losses
3Q09 4Q09 1Q10 2Q10 3Q10
Total Revenues¹
Allowance for loan losses²
Additional Provision
1. Net Interest Income + Net Fees + Results from Financial Operations excluding the fiscal effect of Cayman hedge + Others
2. Includes recoveries of written-off credits
(*) Adjusted disregarding the Additional Provision
21. 21
General Expenses and Amortization
R$ Million
4.8%
3.0%
3,158 3,158 Y-o-Y Q-o-Q
3,013 2,941 3,067
9M10 9M09 Variation Variation
265 293 309
339 286
Other General
4,030 4,013 0.4% 1.2%
Expenses
2,893 2,774 2,849 Personnel
2,674 2,655 4,248 4,041 5.1% 4.2%
Expenses
Depreciation and
888 984 -9.8% 5.5%
Amortization
3Q09 4Q09 1Q10 2Q10 3Q10
Total 9,166 9,038 1.4% 3.0%
Depreciation and Amortization General Expenses
22. 22
Performance Ratios -IFRS
Efficiency Ratio¹ (%) Recurrence² (%) ROAE (adjusted)³ (%)
4.9 p.p.
-1.6 p.p. -4.8 p.p.
61.7
56.8
36.0
34.4 22.1
17.3
9M09 9M10 9M09 9M10 9M09 9M10
1. General Expenses excluding amortization / Total Revenue excluding Cayman hedge
2. Net Fee/General Expenses excluding amortization
3. Excludes goodwill on acquired companies (Banco Real and Real Seguros Vida e Previdência)
23. 23
Table of Contents
Macroeconomic Scenario
Strategy
Business
Results
Loan Portfolio Quality
Final Remarks
24. 24
Allowance for Loan Losses¹ - IFRS
R$ Million
-27.8%*
-19.5%
3.008
500
500
2,403
2,148 2,251
1,811
Y-o-Y Q-o-Q
9M10 9M09 Variation Variation
2,508
Allowance for
6,465 7,834 -17.5% -19.5%
loan losses
3Q09 4Q09 1Q10 2Q10 3Q10
Additional Provision
1. Includes recoveries of written-off credits
(*) Adjusted disregarding the Additional Provision
25. 25
Quality of Loan Portfolio - IFRS
Delinquency ratio¹ (%) Coverage ratio² (%)
9.7
9.3
8.8
8.2 7.9
7.7
7.2 7.0 101% 102% 103% 102% 101%
6.6
6.1
6.1
5.3 5.3 5.1
4.5
3Q09 4Q09 1Q10 2Q10 3Q10
Individuals Corporate Total
1. (Nonperforming loans over 90 days + performing loans with high delinquency risk) / managerial loan portfolio
2. Allowance for Loan Losses / nonperforming loans over 90 days + performing loans with high delinquency risk
26. 26
Quality of Loan Portfolio - BR GAAP
Delinquency Over 90¹ (%) NPL Over 60² (%) Coverage Ratio Over 90³
9.4 9.2
7.9 7.8 8.7
7.2 8.0
6.7 7.7 7.4 133%
6.5 128%
5.9 6.2 6.8 113% 120%
6.4 108%
5.4
4.7 5.6
4,2 5.0
5.3 6.1
4.2 4.7
3.7 4.4
3.0 3.6
2.5 2.9
3Q09 4Q09 1Q10 2Q10 3Q10 3Q09 4Q09 1Q10 2Q10 3Q10
3Q09 4Q09 1Q10 2Q10 3Q10
Individuals Corporate Total Individuals Corporate Total
1. Nonperforming loans over 90 days / total loans BR GAAP
2. Nonperforming loans over 60 days / total loans BR GAAP
3. Allowance for Loan Losses / (nonperforming loans for over 90 days + performing loans with high delinquency risk)
27. 27
Table of Contents
Macroeconomic Scenario
Strategy
Business
Results
Loan Portfolio Quality
Final Remarks
28. 28
Conclusion
Commercial activity accelerates
• Loan portfolio expansion in 3Q10, focused on segments:
SMEs: -2% 1Q10; 4.7% 2Q10 and 10.9% 3Q10 (Q-o-Q Variation)
Individuals: 1.8% 1Q10; 4.4% 2Q10 and 5.2% 3Q10 (Q-o-Q Variation)
• Deposits upturn in 3Q10
Total Revenues Net of Allowance for Loan Losses increases 17% in 9M10
• Fourth consecutive quarterly decline in delinquency rates
• Credit costs declines with comfortable coverage ratios
9M10 Net Profit of R$ 5.5 billion, up 39% in 12 months
• Sound Increase in Net Fees and upturn in Net Interest Income growth
• Costs under control with synergies
Infrastructure Expansion
• Opening of 30 branches in the quarter
29. 29
ANNEXES
Income Statement and Balance Sheet – IFRS
Income Statement – BR GAAP
30. 30
Quarterly Managerial¹ Income Statement – IFRS
R$ million
Income Statements 3Q09 4Q09 1Q10 2Q10 3Q10
- Interest and Similar Income 9,731 9,841 9,278 9,839 10,603
- Interest Expense and Similar (4,075) (3,991) (3,445) (3,974) (4,566)
Interest Income 5,656 5,850 5,833 5,865 6,037
Income from Equity Instruments 7 8 4 14 2
Income from Companies Accounted for by the Equity Method 33 5 10 13 11
Net Fee 1,556 1,666 1,622 1,710 1,776
- Fee and Commission Income 1,797 1,888 1,841 1,929 2,029
- Fee and Commission Expense (241) (222) (219) (219) (253)
Gains/Losses on Financial Assets and Liabilities and Exchange Rate Diferences 240 306 608 290 472
Other Operating Income (Expenses) 106 (59) (45) (60) (105)
Total Income 7,598 7,776 8,032 7,832 8,193
General Expenses (2,674) (2,893) (2,655) (2,774) (2,849)
- Administrative Expenses (1,345) (1,423) (1,300) (1,357) (1,373)
- Personnel espenses (1,329) (1,470) (1,355) (1,417) (1,476)
Depreciation and Amortization (339) (265) (286) (293) (309)
Provisions (net)² (1,190) (482) (629) (290) (674)
Impairment Losses on Financial Assets (net) (3,844) (2,125) (2,407) (2,214) (1,818)
- Allowance for Loan Losses³ (3,008) (2,148) (2,403) (2,251) (1,811)
- Impairment Losses on Other Assets (net) (836) 23 (4) 37 (7)
Net Gains on Disposal of Assets 2,280 34 117 48 35
Net Profit before taxes 1,831 2,045 2,172 2,309 2,578
Income Taxes (359) (454) (409) (543) (643)
Net Profit 1,472 1,591 1,763 1,766 1,935
1. Does not consider the fiscal effect of Cayman hedge
2. Includes provision for tax contingencies and legal obligations
3. Includes recovery of credits written off as losses
31. 31
Managerial¹ Income Statement – IFRS
R$ million
Var Y-o-Y
Income Statements
9M10 9M09 ABS %
- Interest and Similar Income 29,720 29,502 218 0.7%
- Interest Expense and Similar (11,985) (13,185) 1,200 -9.1%
Interest Income 17,735 16,317 1,418 8.7%
Income from Equity Instruments 20 22 (2) -9.1%
Income from Companies Accounted for by the Equity Method 34 290 (256) -88.3%
Net Fee 5,108 4,572 536 11.7%
- Fee and Commission Income 5,799 5,260 539 10.2%
- Fee and Commission Expense (691) (688) (3) 0.4%
Gains/Losses on Financial Assets and Liabilities and Exchange Rate Diferences 1,370 1,213 157 12.9%
Other Operating Income (Expenses) (210) (57) (153) 268.4%
Total Income 24,057 22,357 1,700 7.6%
General Expenses (8,278) (8,054) (224) 2.8%
- Administrative Expenses (4,030) (4,013) (17) 0.4%
- Personnel espenses (4,248) (4,041) (207) 5.1%
Depreciation and Amortization (888) (984) 96 -9.8%
Provisions (net)² (1,593) (2,999) 1,406 -46.9%
Impairment Losses on Financial Assets (net) (6,439) (8,743) 2,304 -26.4%
- Allowance for Loan Losses³ (6,465) (7,835) 1,370 -17.5%
- Impairment Losses on Other Assets (net) 26 (908) 934 n.a
Net Gains on Disposal of Assets 200 3,369 (3,169) n.a
Net Profit before taxes 7,059 4,946 2,113 42.7%
Income Taxes (1,595) (1,029) (566) 55.0%
Net Profit 5,464 3,917 1,547 39.5%
1. Does not consider the fiscal effect of Cayman hedge
2. Includes provision for tax contingencies and legal obligations
3. Includes recovery of credits written off as losses
32. 32
Balance Sheet - Total Assets – IFRS
R$ million
Assets Sep-09 Dec-09 Mar-10 Jun-10 Sep-10
Cash and Balances with the Brazilian Central Bank 21,261 27,269 36,835 42,344 53,361
Financial Assets Held for Trading 19,261 20,116 23,133 35,902 23,738
Other Financial Assets at Fair Value Through Profit or Loss 16,986 16,294 15,873 16,213 16,665
Available - for- Sale Financial Assets 44,763 46,406 37,183 42,579 40,627
Loans and Receivables 149,973 152,163 150,003 156,804 169,250
- Loans and advances to credit institutions 27,932 24,228 20,330 20,282 24,771
- Loans and advances to customers 132,343 138,005 139,678 146,308 153,995
- Impairment losses (10,302) (10,070) (10,005) (9,786) (9,516)
Hedging derivatives 157 163 133 107 104
Non-current assets held for sale 53 171 41 93 86
Investments in associates 417 419 423 429 440
Tangible Assets 3,682 3,702 3,835 3,977 4,212
Intangible Assets: 30,982 31,618 31,587 31,630 31,667
- Goodwill 28,312 28,312 28,312 28,312 28,312
- Others 2,670 3,306 3,275 3,318 3,355
Tax Assets 15,058 15,779 14,834 15,250 15,258
Other Assets 3,642 1,872 2,169 1,918 2,223
Total Assets 306,235 315,972 316,049 347,246 357,631
33. 33
Balance Sheet – Total Liabilities and Equity – IFRS
R$ million
Liabilities Sep-09 Dec-09 Mar-10 Jun-10 Sep-10
Financial Liabilities Held for Trading 5,316 4,435 4,505 4,668 5,014
Other Financial Liabilities at Fair Value Through Profit or Loss 2 2 2 2 -
Financial liabilities at amortized cost 205,801 203,567 203,499 232,373 237,859
- Deposits from the Brazilian Central Bank 562 240 117 - -
- Deposits from credit institutions 18,754 20,956 24,092 47,784 41,361
- Customer deposits 154,548 149,440 147,287 150,378 159,426
- Marketable debt securities 10,945 11,439 11,271 12,168 14,944
- Subordinated liabilities 11,149 11,304 9,855 10,082 9,432
- Other financial liabilities 9,843 10,188 10,877 11,961 12,696
Hedging derivatives 21 10 37 42 17
Liabilities for Insurance Contracts 13,812 15,527 16,102 16,693 17,893
Provisions1 11,555 9,480 9,881 9,662 9,910
Tax Liabilities 9,287 9,457 8,516 9,199 10,047
Other Liabilities 4,775 4,228 2,778 2,988 3,812
Total Liabilities 250,569 246,706 245,320 275,627 284,552
Shareholders' Equity 55,079 68,706 70,069 70,942 72,358
Minority Interests 5 1 1 3 7
Valuation Adjustments 582 559 659 674 714
Total Equity 55,666 69,266 70,729 71,619 73,079
Total Liabilities and Equity 306,235 315,972 316,049 347,246 357,631
1. Includes provision for pension and contingencies
34. 34
Reconciliation IFRS x BRGAAP
3Q10 9M10
R$ Million
BR GAAP Net Profit 1,016 3,032
- Reversal of Goodwill amortization / Others 825 2,483
- PPA amortization (10) (77)
- Others 104 26
IFRS Net profit 1,935 5,464
35. 35
Managerial¹ Income Statement – BR GAAP
R$ Million
9M10 9M09 Y-o-Y Var. 3Q10 2Q10 Q-o-Q Var.
Net Interest Income 17,918 16,368 9.5% 6,016 5,901 1.9%
Allowance for Loan Losses (5,508) (7,412) -25.7% (1,549) (1,841) -15.9%
Net Fees² 5,757 5,534 4.0% 2,031 1,905 6.6%
General Expenses³ (9,624) (9,577) 0.5% (3,318) (3,195) 3.8%
Tax Expenses (1,704) (1,711) -0.4% (592) (595) -0.5%
Other Income (Expenses)4 (927) (209) 343.5% (591) (241) 145.2%
Managerial Net Profit 5,463 3,430 59.3% 1,826 1,812 0.8%
Net Profit 3,032 1,420 113.5% 1,016 1,002 1.4%
1. Excludes amortization of goodwill. Includes the Cayman tax reclassification, interest on emissions and recoveries of written-off credits
2. Considers Income from Services Rendered and Income from Banking Fees
3. Considers Personnel Expenses, Other Administrative Expenses, and Profit Sharing
4. Considers Other Operating Income (expenses) and Nonoperating (expenses) income
36. Investor Relations (Brazil)
2,235 Juscelino Kubitschek Avenue - 10º floor
São Paulo | SP | Brazil | 04543-011
Phone. 55 11 3553-3300
Fax. 55 11 3553-7797
e-mail: ri@santander.com.br