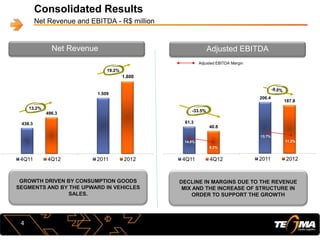
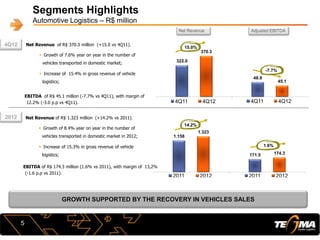
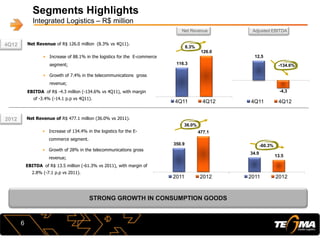
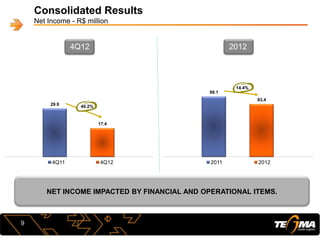
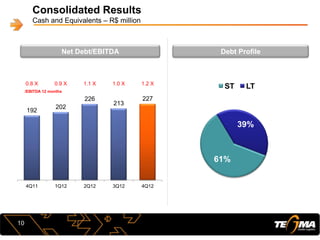
April 2nd, 2013
Presentation of Results
4th Quarter 2012
Agenda
• Recent Events
• Financial Results
• Q&A
2
Recent Events
Tegma makes its first debenture issue
3
• On February 22, 2013 Tegma debuted in the fixed income market with its first
debenture issue;
• The operation raised an amount of $ 200 million, at an average cost of CDI +
0.93%;
61.3
40.8
4Q11 4Q12
206.4
187.8
2011 2012
Consolidated Results
Net Revenue and EBITDA - R$ million
438.3
496.3
4Q11 4Q12
13.2%
4
GROWTH DRIVEN BY CONSUMPTION GOODS
SEGMENTS AND BY THE UPWARD IN VEHICLES
SALES.
Adjusted EBITDA Margin
Net Revenue
EBITDA-A
Adjusted EBITDA
DECLINE IN MARGINS DUE TO THE REVENUE
MIX AND THE INCREASE OF STRUCTURE IN
ORDER TO SUPPORT THE GROWTH
1.509
1.800
2011 2012
19.2%
14.0%
8.2%
13.7%
11.2%
-33.5%
48.9
45.1
4Q11 4Q12
171.5 174.3
2011 2012
1.158
1.323
2011 2012
322.0
370.3
4Q11 4Q12
Segments Highlights
Automotive Logistics – R$ million
Net Revenue of R$ 370.3 million (+15.0 vs 4Q11).
 Growth of 7.6% year on year in the number of
vehicles transported in domestic market;
 Increase of 15.4% in gross revenue of vehicle
logistics;
15.0%
-7.7%
5
EBITDA of R$ 45.1 million (-7.7% vs 4Q11), with margin of
12.2% (-3.0 p.p vs 4Q11).
GROWTH SUPPORTED BY THE RECOVERY IN VEHICLES SALES
14.2%
1.6%
Net Revenue of R$ 1.323 million (+14.2% vs 2011).
 Growth of 8.4% year on year in the number of
vehicles transported in domestic market in 2012;
 Increase of 15.3% in gross revenue of vehicle
logistics;
EBITDA of R$ 174.3 million (1.6% vs 2011), with margin of 13,2%
(-1.6 p.p vs 2011).
4Q12
2012
Net Revenue Adjusted EBITDA
34.9
13.5
2011 2012
350.9
477.1
2011 2012
116.3
126.0
4Q11 4Q12
Segments Highlights
Integrated Logistics – R$ million
8.3%
6
STRONG GROWTH IN CONSUMPTION GOODS
36.0%
-60.3%
4Q12
2012
Net Revenue of R$ 126.0 million (8.3% vs 4Q11).
• Increase of 88.1% in the logistics for the E-commerce
segment;
• Growth of 7.4% in the telecommunications gross
revenue;
EBITDA of R$ -4.3 million (-134.6% vs 4Q11), with margin
of -3.4% (-14.1 p.p vs 4Q11).
Net Revenue of R$ 477.1 million (36.0% vs 2011).
• Increase of 134.4% in the logistics for the E-
commerce segment.
• Growth of 28% in the telecommunications gross
revenue;
EBITDA of R$ 13.5 million (-61.3% vs 2011), with margin of
2.8% (-7.1 p.p vs 2011).
Net Revenue Adjusted EBITDA
12,5
-4,3
4Q11 4Q12
-134.6%
Scenario 2012 | Outlook 2013
Integrated Logistics
7
SCENARIO 2012
→ Growth of e-commerce:
– Increased customer base;
– Increased capillarity;
– Acquisition of LTD Businesses;
→ Profile change in storage clients;
→ Increased administrative structure, commercial
and support team;
→ Increased occurrences of theft and misplacement;
Scenario 2012 | Outlook 2013
Integrated Logistics
8
SCENARIO 2012
→ Growth of e-commerce:
– Increased customer base;
– Increased capillarity;
– Acquisition of LTD Businesses;
→ Profile change in storage clients;
→ Increased administrative structure, commercial
and support team;
→ Increased occurrences of theft and misplacement;
OUTLOOK 2013
→ Growth of e-commerce:
– Consolidation of existing customer base;
– Maturation of operational centers;
– Integration of Direct and LTD structures;
→ Implementation of storage operations for the
segment of e-commerce;
→ Improvement on management processes;
→ Restructuring the area of ​​Risk Management;
Consolidated Results
Net Income - R$ million
NET INCOME IMPACTED BY FINANCIAL AND OPERATIONAL ITEMS.
9
29.9
17.4
4Q11 4Q12
40.2%
4Q12
99.1
83,4
2011 2012
14.4%
2012
192
202
226
213
227
0.8 X 0.9 X 1.1 X 1.0 X 1.2 X
-10,000.0
-8,000.0
-6,000.0
-4,000.0
-2,000.0
0.0
0
50
100
150
200
250
4Q11 1Q12 2Q12 3Q12 4Q12
Consolidated Results
Cash and Equivalents – R$ million
Net Debt/EBITDA
/EBITDA 12 months
Debt Profile
61%
39%
ST LT
10
IR Contacts
Alexandre Brandão
+55 (11) 4346-2532
alexandre.brandao@tegma.com.br
Ian Nunes
+55 (11) 4397-9423
ian.nunes@tegma.com.br
The forward-looking statements contained in this report are subject to risks and uncertainties.
Such forward-looking statements are based on the management’s beliefs and assumptions and
information currently available to the Company. Such statements include information about our
current plans, beliefs or expectations, as well as those of the Board of Directors and Board of
Executive Officers.
These reservations concerning forward-looking statements also apply to information on our
possible or presumed operating results, as well as declarations preceded by, including or
followed by such words as "believe," "may," "will," "continue," "expect," "foresee," "intend,"
"plan," "estimate" and other similar expressions.
Forward-looking statements are not guarantees of performance; Since they refer to the future,
they depend on circumstances that may or may not occur and are therefore subject to risks,
uncertainties and assumptions. Future results may differ materially from those expressed or
suggested by said forward-looking statements. These results and amounts depend on many
factors beyond TEGMA’s control or expectations.
12
Disclaimer

4Q12 Results Presentation

  • 1.
    April 2nd, 2013 Presentationof Results 4th Quarter 2012
  • 2.
    Agenda • Recent Events •Financial Results • Q&A 2
  • 3.
    Recent Events Tegma makesits first debenture issue 3 • On February 22, 2013 Tegma debuted in the fixed income market with its first debenture issue; • The operation raised an amount of $ 200 million, at an average cost of CDI + 0.93%;
  • 4.
    61.3 40.8 4Q11 4Q12 206.4 187.8 2011 2012 ConsolidatedResults Net Revenue and EBITDA - R$ million 438.3 496.3 4Q11 4Q12 13.2% 4 GROWTH DRIVEN BY CONSUMPTION GOODS SEGMENTS AND BY THE UPWARD IN VEHICLES SALES. Adjusted EBITDA Margin Net Revenue EBITDA-A Adjusted EBITDA DECLINE IN MARGINS DUE TO THE REVENUE MIX AND THE INCREASE OF STRUCTURE IN ORDER TO SUPPORT THE GROWTH 1.509 1.800 2011 2012 19.2% 14.0% 8.2% 13.7% 11.2% -33.5%
  • 5.
    48.9 45.1 4Q11 4Q12 171.5 174.3 20112012 1.158 1.323 2011 2012 322.0 370.3 4Q11 4Q12 Segments Highlights Automotive Logistics – R$ million Net Revenue of R$ 370.3 million (+15.0 vs 4Q11).  Growth of 7.6% year on year in the number of vehicles transported in domestic market;  Increase of 15.4% in gross revenue of vehicle logistics; 15.0% -7.7% 5 EBITDA of R$ 45.1 million (-7.7% vs 4Q11), with margin of 12.2% (-3.0 p.p vs 4Q11). GROWTH SUPPORTED BY THE RECOVERY IN VEHICLES SALES 14.2% 1.6% Net Revenue of R$ 1.323 million (+14.2% vs 2011).  Growth of 8.4% year on year in the number of vehicles transported in domestic market in 2012;  Increase of 15.3% in gross revenue of vehicle logistics; EBITDA of R$ 174.3 million (1.6% vs 2011), with margin of 13,2% (-1.6 p.p vs 2011). 4Q12 2012 Net Revenue Adjusted EBITDA
  • 6.
    34.9 13.5 2011 2012 350.9 477.1 2011 2012 116.3 126.0 4Q114Q12 Segments Highlights Integrated Logistics – R$ million 8.3% 6 STRONG GROWTH IN CONSUMPTION GOODS 36.0% -60.3% 4Q12 2012 Net Revenue of R$ 126.0 million (8.3% vs 4Q11). • Increase of 88.1% in the logistics for the E-commerce segment; • Growth of 7.4% in the telecommunications gross revenue; EBITDA of R$ -4.3 million (-134.6% vs 4Q11), with margin of -3.4% (-14.1 p.p vs 4Q11). Net Revenue of R$ 477.1 million (36.0% vs 2011). • Increase of 134.4% in the logistics for the E- commerce segment. • Growth of 28% in the telecommunications gross revenue; EBITDA of R$ 13.5 million (-61.3% vs 2011), with margin of 2.8% (-7.1 p.p vs 2011). Net Revenue Adjusted EBITDA 12,5 -4,3 4Q11 4Q12 -134.6%
  • 7.
    Scenario 2012 |Outlook 2013 Integrated Logistics 7 SCENARIO 2012 → Growth of e-commerce: – Increased customer base; – Increased capillarity; – Acquisition of LTD Businesses; → Profile change in storage clients; → Increased administrative structure, commercial and support team; → Increased occurrences of theft and misplacement;
  • 8.
    Scenario 2012 |Outlook 2013 Integrated Logistics 8 SCENARIO 2012 → Growth of e-commerce: – Increased customer base; – Increased capillarity; – Acquisition of LTD Businesses; → Profile change in storage clients; → Increased administrative structure, commercial and support team; → Increased occurrences of theft and misplacement; OUTLOOK 2013 → Growth of e-commerce: – Consolidation of existing customer base; – Maturation of operational centers; – Integration of Direct and LTD structures; → Implementation of storage operations for the segment of e-commerce; → Improvement on management processes; → Restructuring the area of ​​Risk Management;
  • 9.
    Consolidated Results Net Income- R$ million NET INCOME IMPACTED BY FINANCIAL AND OPERATIONAL ITEMS. 9 29.9 17.4 4Q11 4Q12 40.2% 4Q12 99.1 83,4 2011 2012 14.4% 2012
  • 10.
    192 202 226 213 227 0.8 X 0.9X 1.1 X 1.0 X 1.2 X -10,000.0 -8,000.0 -6,000.0 -4,000.0 -2,000.0 0.0 0 50 100 150 200 250 4Q11 1Q12 2Q12 3Q12 4Q12 Consolidated Results Cash and Equivalents – R$ million Net Debt/EBITDA /EBITDA 12 months Debt Profile 61% 39% ST LT 10
  • 11.
    IR Contacts Alexandre Brandão +55(11) 4346-2532 alexandre.brandao@tegma.com.br Ian Nunes +55 (11) 4397-9423 ian.nunes@tegma.com.br
  • 12.
    The forward-looking statementscontained in this report are subject to risks and uncertainties. Such forward-looking statements are based on the management’s beliefs and assumptions and information currently available to the Company. Such statements include information about our current plans, beliefs or expectations, as well as those of the Board of Directors and Board of Executive Officers. These reservations concerning forward-looking statements also apply to information on our possible or presumed operating results, as well as declarations preceded by, including or followed by such words as "believe," "may," "will," "continue," "expect," "foresee," "intend," "plan," "estimate" and other similar expressions. Forward-looking statements are not guarantees of performance; Since they refer to the future, they depend on circumstances that may or may not occur and are therefore subject to risks, uncertainties and assumptions. Future results may differ materially from those expressed or suggested by said forward-looking statements. These results and amounts depend on many factors beyond TEGMA’s control or expectations. 12 Disclaimer