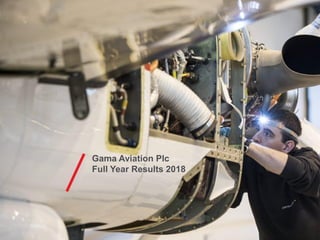
Gama Aviation Plc FY2018 results
•
0 likes•39,850 views

2018 full year results presentation for Gama Aviation Plc. For more investor information please see www.gamaaviation.com/investors

Recommended
Recommended
More Related Content
What's hot
What's hot (20)
Similar to Gama Aviation Plc FY2018 results
Similar to Gama Aviation Plc FY2018 results (20)
Recently uploaded
Recently uploaded (19)
Gama Aviation Plc FY2018 results
- 1. Gama Aviation Plc Full Year Results 2018
- 2. Group financial results 2018 Financial results for 2018 • Fell short on delivering our financial performance • Remain a robust, profitable and cash generative core business • Sound financial base & healthy balance sheet Strong business fundamentals based on a sound operational platform • Business unit trading is stable (slight year-on-year increase in revenues) • Organic investment plan remains on track • Continued disciplined approach to acquisitions & JV’s A busy year, making good progress • Fund raise and RCF • Group projects to enhance systems, process & teams • Real estate portfolio consolidation • Improved financial methodology, policies and their application • Award of new contracts Outlook for 2019 • Strengthening Board & Governance • Focused on delivery of the 2019 targets • Long term strategy remains appropriate in a consolidating market • Robust, profitable and largely cash generative business 2 Group revenue: $234.8m Gross profit: 19.2% Gross profit: $45.1m Adjusted EPS: 14.6 cents Dividend: 2.00p
- 3. Gama Aviation: one of the world’s leading business aviation services companies Clients include: • High-net worth individuals • Fleet operators • Multi-national corporations • Defence • Law enforcement • Health services 3 Scale and reach: • 4 continents • 40+ locations • 1500+ staff Growing global multi-disciplined aviation services business • Few global competitors with the same scale, breadth & depth • Leading positions in highly fragmented markets • Regulatory change helping to drive growth • Consolidation removing some MRO competitors Capital light business model with a lower risk profile • No exposure to aircraft residual value risk • No exposure to fuel variations Robust & resilient model • Gross profits derived from availability of aircraft not usage Three complementary divisions • Air, Ground & Global services – provide best-in-breed or holistic, turnkey solutions to a wide variety of clients Global services
- 5. Group financial results 2018 $’m 2018 2017 (Restated) Revenue 234.8 207.4 Gross profit 45.1 45.6 Gross profit % 19.2% 22.0% EBITDA (26.9) 16.8 EBIT (30.4) 17.4 Adjusted EBIT 11.3 18.3 (Loss)/Profit before Tax (30.8) 15.7 Adjusted EPS (cents) 14.6 30.7 • Revenue of $234.8m, has increased $27.4m (+13.2%) on last year (2017: $207.4m), via acquisition in Asia and organic growth • Gross Profit at $45.1m flat on last year, margins down 2.8bp due to higher pass-through costs in the Air Division • Bottom line impacted by number of one-off and exceptional items totalling $40.3m for the year. This includes: • $27.7m goodwill impairment • $2.4m restructuring • $2.3m litigation • $3.6m transaction related • $3.6m cash contribution to US Associate • $0.7m share based payments • EBIT at $(30.4)m and Loss before Tax (excluding discontinued) at $(30.8)m a result of the exceptional charges above • Adjusted EBIT down $7m (-38.3%) year-on-year • Adjusted EPS at 14.6c, down (-52%) year-on-year • 2018 proposed dividend at 2p, down from 2.75p in 2017 5 1 - Calculated at a constant foreign exchange rate of $1.34 to £1, being the rate that represented the average for the 2018 financial period
- 6. Adjusted EBIT1 • This is the key metric that the Group reports performance against • It will reconcile to the statutory result and each Business Unit in the Group is now aligned on delivery of their part of the total Group target 6 $’m 2018 2017 (Restated) Reported EBIT (30.4) 17.4 Add back accounting exceptionals 8.3 2.7 Cash contribution to US associate 3.6 - Add back goodwill write-off and impairment of acquired intangibles 27.7 - Add back share based payments 0.7 0.2 Add back acquisition related intangible amortisation 2.4 1.4 Release of provisions in associate / disposal of associate (1.0) (3.4) Adjusted EBIT 11.3 18.3 1 Adjusted EBIT is stated after removing impairment losses, share based payment charges; acquisition related and accelerated amortisation; and exceptional costs, which comprise: transaction costs; legal, integration and business re-organisation costs and contribution to associate.
- 7. Accounting exceptionals distort the true underlying position … $’m H1 H2 Full Year Restructuring 0.4 2.0 2.4 Litigation 1.8 0.5 2.3 Transaction related 2.0 1.6 3.6 Cash contribution to US associate 3.6 3.6 Share Based Payments 0.2 0.5 0.7 Goodwill / Intangibles Impairment 27.7 27.7 Total 8.0 32.3 40.3 • Restructuring costs materially made up of Bournemouth move in H2 (people and moving costs). • Litigation costs largely incurred in H1 associated to the Dustin Dryden case. 2 litigation cases remain open. • Transaction costs in H1 relate to the fund raise and Hutchinson Whampoa M&A. In H2, they relate to aborted M&A fees on three potential acquisitions. • Cash contribution to US associate in Q1 2018. • Impairment of $27.7m relates to $20.4m write down of goodwill associated with the Hanger8 acquisition and impairment of acquired Intangibles of $7.3m. 7
- 8. Cash flow $’m 2018 2017 (Loss) / profit before tax (including discontinued) (31.7) 13.7 Add back Goodwill / In tangibles Impairment 27.7 - Other - 1.3 Adjusted Cash Flow (4.0) 15.0 Net Working Capital (14.8) 3.7 Net Interest and tax paid (2.5) (5.3) Net cash (expensed on) / generated by operating activities (21.3) 13.4 Cash Flows from Investing Activities (slide 22) (25.7) (4.5) Cash Flows from Financing Activities (slide 23) 35.4 0.7 Net (decrease) / increase in cash and cash equivalents (11.6) 9.6 8 • Net cash outflow of $12m during 2018 • The key components to this are: • £48m cash inflow from equity fund raise • Working capital worsened by $15.9m • US associate cash position worsened by $8.6m • $22.2m spent on M&A • $5.2m spent on normal CAPEX • $35.7m pay down of previous RCF • $10.3m drawn on new RCF • $2.3m Dividend paid • Working capital and cash management now a key focus area for the business going forwards • US associate self funding going forwards
- 10. Group adjusted trading summary 2018 2017 Revenue Air Division 135.9 115.5 Ground Division 95.0 87.5 Global Services Division 3.9 4.4 Total Revenue 234.8 207.4 Adjusted EBIT Air Division 5.6 8.5 Ground Division 8.1 10.9 Global Services Division 1.3 1.8 Associate Result 0.6 0.2 Central Costs (4.3) (3.1) Total Adjusted EBIT 11.3 18.3 10
- 11. Adjusted Air division performance $’m US Europe Middle East Asia Total 2018 2017 2018 2017 2018 2017 2018 2017 2018 2017 Revenue 4.9 5.0 88.8 86.9 20.9 23.5 21.3 0.1 135.9 115.5 Gross profit 5.0 5.1 7.5 10.2 2.2 1.8 1.8 0.1 16.5 17.2 GP % 102% 102% 8% 12% 11% 8% 8% 100% 12% 15% EBIT 4.9 5.6 0.2 2.3 0.2 0.5 0.3 0.1 5.6 8.5 EBIT % 99% 113% 0% 3% 1% 2% 1% 100% 4% 7% 11 • US reports branding fee income. • Europe was subject to circa $1m of provision release in 2017 and another circa $1m of balance sheet clean up in 2018. Number of aircraft under management stable and legacy loss making contracts managed out. • Asia was a 50:50 JV in 2017, 100% of revenues and profits consolidated from March 2018 following acquisition of remaining equity.
- 12. Adjusted Ground division performance 12 $’m US Europe Middle East Asia Total 2018 2017 2018 2017 2018 2017 2018 2017 2018 2017 Revenue 37.5 30.8 52.3 53.0 4.7 3.7 0.5 - 95.0 87.5 Gross profit 8.1 6.1 16.3 18.0 1.4 1.2 0.1 - 25.9 25.3 GP % 22% 20% 31% 34% 30% 33% 18% - 27% 29% EBIT 1.9 2.3 6.7 8.4 (0.3) 0.1 (0.2) - 8.1 10.9 EBIT % 5% 8% 13% 16% -7% 5% -36% - 9% 12% • US booked significant one-off items in 2017 (overhead capitalisation) that were not repeated in 2018. • Europe includes $1m of losses associated with underperformance of the Oxford facility that will not be repeated in 2019. • Middle East is recognising $0.6m of lease costs associated with the BAC build in 2018, which will continue going forwards. • Asia continues to grow its collaboration with CASL and is forecast to generate profits in 2019.
- 13. Adjusted Global Services division performance 13 $’m Total 2018 2017 Revenue 3.9 4.4 Gross profit 2.7 3.1 GP % 67% 70% EBIT 1.3 1.8 EBIT % 32% 40% • FlyerTech previously consolidated in Europe Air, no material change year-on-year. • myairops previously consolidated in Europe Ground, significant investment in re-platforming the software products during 2018, which completes in H1 2019.
- 14. Adjusted associate performance $’m US Air CASL Total 2018 2017 2018 2017 2018 2017 Share of results from equity accounted investments 0.4 0.2 0.2 - 0.6 0.2 Total 0.4 0.2 0.2 - 0.6 0.2 14 • Group consolidates 24.5% of the US Air net profit. Trading result up $0.2m on 2017. • Group consolidates 20% of the CASL net profit.
- 16. Our strategy continues... Scale of presence & coverage Breadth of geographies & services To become the global market leader in business aviation services through organic, joint venture and acquisition-led growth. Depth of capabilities & expertise 16 Reverse takeover Hangar8 Plc 2015 JV Hutchison Whampoa 2015 Merger BBA Aviation Plc’s / Gama Aviation Plc’s US Air associate 2017 Commercial Partnership China Aircraft Services Limited (CASL) 2017 Equity placing $67 million raise. Hutchison Whampoa become strategic investor 2018 Acquired Aviation Beauport 2016 Acquired FlyerTech 2016 RCF facility $50 RCF facility with NatWest & Barclays 2018 Acquired 20% interest in CASL & purchase of Hong Kong JV 2018
- 17. 2019 Growth plan 17 Aircraft management Scale up Scale up through acquisition Scale up through investment Build Special missions Evaluate Scale up Evaluate Evaluate Charter Scale up Scale up through acquisition Scale up Evaluate Base / heavy maintenance Launching with investment Scaled up with Bournemouth facility Build through investment Build Line & AOG maintenance Scaled up with additional bases Scale up through investment Build through investment Build Design & modifications Evaluate Scale up Evaluate Evaluate FBO services N/A Build Building through investment Evaluate Key Evaluate Market analysis, market entry strategy Launching Market entry. Low market penetration. Develop via investment and / or JV Build Adding breadth & depth to the established launch platform via further investment and / or acquisition Scale up Proven, mature business with established client base scaling up via further investment and / or acquisition Division US Europe Middle East Asia AirGround myairops Launching Organic investment. Moving to SaaS platform FlyerTech Build Globalservices
- 18. Three points of focus for the business in 2019 Retain & win high quality contracts • Focus on our core business - from line to heavy maintenance in the US - addition of completions & paint specialism - Bournemouth jets pipeline - Sharjah BAC • Leverage strong track record in special missions - award of £90 million contracts in 2018 - Bournemouth acts as a centre of excellence • Leverage air ambulance track record & capability - award of £50 million contract extension to June 2023 • Drive cross sell opportunities - across all divisions - maximise the revenue opportunity - leverage global services relationships 18 Enhance efficiency • System improvements - financial reporting & forecasting - Business process / operations (Air & Ground) - Intranet, CRM, Sage People • Legal entity consolidation - Removing complexity, cost & risk • Real estate consolidation - Fairoaks, Oxford & Farnborough Grow our people • Company wide bonus scheme - business development & annual plan ownership • Continue to attract high quality candidates - Pilots, engineering, operations, management • Focus on training - systems, capability, retention (engineers) 1 2 3
- 19. Outlook for 2019 A strong underlying platform • A robust, profitable and largely cash generative business • Sound financial base and a healthy balance sheet • Funding in place to support organic and investment growth A strategy that will deliver sustainable profit growth • Continued market consolidation driving change in the market • Prime position to capitalise • Relevant services that continue to attract, win & retain high value opportunities • Organic investment in key areas of the business to drive future growth Positive changes to support continued growth • New Chairman to lead the Board through the next phase of development • Business aligned to deliver 2019 expectations 19
- 20. Appendices
- 21. Appendix one: Net debt $’m 2018 2017 2018 Net (decrease) / increase in cash and cash equivalents (previous slide) (11.6) 9.6 Opening Cash and Bank balances 22.3 11.2 Foreign Exchange (0.7) 1.5 Cash and Bank Balances at end of year 10.0 22.3 Borrowings (9.9) (36.6) Obligations under finance lease (3.0) (3.7) Net Debt at end of year (2.9) (18.0) 21 • 2017 borrowings restated $5m higher as a result of correct classification of $5m cash transaction to short term borrowings • Overall net debt has improved circa $15m after the restatement
- 22. Appendix two: Cash flows from investing activities 22 $’m 2018 2018 2018 2017 Fund raise Trading Total Total Normal CAPEX (5.4) (5.4) (8.5) Purchase of Intangibles (3.2) (3.2) (1.6) Proceeds on disposal of assets held for resale 1.5 1.5 5.6 20% investment in CASL (16.0) (16.0) Acquisition of other 50% of JV with Hutchison Whampoa in Hong Kong (2.6) (2.6) Net cash received / (used) by investing activities (18.6) (7.1) (25.7) (4.5) • CAPEX includes: • Bournemouth move of circa $0.8m • Sharjah BAC of circa $0.5m • Organic growth in US • Purchase of intangibles is $2.0m invested in re-platforming MyAirOps • Disposal of assets is the sale of the final aircraft held for sale at year-end 2017 • $16m investment in buying 20% of the China Aircraft Services Limited business in Hong Kong as part of the Hutchison Whampoa investment in the Plc in February 2018 • $2.6m acquisition of the remaining 50% of the joint venture with Hutchison Whampoa in February 2018
- 23. Appendix three: Cash flows from financing activities 23 $’m 2018 2018 2018 2017 Fund raise Trading Total Total Issuance of shares 63.7 - 63.7 - Consideration for acquisition of non-controlling interest - - - (5.1) Repayments of finance leases - (0.6) (0.6) (1.9) Proceeds from borrowings (new RCF) - 10.3 10.3 13.2 Repayment of borrowings (old RCF) (35.7) - (35.7) (4.0) Dividend paid - (2.3) (2.3) (1.5) Net cash received / (used) From Financing Activities 28.0 7.4 35.4 0.7 • $63.7m (£48m) raised from issuing new shares in February 2018 • New $50m RCF signed in September 2018, $10.3m drawn at year end 2018. • Old RCF of $35.7m repaid in full with proceeds of the fund raise • $2.3m dividend paid in the year
- 24. Disclaimer This presentation contains forward looking statements, which are based on the Gama Aviation Board's current expectations and assumptions and may involve known and unknown risks and uncertainties that could cause actual results, performance or events to differ materially from those expressed or implied in such statements. Any forward looking statements contained in this presentation are based on past trends or activities and should not be taken as a representation that such trends or activities will continue in the future. It is believed that the expectations reflected in these statements are reasonable, but they may be affected by a number of variables which could cause actual results or trends to differ materially, including, but not limited to: conditions in the market, market position of Gama Aviation and its technologies, earnings, financial position, cash flows, anticipated investments and economic conditions; the Group's ability to obtain capital/additional finance; a reduction in demand by customers; an increase in competition; an unexpected decline in revenue or profitability; legislative, fiscal and regulatory developments, including, but not limited to, changes in environmental regulations. No statement in this presentation is intended to constitute a profit forecast, nor should any statements be interpreted to mean that potential commercial opportunities, earnings or earnings per share will necessarily be greater or lesser than those for the relevant preceding financial periods for the Group. Each forward looking statement relates only as of the date of the particular statement. Except as required by the AIM Rules, the Disclosure and Transparency Rules, the London Stock Exchange or otherwise by law, the Group expressly disclaims any obligation or undertaking to release publicly any updates or revisions to any forward looking statements contained herein to reflect any change in the Group's expectations with regard thereto or any change in events, conditions or circumstances on which any such statement is based. The information in this presentation does not constitute an offer to sell or an invitation to buy shares in Gama Aviation Plc or an invitation or inducement to engage in any other investment activity. 24