Download to read offline
![International Journal of Scientific Research and Management Studies (IJSRMS)
ISSN: 2349-3771 Volume 1 Issue 2, pg: 60-64
http://www.ijsrms.com ©IJSRMS pg. 60
Modelling the Kinetic of UV Water Disinfection
Hafida Lebik a*, Farid Madjene a, Lamine Aoudjit a, Sadek Igoud a
a Unité de développement des Equipements Solaires-UDES/ EPST Centre de Développement des Energies Renouvelables –CDER,
Route Nationale 11, BP.386, Bou Ismaïl, Tipaza, Algeria
ABSTRACT
Ultraviolet disinfection is an attractive tool for treating water and eliminating pathogens with safe and available technology especially in developing countries where waterborne diseases cause the death of thousands of people every year. Even though UV is an easy tool to perform disinfection, concerns over the potential of microorganism reactivation constitute an issue for its development. In order to avoid this phenomenon, estimating the right dose of UV irradiance, the number of viable microorganisms and the sufficient contact time are important parameters to consider when performing UV disinfection. For this purpose, it’s current to use mathematical modelling. This work aimed to study the modelling of the kinetic of water disinfection by UV irradiation. Two kinetic models (Chick-Watson and Hom) were tested as to ability to scale disinfection of Gram negative Escherichia coli and Gram positive Lactobacillus Helveticus by different ultraviolet (UV) light inactivation process: UV alone, UV and TiO2 as a photocatalyst and finally UV and ZnO as a photocatalyst. The two tested models (Chick-Watson and Hom) fitted the kinetic of disinfection of E. coli. However, it must be noticed that, the simple agreement between experimental data and model predictions does not necessarily prove that either of the models is mechanistically correct. For the disinfection of L. Helveticus, neither of the two models fitted the experimental plots. The divergence existing between experimental and modelling results proves only that the empirical models can’t be generalized to all deactivated microorganisms.
KEYWORDS: UV Disinfection, Modelling, Chick-Watson, Hom
I. INTRODUCTION
Producing a safe drinking water is a priority especially that water represents one of the major sources of disease transmission in the world, particularly in areas where water sanitation is not available or is inadequate [1]. It is estimated that 80% of all sickness and disease in developing countries is caused by unsafe water and inadequate sanitation [2]. Waterborne pathogens, including viruses, bacteria, and protozoa, are responsible for 3.5 billion cases of diarrhea each year and 1.8 million deaths as a result of contaminated drinking water [3].
Unfortunately, the most commonly used disinfection methods are usually chemicals consuming and forming hazardous disinfection by-products (DBPs). It’s therefore important to investigate new technologies which overcome these disadvantages. Among these alternative methods there is UV disinfection process which used increasingly in the water treatment plant. In 2001, it has been reported that the number of UV installations in Europe had risen to over 6,000, with most treating groundwater. As of 2003, approximately 15% – 20% of the municipal wastewater market in the United States employed UV disinfection, with the number steadily increasing over the past 5 years [4]. UV disinfection provides a secure and a cheap means for water treatment. But the most important advantage of using UV light in disinfection is that it does not produce any toxic by-products during or after the disinfection process [5].
UV light can be categorized as UV-A, UV-B, UV-C or vacuum-UV, with wavelengths ranging from about 100 to 400nm. The UV light effective for inactivating microorganisms is in the UV-B and](https://image.slidesharecdn.com/2n2-ijsrms0102105v1is260-64-141030052830-conversion-gate01/85/Modelling-the-Kinetic-of-UV-Water-Disinfection-1-320.jpg)
![International Journal of Scientific Research and Management Studies (IJSRMS)
ISSN: 2349-3771 Volume 1 Issue 2, pg: 60-64
http://www.ijsrms.com ©IJSRMS pg. 61
UV-C ranges of the spectrum (200-310nm), with maximum effectiveness around 265nm [6]. UV disinfection inactivates the viable bacterial cell by causing irreparable damage to the cellular DNA. Specifically, germicidal UV irradiation at 254nm causes dimerization of adjacent thymine monomers on the same strand of DNA. This prevents normal DNA transcription and replication, effectively resulting in inactivation of the bacterial cell [7].
Mathematical modelling can play a particularly useful role in UV disinfection process; it constitutes the basis for sizing ultraviolet disinfection equipment and for interpreting test results. Having a model for predicting microbial growth in a water treatment plant is an essential tool to prevent an eventual microbial regrowth in UV disinfection process.
The kinetic of disinfection has a profile characterized by three distinct regimes. In the first regime, a “shoulder” or a slow deactivation of the microorganisms occurs. In the second regime, a log-linear reduction in concentration of the microorganism is observed. The last part of the deactivation process is characterized by a slow reduction in concentration or tailing of the concentration profile [8].
In order to describe the different regimes of microorganisms deactivation, several models have been proposed. Some are mechanistic (based on reaction mechanisms) while the others are empirical (based on experimental results).
Due to the complex mechanism of the disinfection processes, the kinetic analysis of bacterial inactivation has been usually carried out using empirical models. In this study two of them are used to describe the disinfection process of Gram negative Escherichia coli and Gram positive Lactobacillus Helveticus: Chick-Watson model and Hom model.
These models are applied to the experimental results issued from the work of Liu et al. [9].
II. DISINFECTION MODELS USED
In order to standardize their experimental data, different researchers used different kinetic models. The principles of the laws of disinfection were first introduced by H. Chick in 1908 [10]. Chick assumed that disinfection should conform to the same laws that govern the chemical processes where the kinetic is expressed as a first-order reaction rate:
푟=−푘푐푁 (1)
The equation (1) can also be written as:
푙푛 푁 푁0=−푘푐푡 (2)
A year later, Watson found that under first order kinetics the relationship between the concentration of a chemical disinfectant and the time of exposure was a constant that produced a specific level of inactivation [3]:
퐶푛푡=푐표푛푠푡푎푛푡=휆 (3)
In the above equation, n is the coefficient of dilution and c is the disinfectant concentration. This led to the development of Ct values, which links the inactivation rate to the concentration of the disinfectant and the time. The Chick-Watson model can be expressed as above:
ln 푁 푁0=−푘퐶푛푡 (4)
In most cases, n=1, and the reaction follows first order kinetics if the concentration of disinfectant is constant.
ln 푁 푁0=−푘C푡 (5)
For ultraviolet (UV) inactivation, the model is modified with the UV-Dose or fluence. Here, the intensity replaces the concentration in the Chick- Watson model [11].
ln 푁 푁0=−푘퐼푛푡 (6)
The main advantage of models based on Chick’s law is simplicity. However, it is difficult to make far-reaching conclusions and compare different studies based on the Chick–Watson model. Firstly, Chick’s law assumes first-order kinetics and it has been found that disinfection of various microbes (even with chemicals) usually deviates from this assumption. Secondly, parameters, often with no real physical meanings, are introduced to allow the model to fit observed data [12].](https://image.slidesharecdn.com/2n2-ijsrms0102105v1is260-64-141030052830-conversion-gate01/85/Modelling-the-Kinetic-of-UV-Water-Disinfection-2-320.jpg)
![International Journal of Scientific Research and Management Studies (IJSRMS)
ISSN: 2349-3771 Volume 1 Issue 2, pg: 60-64
http://www.ijsrms.com ©IJSRMS pg. 62
Hom’s model for the microbial disinfection kinetics is frequently applied to the experimental data that departs from the Chick’s inactivation law. Hom’s model introduced an empirical coefficient in the Chick-Watson model given in Eq. 4. The expression took the form:
ln 푁 푁0=−푘C푛푡푚 (7)
This expression reduces to the classic Chick-Watson model for m = 1, produces shoulder and tail regions for: m > 1 and m < 1, respectively. However, it is also unable to produce both regions simultaneously.
III. APPLYING MODELS INTO REAL DISINFECTION CASE
The Chick-Watson model and Hom model are applied to the experimental results issued from the work of Liu et al. [5], where the photocatalytic inactivation of Gram negative Escherichia coli and Gram positive Lactobacillus helveticus by both TiO2 and ZnO with 365nm ultraviolet (UV) light was studied in a batch reactor. The initial E. coli cell (108CFU/ml) was inactivated in the presence of 2g/L ZnO. The inactivation of E. coli was also tested using 2g/L TiO2. Same experiences were conducted with L. Helveticus.
The Chick-Watson model (Eq.4) and the Hom model (Eq. 7) were considered in order to find a best- fit model for the experimental results. The optimal parameters for each model (k in Chick-Watson, n, m, and k in Hom) were obtained with the Origin7 program using nonlinear regression.
The concentration of the disinfectant was considered constant and was replaced by the fluence rate (I =20W/m²).
Case of E. coli
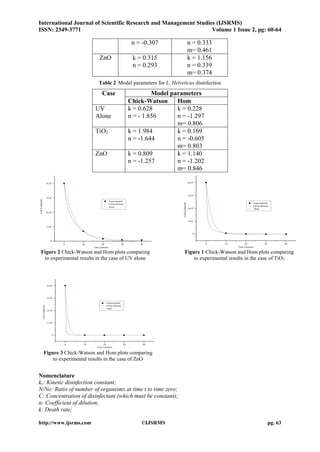
Using model parameters (Table 1), the theoretical curves of E. coli inactivation were traced and compared to the experimental plots for the three cases (UV alone, TiO2, ZnO).
In the three cases studied, the suitability of the two studied models is confirmed, by the high correlation coefficients (R2 values vary from 0.9987 to 1), that present the theoretical curves. However, since two different models can be used to describe the data, the simple agreement between experimental data and model predictions does not necessarily prove that either model is mechanistically correct [13].
Case of L. Helveticus
In the case of L. Helveticus disinfection (Table 2), neither Chick-Watson model nor Hom model fitted the experimental results. This observation had been already made with Chick –Watson model which can’t simulate properly the experimental results in certain cases[14]. Moreover, experimental evidence indicates that this model does not always apply[15].
IV. CONCLUSION
Two empirical kinetic models (Chick-Watson and Hom) were tested to Escherichia coli, a gram negative bacterium traditionally used as an indicator of faecal contamination of water, and to gram positive Lactobacillus Helveticus, in the case of different ultraviolet (UV) light inactivation process: UV alone, UV and TiO2 as a photocatalyst and finally UV and ZnO as a photocatalyst.
The two tested models (Chick-Watson and Hom) fitted the kinetic of disinfection in the case of E. coli, while neither of them fitted the experimental data in the case of L. Helveticus.
However, it is difficult to make far-reaching conclusions and compare different studies made with the empirical models, since the parameters introduced in these models have no physical meaning, and varies if the studies are conducted under dissimilar conditions.
Table 1 Model parameters for E. coli disinfection
Case
Model parameters
Chick-Watson
Hom
UV
Alone
k = 0.223
n = -0.083
k = 0.344
n = - 0.007
m= 0.723
TiO2
k = 0.993
k = 0.503](https://image.slidesharecdn.com/2n2-ijsrms0102105v1is260-64-141030052830-conversion-gate01/85/Modelling-the-Kinetic-of-UV-Water-Disinfection-3-320.jpg)
![International Journal of Scientific Research and Management Studies (IJSRMS)
ISSN: 2349-3771 Volume 1 Issue 2, pg: 60-64
http://www.ijsrms.com ©IJSRMS pg. 64
No: Initial number of organisms;
N: Surviving number of organisms at a contact time t;
t: Duration of contact;
I = intensity;
It = fluence.
REFERENCES
[1] F. M. Salih, Water Research 2003, 37, 3921-3927.
[2] A. B. Pandit and J. K. Kumar, Drinking Water Disinfection Techniques, Taylor & Francis Group, Boca Raton, 2013, p. 270.
[3] O. K. Dalrymple in Mechanistic Modeling of Photocatalytic Water Disinfection, Vol. Doctor of Philosophy University of South Florida, Florida, 2011.
[4] G. C. White, White’S Handbook of Chlorination and Alternative disinfectants, John Wiley & Sons, Hoboken, New Jersey, 2010, p.
[5] G. E. Whitby and O. K. Scheible, IUVA NEWS 2004, 6, 15-26.
[6] LeChevallier Mark W and Kwok-Keung Au, Water Treatment and Pathogen Control:Process Efficiency in Achieving Safe Drinking Water, WHO, 2004, p. 136.
[7] S. A. Amos, K. R. Davey and C. J. Thomas, Trans IChemE 2001, 79, 174 -182.
[8] R. Vinu and G. Madras in Photocatalytic Degradation of Water Pollutants Using Nano-TiO2, Vol. (Ed. L. Zang), Springer-Verlag London Limited, 2011, pp. 625-677.
[9] H.-L. Liu and T. C.-K. Yang, Process Biochemistry 2003, 39, 475-481.
[10] H. Chick, The Journal of Hygiene 1908, 8, 92-158.
[11] M. Brennecke in Disinfection Kinetics of Virus Aggregates of Bacteriophage MS2, Vol. Master Ecole Polytechnique Fédérale de Lausanne, 2009, p. 51.
[12] E. S. Omatoyo K. Dalrymplea, Maya A. Trotzb, D. Yogi Goswami, Applied Catalysis B: Environmental 2010, 98, 27–38.
[13] Blaine F. Severin, Makram T. Suidan and Richard S. Engelbrecht, Water Research 1983, 17, 1669- 1678.
[14] E. Chan in Evaluation de l'efficacité de la désinfection par le chlore dans un réservoir, Vol. Maîtrise es sciences appliquées Ecole polytechnique de Montréal, Montréal, 2000.
[15] D. A. Lyn, K. Chiu and E. R. B. III, JOURNAL OF ENVIRONMENTAL ENGINEERING 1999, 17-26.](https://image.slidesharecdn.com/2n2-ijsrms0102105v1is260-64-141030052830-conversion-gate01/85/Modelling-the-Kinetic-of-UV-Water-Disinfection-5-320.jpg)

This document summarizes a study that models the kinetic of UV water disinfection. Two kinetic models, Chick-Watson and Hom, were tested on their ability to model the disinfection of E. coli and L. Helveticus bacteria under UV light alone, UV with TiO2 photocatalyst, and UV with ZnO photocatalyst. Both models fitted the experimental data for disinfection of E. coli but neither model fitted the data for disinfection of L. Helveticus, showing the limitations of empirical models in representing all microorganisms. The document concludes the parameters in empirical models have no physical meaning and the models cannot be generalized to all cases of microbial disinfection.