This study analyzes the impact of school management types and other factors on the educational performance of primary school children in Navi Mumbai, using a multiple classification model. Findings indicate that the type of school management has the most significant effect on educational quality, with a higher student-teacher ratio and smaller class sizes also contributing positively, while the proportion of trained teachers showed minimal impact. Data collected from 11078 students across various school types revealed that schools managed by Zilha Parishad outperformed private schools despite the latter having better infrastructure.
![IJAPRR Page 1
International Journal of Allied Practice, Research and Review
Website: www.ijaprr.com (ISSN 2350-1294)
Effect of Type of School Management and School
Factors on Educational Performance of Primary
School Children in Navi Mumbai: Multiple
Classification Model
Rita Abbi
Head, statistics Department
City and Industrial Development Corporation of Maharashtra Ltd
Abstract - The multiple classification model was constructed to measure the educational performance schools based
on the academic achievement of primary students studying in class 1 to 7. In the present paper, Multiple
Classification Analysis (MCA) model ‘Quality of Education’ is a dependent variable and type of school management,
student-teacher ratio, class size percentages of trained teachers are predictors. The percentage of permanent teachers
and number of years of experience in teaching were covariates.
The study was carried out in Navi Mumbai – the satellite town of Mumbai (India), has been planned and developed to
ease population pressure on the primate city. The primary data has been collected by the author during 2012. The
city has three types of management of primary schools, namely, Zilha Parishad (ZP); Navi Mumbai Municipal
Corporation (NMMC) and Private. A representative sample of 20% of primary schools has been randomly selected
from the list of each of the three types of schools of Navi Mumbai using random number tables.
The findings revealed that type of school management is dominant variable affecting quality of education followed by
student-teacher ratio and class size after controlling the remaining predictors and covariates in the model. However,
percentage of trained teachers had little effect on quality of education. It has been also observed that students-
teacher ratio and class size were low in ZP schools and the performance of students was better in ZP public schools.
Nevertheless, despite better infrastructure in private schools, the final results were far impressive in ZP schools.
Keywords: Multiple Classification Analysis; school; management; educational performance;
1. Introduction
Apart from providing the primary education to masses in India, its quality has been a major
cause of concern for the Government. “Among several development indexes used to measure societal
growth, the most important for us are those proposed for measuring quality of education” [2]. “The
expansion of primary education in India over the last decade has been phenomenal. But, by all
accounts, the expansion of the Indian education system has led to deterioration in the quality of
education” [14]. Good management plays an important role in academic achievement of schools. The
key function of school management is to supervise administration system. Enrolment of students,
appropriate curriculum, schedule the classes, allocation of teachers to each class, is also part of school](https://image.slidesharecdn.com/28ijaprr-vol1-4-01-13ritaaabi-150107034458-conversion-gate01/85/28-ijaprr-vol1-4-01-13ritaaabi-1-320.jpg)
![IJAPRR Page 1
International Journal of Allied Practice, Research and Review
Website: www.ijaprr.com (ISSN 2350-1294)
Effect of Type of School Management and School
Factors on Educational Performance of Primary
School Children in Navi Mumbai: Multiple
Classification Model
Rita Abbi
Head, statistics Department
City and Industrial Development Corporation of Maharashtra Ltd
Abstract - The multiple classification model was constructed to measure the educational performance schools based
on the academic achievement of primary students studying in class 1 to 7. In the present paper, Multiple
Classification Analysis (MCA) model ‘Quality of Education’ is a dependent variable and type of school management,
student-teacher ratio, class size percentages of trained teachers are predictors. The percentage of permanent teachers
and number of years of experience in teaching were covariates.
The study was carried out in Navi Mumbai – the satellite town of Mumbai (India), has been planned and developed to
ease population pressure on the primate city. The primary data has been collected by the author during 2012. The
city has three types of management of primary schools, namely, Zilha Parishad (ZP); Navi Mumbai Municipal
Corporation (NMMC) and Private. A representative sample of 20% of primary schools has been randomly selected
from the list of each of the three types of schools of Navi Mumbai using random number tables.
The findings revealed that type of school management is dominant variable affecting quality of education followed by
student-teacher ratio and class size after controlling the remaining predictors and covariates in the model. However,
percentage of trained teachers had little effect on quality of education. It has been also observed that students-
teacher ratio and class size were low in ZP schools and the performance of students was better in ZP public schools.
Nevertheless, despite better infrastructure in private schools, the final results were far impressive in ZP schools.
Keywords: Multiple Classification Analysis; school; management; educational performance;
1. Introduction
Apart from providing the primary education to masses in India, its quality has been a major
cause of concern for the Government. “Among several development indexes used to measure societal
growth, the most important for us are those proposed for measuring quality of education” [2]. “The
expansion of primary education in India over the last decade has been phenomenal. But, by all
accounts, the expansion of the Indian education system has led to deterioration in the quality of
education” [14]. Good management plays an important role in academic achievement of schools. The
key function of school management is to supervise administration system. Enrolment of students,
appropriate curriculum, schedule the classes, allocation of teachers to each class, is also part of school](https://image.slidesharecdn.com/28ijaprr-vol1-4-01-13ritaaabi-150107034458-conversion-gate01/75/28-ijaprr-vol1-4-01-13ritaaabi-1-2048.jpg)
![IJAPRR Page 2
management. It enables all the staff in the school to contribute most efficiently to its purpose in the
performance of their duties. School management makes the necessary arrangements for teachers‟
training, refresher courses, skill up gradation seminars and orientation programmes to enhance
teachers‟ learning and expertise, better teaching methods. This helps the teacher in teaching by
making the topic more interesting and simple so that student can easily understand and learn the
subject. It promotes individual development in various ways and means, encourages mutual
confidence and understanding among teachers and students.
Most of the studies and surveys on quality of education, not only in India but world over have
shown that quality of education is influenced by several factors. Of late, some researchers opined that
though enrolments have increased, the quality of primary education in India is very poor [18]. The
increase in enrolments is greatly affected by type of school management. The present study therefore,
attempts to take a stock of the situation with respect to quality of primary education in Navi Mumbai.
The study focuses on quality of education in primary schools run under three types of managements.
Navi Mumbai is systematically designed modern city with beautiful landscapes [8]. The city can hold
up to 4.0 million population. Its present population has crossed two million mark. The majority of
schools were set-up during the last two decades to meet the school needs of rapidly growing
population of the city.
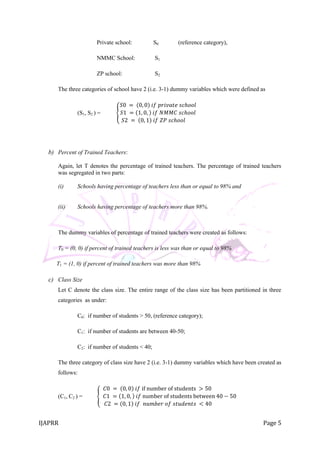
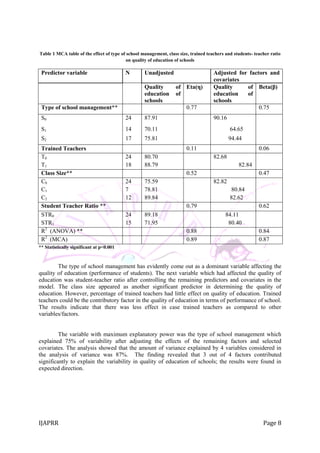
In the present paper, in order to know the contribution of each of the above selected
variables/factors, Multiple Classification Analysis1
has been used with quality of education as
dependent variable and the four variables/factors, namely, type of school management and student-
teacher ratio were also considered because of multicollinearity and in addition to this two more
variables namely percentage of trained teachers, class size as are considered as predictors. The
quality of education was assessed by percentage of marks obtained by students in final examination.
All the factors assumed to affect the quality of primary education were displayed in Figure 1.
Figure 1: Factors Affecting the Quality of Primary Education
1
Multiple Classification Analysis (MCA) can easily be explained as multiple regression with dummy
variables [20].
Quality of
education
Type of school
management
Sudent
teacher
ratio
Proportion of
trained teachers
Class size](https://image.slidesharecdn.com/28ijaprr-vol1-4-01-13ritaaabi-150107034458-conversion-gate01/85/28-ijaprr-vol1-4-01-13ritaaabi-2-320.jpg)
![IJAPRR Page 9
V. Discussion
The findings demonstrated that there was effect of student-teacher ratio, type of School
management, class size on quality of school education. The performance of ZP schools was better
than private and NMMC schools. All the four variables in an analysis of variance accounted for 87
percent of overall variance in quality of school education. The student-teacher ratio was lower in ZP
schools and higher in private and NMMC schools respectively. The factor wise effect on quality of
education was discussed below.
Type of School Management
The three types of school management cater the needs of primary school going children in
Navi Mumbai. All the ZP schools which were located in Navi Mumbai belong to Raigadh district of
Maharashtra; whereas, NMMC schools of Navi Mumbai are situated in Thane district. There are
considerable differences in both Thane and Raigadh districts. Due to this, the public schools in this
study were divided into two types of schools, namely, ZP schools and NMMC schools. Private
schools of Navi Mumbai were located in both the districts. The result showed that type of school
management was a salient governing factor which had significant effect on quality of education in
primary schools. The performance of ZP schools was better than NMMC and private schools.
It seems that ZP school management may have more effective administration as compare to
other school managements. The source of finance was not depending on fees, it was funded by
government. The requirement of teachers, and teacher‟s development policy, work load of teachers
may be the priority in these schools. There was a cooperation and inspection from management to get
desired performance. School management was accountable about responsibilities of principal, school
services and resources, student-teacher relationship, class size and professional development of
teachers. Therefore performance of ZP school may be better than other school.
Thus our study supported the findings of other researchers that student teacher ratio influence
the performance of students (see [15], [17]. The findings had clearly brought out that the students‟
performance had strong bearing on type of school management.
According to Tennessee's STAR (Student-teacher Achievement Ratio) Study in 2007, class
size and pupil teacher ratio are not the same and that arguments using these two terms as synonyms
are flawed. Class size is the number of children in a teacher‟s room daily for whom the teacher is
accountable; while the pupil-teacher ratio is generated by dividing the number of pupils in one school
by all educators, including administrators. Thus, the terminology used by the author was not in
conformity with that of the present study. The results were therefore, not comparable.
Student-teacher Ratio
The results proved that the schools having lower student-teacher ratio performed better as
compared to the performance of schools which had higher student-teacher ratio. Low student-teacher
ratio benefits students in many ways. Students may get more chance for one to one discussion with
teacher. The teacher gets to know the individual student better which allows them to identify the areas
where student needs help, also better and frequent one-to-one communication between teacher and
student. This may probably keep the students more attentive and encourage them to be more
interactive in the class. Teacher may give individual attention to each student if he/she finds that the
students are receptive and had a good grasp of the subject. As found in the present study, ZP schools
had better school performance as compared to that of NMMC and Private schools despite the fact that
ZP schools lacked in infrastructural facilities in comparison to other two types of schools. The MCA
clearly identified the student-teacher ratio to be the dominant factor responsible for students‟
performance in final examination. The reason for lower student-teacher ratio in ZP schools in Navi
Mumbai was due to the fact that during last two to three decades the growth of private schools was](https://image.slidesharecdn.com/28ijaprr-vol1-4-01-13ritaaabi-150107034458-conversion-gate01/85/28-ijaprr-vol1-4-01-13ritaaabi-9-320.jpg)
![IJAPRR Page 10
quite high (32%) in Navi Mumbai [7]. These schools made efforts to provide more infrastructure
facilities like sports, indoor games and gymnasium etc. which attracted the parents of children of a
section of the society to send their wards to these schools. Thus, mushrooming of Private schools in
almost all the parts of Navi Mumbai might have retarded the growth of school children in ZP schools
over the years. This development might have resulted in lowering the student-teacher ratio in ZP
schools. Another factor which might have further lowered the student-teacher ratio in ZP schools was
the mass recruitments of new teachers in ZP schools in recent years. In fact, the Government has
provided additional teaching posts in public schools during last few years. The average student-
teacher ratio in ZP: NMMC: Private schools were 31:64:46 respectively. The higher student-teacher
ratio in NMMC schools was due to population migration. During the last decade the population in
NMMC area had increased from 0.7 million [6] to 1.1 million [4] including urban slum population.
Average age of the population in the city was 29 years which resulted in the youth bulge of migrants
in Navi Mumbai. The numbers of NMMC schools had not increased in comparison to population
growth.
Class Size
The results of Multiple Classification Analysis further revealed that „class size‟ of primary
school had significantly influenced on the quality of education. Smaller classes are often perceived as
allowing teachers to focus more on the needs of individual students and reducing the class time they
wasted during the period of disturbance or interference, if any. Smaller class sizes may also influence
parents‟ choice when they choose schools for their children. During the past few decades, the
measures of reducing the class size are prioritized in the educational policies of different countries to
improve the quality of educational outcomes [3].
The average class size of in ZP, NMMC and Private Schools was 27, 61, and 44, respectively.
During the data collection, researcher had found some interesting explanation given by teachers and
parents that a large section of the society preferred to send their ward to English medium school. All
the public schools in Navi Mumbai had Marathi (local language) medium of instruction. Therefore,
parents who could afford the fees of private schools preferred to send their child in private schools.
All the land owners4
(villagers) who had better economic conditions shifted their children from ZP
school to private school. This could be another reason for lower class size in ZP schools. The main
factor behind large class size in NMMC schools was population growth and expanded access to
education. The shortage of schools could be reason for larger class size and this could have hampered
the quality of education.
However, the effects of differences in class size upon students‟ performance are mixed [9],
[19]. Bonesronning [5] found that the effect of class size was larger in schools with a higher
proportion of students from intact families.
A number of studies found that there was inverse relationship between average class size and
educational outcomes. They found that reducing the class size contributes to minimizing the negative
consequences of social inequality, improving students‟ achievement, enhancing the basic skills and
competencies of students in the first few years of schooling, etc. [1].
4
The land is acquired from the 95 villages for development of Navi Mumbai. As a compensation package,
12.5% share of developed land with 1.5 FSI was returned to land owners/ project affected Person (PAP).
They are legally permitted to sale/develop the plot. This has improved the economic conditions of PAPs to
great extent.](https://image.slidesharecdn.com/28ijaprr-vol1-4-01-13ritaaabi-150107034458-conversion-gate01/85/28-ijaprr-vol1-4-01-13ritaaabi-10-320.jpg)
![IJAPRR Page 11
A few studies have reported that there was positive impact of reduced class size on student‟s
achievement. [13],[16], [10], [12].
Trained Teachers
From the multiple classification analysis, it was found that the training of teachers had little
effect on the quality of education in primary schools. Proportion of trained teacher had influenced
quality of primary education (may not be statistically significant at 5% level of significance) in
schools. Majority of teachers of public schools were trained teachers. The private schools had large
proportion of untrained teachers compared to public schools. The private schools were relatively new,
had comparatively young staff. They may like to change the job due to better pay package. Private
schools were lacking in trained teachers, though the teachers in these schools may be more qualified
(graduate or post graduate) but with no formal training in education.
Many people teach, some are effective, they maintain students‟ interest in subject matter and
then a few are truly great they have spent much time in learning to be effectively. Effective teaching is
bail of bright future whereas ineffective depress the environment Teachers take help of different
methods for their proper working. These methods are pattern of teacher behaviour that recurrent,
applicable to various subject matter, characteristics of more than one teacher and relevant to learning
[11].
VI. Conclusion
To sum up, it was found that type of school management, student-teacher ratio and average
class size affected the quality of education. It has been also observed that students- teacher ratio and
class size were low in ZP schools than that of other schools. The performance of students was better
in ZP public schools. Nevertheless, despite better infrastructure and physical facilities in private
schools, the final examination results were far more impressive in ZP public schools.
VII. Acknowledgement
The author is thankful to Professor P. C. Saxena (Ex. Garware Chair Professor, Centre for
Research Methodology, Tata Institute of Social Sciences, Mumbai), for his scholarly guidance.
VIII. References
1. Achilles C. M., Finn J. D. & Pate-Bain H. (2002). Measuring Class size: Let Me Count the Ways. Educational
leadership, Vol. 59(5), pp. 24-26.
2. Banerjee A, Cole S., Duflo E. and Linden L. (2003). Improving the Quality of Education in India: Evidence from
Three Randomized Experiments; Preliminary project report in collaboration with ICICI corporation, the World
Bank, and MacArthur Foundation Network, pp 1-34.
3. Bascia N. and Fredua-Kwarteng E. (2008), Class size reduction: What the literature suggests about what works,
Toronto: Canadian Education Association, pp. 1-32.](https://image.slidesharecdn.com/28ijaprr-vol1-4-01-13ritaaabi-150107034458-conversion-gate01/85/28-ijaprr-vol1-4-01-13ritaaabi-11-320.jpg)

![[14 24]an evaluation of quality of self–financing pre-service teacher trainin...](https://cdn.slidesharecdn.com/ss_thumbnails/14-24anevaluationofqualityofselffinancingpre-serviceteachertraininginstitutionsinharyana-120527021512-phpapp01-thumbnail.jpg?width=640&height=640&fit=bounds)


![[Canada] Weegar, K., Hickey, A., Bell, T., Romano, E., & Flynn, R. (2014). Ed...](https://cdn.slidesharecdn.com/ss_thumbnails/weegark-150321202203-conversion-gate01-thumbnail.jpg?width=640&height=640&fit=bounds)


![[Israel] Rafaeli, T. (2014). Longitudinal study predictors of self-efficacy f...](https://cdn.slidesharecdn.com/ss_thumbnails/rafaelit-150315175837-conversion-gate01-thumbnail.jpg?width=640&height=640&fit=bounds)


