Download as PDF, PPTX


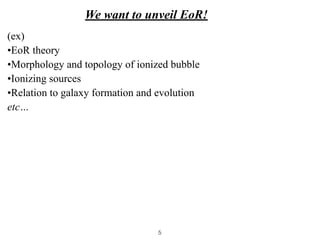
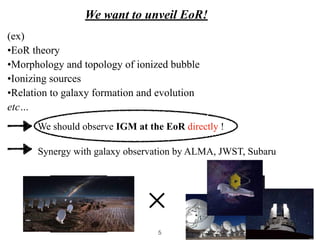
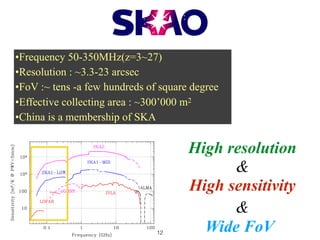
![21cm line signal
Red : cosmology Blue : astrophysics
Tb =
TS T
1 + z
(1 exp(⌧⌫))
⇠ 27xH(1 + m)
✓
H
dvr/dr + H
◆ ✓
1
T
TS
◆ ✓
1 + z
10
0.15
⌦mh2
◆1/2 ✓
⌦bh2
0.023
◆
[mK]
Brightness temperature
We can map the distribution of HI in the IGM with 21cm line
7](https://image.slidesharecdn.com/machinelearning-220606045235-25338526/85/21cm-cosmology-with-machine-learning-13-320.jpg)
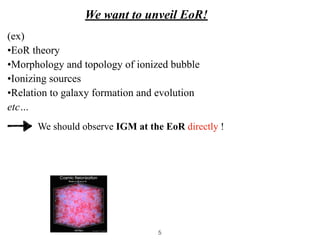
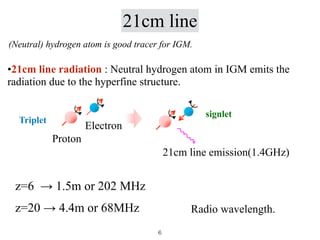
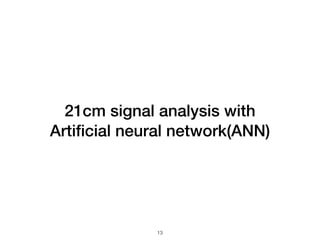
![21cm line signal
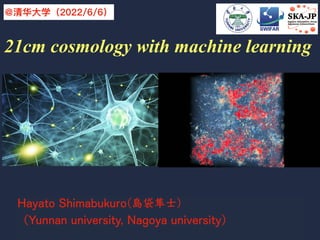
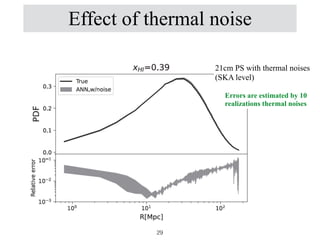
Red : cosmology Blue : astrophysics
Tb =
TS T
1 + z
(1 exp(⌧⌫))
⇠ 27xH(1 + m)
✓
H
dvr/dr + H
◆ ✓
1
T
TS
◆ ✓
1 + z
10
0.15
⌦mh2
◆1/2 ✓
⌦bh2
0.023
◆
[mK]
Brightness temperature
We can map the distribution of HI in the IGM with 21cm line
7](https://image.slidesharecdn.com/machinelearning-220606045235-25338526/85/21cm-cosmology-with-machine-learning-14-320.jpg)
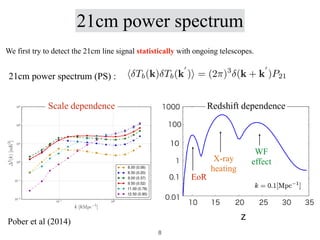
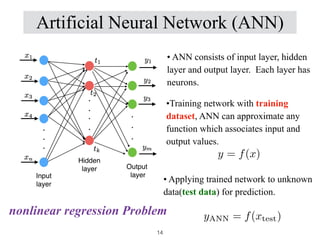
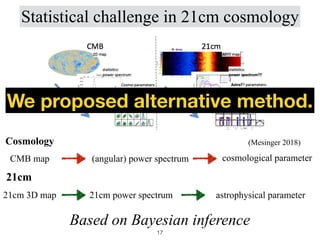
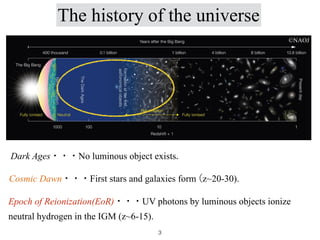
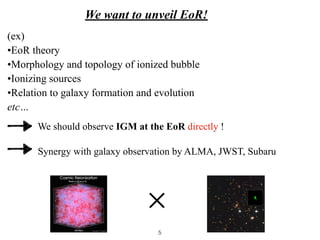
![Dataset
⇣ : the ionizing efficiency.
: the minimum viral temperature of halos producing ionizing
photons
: the mean free path of ionizing photons through the IGM
(Maximum HII bubble size)
Tvir
Rmfp
~
d = [P(k), ~
✓]
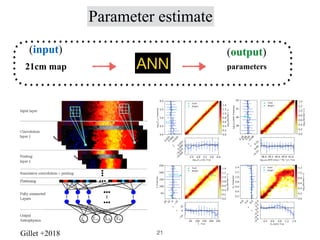
21cm power spectrum (input)
EoR parameter (output)
EoR Parameter
✓EoR = f(P21)
18](https://image.slidesharecdn.com/machinelearning-220606045235-25338526/85/21cm-cosmology-with-machine-learning-28-320.jpg)
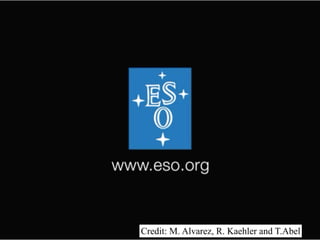
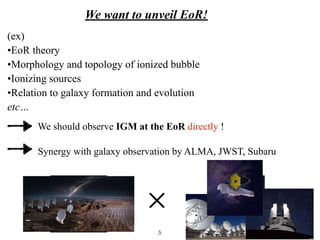
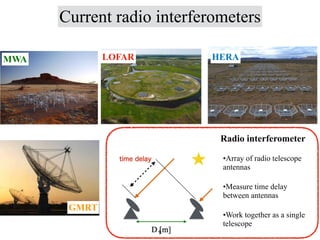
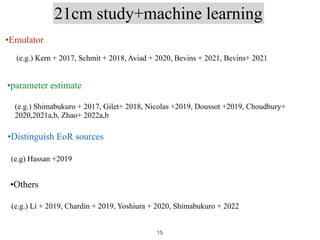
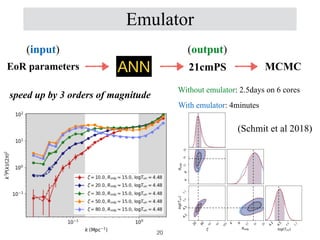
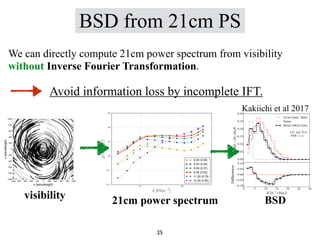
![z=9, 10, 11. PS with thermal noise and cosmic variance
Reconstructed by 21cm PS at z=9,10,11
Rmfp ⇣
Tvir
10
20
30
40
50
60
10 20 30 40 50 60
R
mfp,ANN
[Mpc]
Rmfp,true[Mpc]
10
20
30
40
50
60
10 20 30 40 50 60
ANN
true
1
10
100
1 10 100
T
vir,ANN
[K/10
3
]
Tvir,true[K/10
3
]
Red : z=9,10,11
Blue : z=9
The parameters obtained by the ANN
match true values. ANN work well !
19](https://image.slidesharecdn.com/machinelearning-220606045235-25338526/85/21cm-cosmology-with-machine-learning-29-320.jpg)

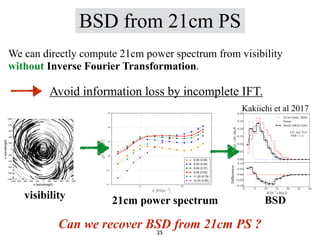
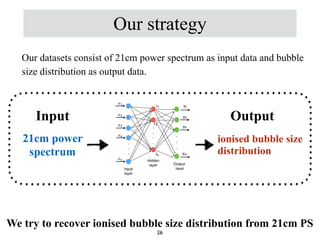
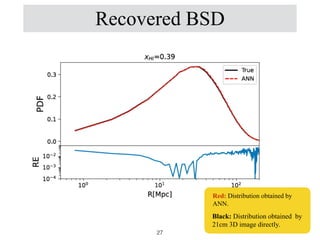
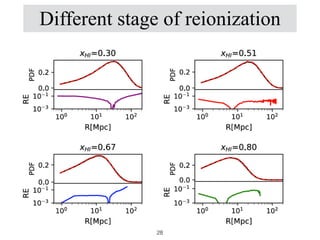


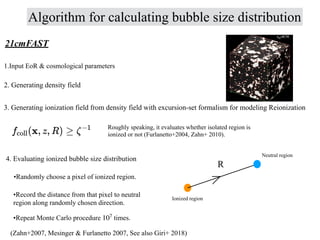
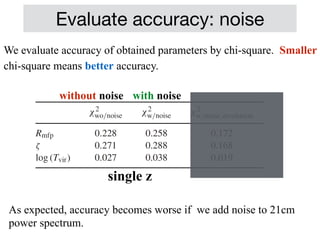
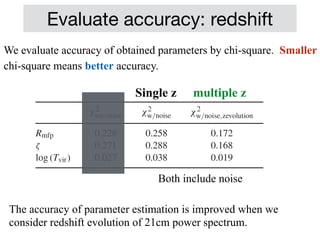

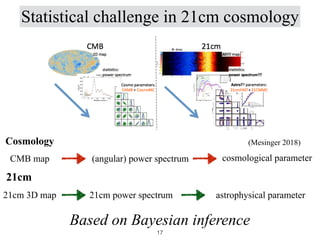
This document discusses using machine learning to analyze 21cm cosmology data from the Epoch of Reionization (EoR). It begins with background on the EoR and 21cm line signal. Current/future radio interferometers aim to detect the 21cm power spectrum to statistically map neutral hydrogen during the EoR. Machine learning techniques like artificial neural networks can be used as emulators to rapidly estimate EoR parameters from 21cm power spectra or recover ionized bubble size distributions that provide insights into the EoR. The document demonstrates how neural networks accurately recover input EoR parameters and bubble size distributions from simulated 21cm power spectrum data, highlighting their potential for 21cm cosmology analyses.