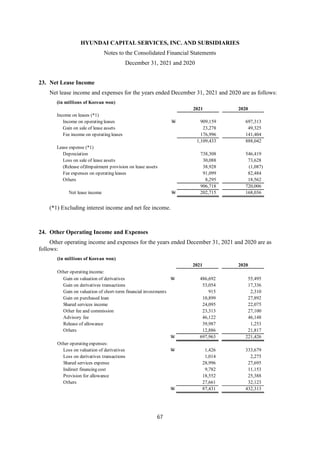
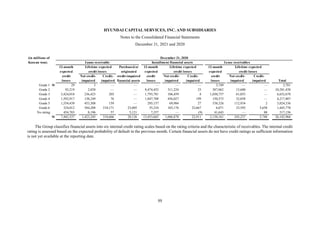
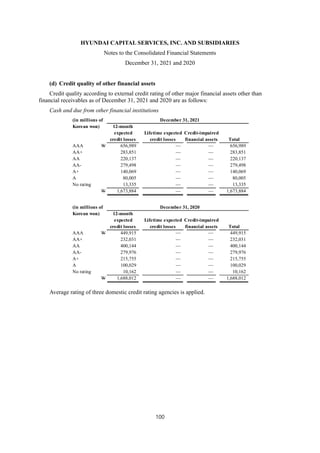
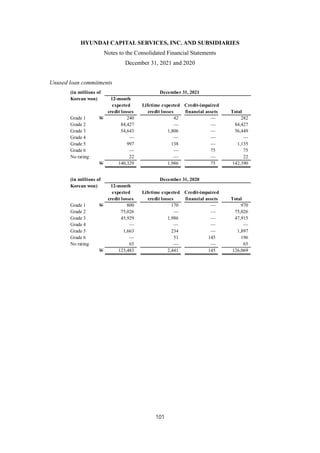
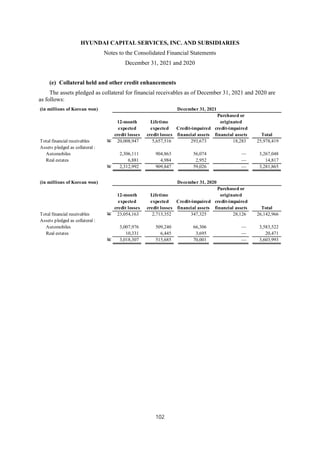
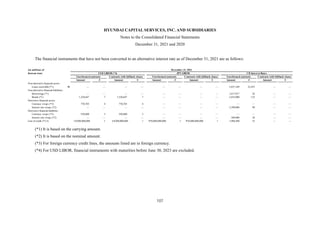
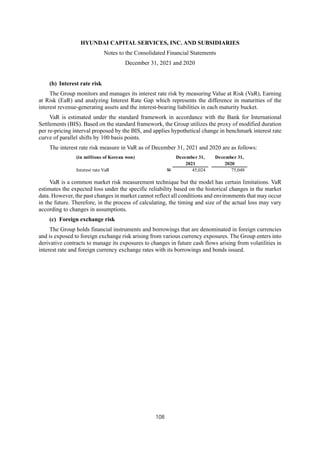
1) The document is the consolidated financial statements of Hyundai Capital Services, Inc. and its subsidiaries for the years ended December 31, 2021 and 2020. It includes the consolidated statements of financial position, comprehensive income, changes in equity, and cash flows.
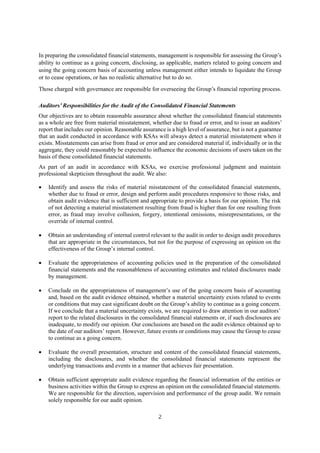
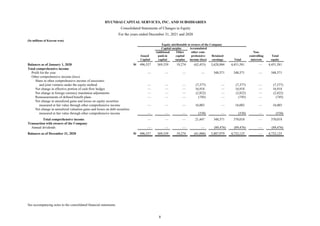
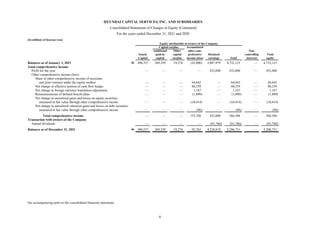
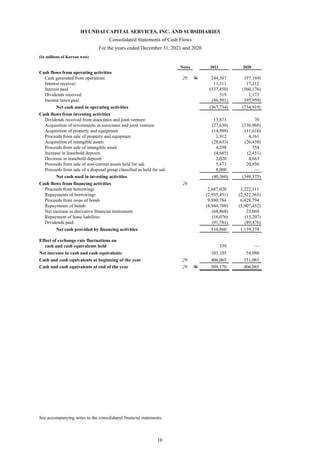
2) The consolidated financial statements present the financial position, financial performance, cash flows, and changes in equity of Hyundai Capital Services and its subsidiaries for the years ended December 31, 2021 and 2020 in accordance with Korean International Financial Reporting Standards.
3) KPMG Samjong Accounting Corp., the independent auditor, issued an unqualified opinion and determined that the consolidated financial statements present fairly in all material respects the consolidated financial position and financial performance