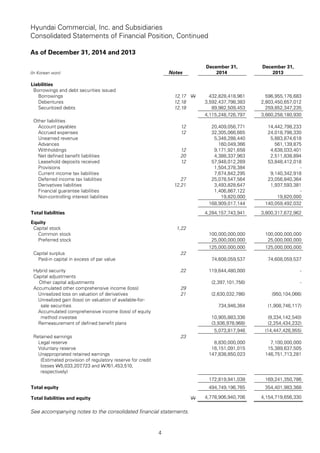
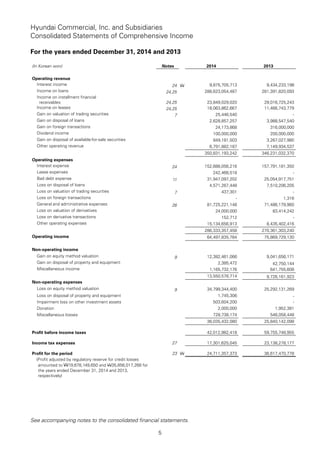
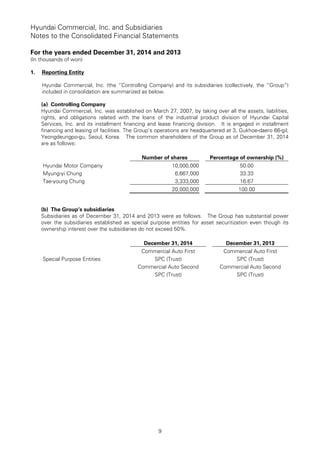
- Hyundai Commercial, Inc. and Subsidiaries consolidated financial statements for years ending December 31, 2014 and 2013 are presented.
- The consolidated statements include the consolidated statements of financial position, comprehensive income, changes in equity, and cash flows for the periods.
- An independent auditor's report is also included which provides an unmodified opinion that the consolidated financial statements present fairly the financial position and financial performance of Hyundai Commercial, Inc. and Subsidiaries for the periods ended December 31, 2014 and 2013 in accordance with Korean International Financial Reporting Standards.
CONSOLIDATED FINANCIAL STATEMENTS OF
SAMSUNG ELECTRONICS CO., LTD. AND ITS SUBSIDIARIES
INDEX TO FINANCIAL STATEMENTS
Page
Independent Auditor’s Report................................................................................................. 1 - 2
Consolidated Financial Statements
Consolidated Statements of Financial Position........................................................................... 3 - 5
Consolidated Statements of Profit or Loss.................................................................................. 6
Consolidated Statements of Comprehensive Income.................................................................. 7
Consolidated Statements of Changes in Equity.......................................................................... 8 - 11
Consolidated Statements of Cash Flows.................................................................................... 12 - 13
Notes to the Consolidated Financial Statements …................................................................... 14 - 101
1
Independent Auditor’s Report
(English Translation of a Report Originally Issued in Korean)
To the Board of Directors and Shareholders of
Samsung Electronics Co., Ltd.
We have audited the accompanying consolidated financial statements of Samsung Electronics Co., Ltd.
and its subsidiaries (collectively referred to as the "Company"), which comprise the consolidated
statements of financial position as at December 31, 2017 and 2016, and the consolidated statements of
comprehensive income and profit or loss, consolidated statements of changes in equity and consolidated
statements of cash flows for the years then ended, and notes to the consolidated financial statements,
including a summary of significant accounting policies and other explanatory information, expressed in
Korean Won.
Management’s Responsibility for the Financial Statements
Management is responsible for the preparation and fair presentation of the consolidated financial
statements in accordance with International Financial Reporting Standards as adopted by the Republic
of Korea (“Korean IFRS”), and for such internal control as management determines is necessary to
enable the preparation of financial statements that are free from material misstatement, whether due to
fraud or error.
Auditor’s Responsibility
Our responsibility is to express an opinion on the consolidated financial statements based on our audits.
We conducted our audits in accordance with Korean Standards on Auditing. Those standards require
that we comply with ethical requirements, and plan and perform the audit to obtain reasonable assurance
about whether the consolidated financial statements are free from material misstatement.
An audit involves performing procedures to obtain audit evidence about the amounts and disclosures in
the consolidated financial statements. The procedures selected depend on the auditor's judgment,
including the assessment of the ris.
1. Hyundai Commercial, Inc. and Subsidiaries
Consolidated Financial Statements
December 31, 2014 and 2013
(With Independent Auditors’ Audit Report Thereon)
2. Contents
Page
Independent Auditors’ Report 1
Consolidated Statements of Financial Position 3
Consolidated Statements of Comprehensive Income 5
Consolidated Statements of Changes in Equity 7
Consolidated Statements of Cash Flows 8
Notes to the Consolidated Financial Statements 9
3. KPMG Samjong Accounting Corp.
10th Floor, Gangnam Finance Center,
152, Teheran-ro, Gangnam-gu
Seoul, 135-984, Korea
Tel
Fax
+82 (2) 2112 0100
+82 (2) 2112 0101
www.kr.kpmg.com
Independent Auditors’ Report
Based on a report originally issued in Korean
The Board of Directors and Shareholders
Hyundai Commercial, Inc.:
We have audited the accompanying consolidated financial statements of Hyundai Commercial, Inc. and its
subsidiaries (the “Group”), which comprise the consolidated statements of financial position as of
December 31, 2014 and 2013 and the related consolidated statements of comprehensive income, changes
in equity and cash flows for the years then ended, and notes, comprising a summary of significant
accounting policies and other explanatory information.
Management’s responsibility for the consolidated financial statements
Management is responsible for the preparation and fair presentation of these consolidated financial
statements in accordance with Korean International Financial Reporting Standards, and for such internal
control as management determines is necessary to enable the preparation of consolidated financial
statements that are free from material misstatement, whether due to fraud or error.
Auditors’ responsibility
Our responsibility is to express an opinion on these consolidated financial statements based on our audits.
We conducted our audits in accordance with Korean Standards on Auditing. Those standards require that we
comply with ethical requirements and plan and perform the audit to obtain reasonable assurance about
whether the consolidated financial statements are free from material misstatement.
An audit involves performing procedures to obtain audit evidence about the amounts and disclosures in the
consolidated financial statements. The procedures selected depend on our judgment, including the
assessment of the risks of material misstatement of the consolidated financial statements, whether due to
fraud or error. In making those risk assessments, we consider internal control relevant to the entity’s
preparation and fair presentation of the consolidated financial statements in order to design audit
procedures that are appropriate in the circumstances, but not for the purpose of expressing an opinion on
the effectiveness of the entity’s internal control. An audit also includes evaluating the appropriateness of
accounting policies used and the reasonableness of accounting estimates made by management, as well as
evaluating the overall presentation of the consolidated financial statements.
We believe that the audit evidence we have obtained is sufficient and appropriate to provide a basis for our
audit opinion.
4. Opinion
In our opinion, the consolidated financial statements present fairly, in all material respect, the consolidated
financial position of the Group as at December 31, 2014 and 2013 and its consolidated financial performance
and its consolidated cash flows for the years then ended in accordance with Korean International Financial
Reporting Standards.
Other Matter
The accompanying consolidated statement of financial position of the Group as of December 31, 2013, and
the related consolidated statements of profit or loss and other comprehensive income, changes in equity
and cash flows for the year then ended, were audited by us in accordance with the previous Korean auditing
standards.
KPMG Samjong Accounting Corp.
Seoul, Korea
March 13, 2015
This report is effective as of March 13, 2015, the audit report date. Certain subsequent events or
circumstances, which may occur between the audit report date and the time of reading this report, could
have a material impact on the accompanying consolidated financial statements and notes thereto.
Accordingly, the readers of the audit report should understand that the above report has not been updated
to reflect the impact of such subsequent events or circumstances, if any.
5. Hyundai Commercial, Inc. and Subsidiaries
Consolidated Statements of Financial Position
As of December 31, 2014 and 2013
3
(In Korean won) Notes
December 31,
2014
December 31,
2013
Assets
Cash and due from banks 12
Cash and cash equivalents 30 W 232,793,098,679 280,489,429,324
Due from banks 6 9,000,000 9,000,000
232,802,098,679 280,498,429,324
Securities
Trading securities 7,12 29,063,677,042 -
Available-for-sale securities 8,12,13 46,867,767,400 52,913,346,681
Investments in associates 9 295,630,649,552 258,117,765,424
371,562,093,994 311,031,112,105
Loans receivables 10,11,12
Factoring 2,156,213,021 4,145,309,432
Allowance for doubtful accounts (2,516,085) (28,760,007)
Loans 3,525,862,060,385 3,003,414,808,167
Allowance for doubtful accounts (22,435,822,911) (21,626,634,497)
3,505,579,934,410 2,985,904,723,095
Installment financial assets 10,11,12
Auto installment financial receivables 285,343,219,344 281,894,747,216
Allowance for doubtful accounts (1,468,052,213) (1,827,954,594)
Durable goods installment financing receivables 13,487,744,235 20,071,412,811
Allowance for doubtful accounts (3,881,563) (135,964,512)
297,359,029,803 300,002,240,921
Lease receivables 10,11,12
Financial lease receivables 14 307,183,216,287 213,536,302,589
Allowance for doubtful accounts (3,233,417,504) (1,815,586,653)
303,949,798,783 211,720,715,936
Property and equipment 15
Vehicles 19,044,075 38,087,150
Fixtures and furniture 5,227,946,145 3,259,138,554
Others 370,999,664 410,999,664
5,617,989,884 3,708,225,368
Other assets
Intangible assets 16 11,983,837,035 4,474,389,846
Account receivables 12 3,565,683,526 18,117,506,853
Allowance for doubtful accounts 11 (12,214,781) (42,153,646)
Accrued revenues 12 20,948,755,918 18,277,365,728
Allowance for doubtful accounts 11 (121,887,215) (121,450,184)
Advanced payments 16,723,036,367 11,320,091,953
Prepaid expenses 6,539,358,614 3,624,203,501
Leasehold deposits 12 2,409,425,689 2,126,867,765
Derivatives assets 12,21 - 162,823,025
Other investment assets - 3,914,564,740
62,035,995,153 61,854,209,581
Total assets W 4,778,906,940,706 4,154,719,656,330
See accompanying notes to the consolidated financial statements.
6. Hyundai Commercial, Inc. and Subsidiaries
Consolidated Statements of Financial Position, Continued
As of December 31, 2014 and 2013
4
(In Korean won) Notes
December 31,
2014
December 31,
2013
Liabilities
Borrowings and debt securities issued
Borrowings 12,17 W 432,828,418,961 596,955,176,683
Debentures 12,18 3,592,437,798,383 2,803,450,657,012
Securitized debts 12,19 89,982,509,453 259,852,347,235
4,115,248,726,797 3,660,258,180,930
Other liabilities
Account payables 12 20,409,056,771 14,442,798,233
Accrued expenses 12 32,305,066,665 24,018,798,330
Unearned revenue 5,348,288,440 5,883,874,618
Advances 160,049,366 561,139,875
Withholdings 12 9,171,921,658 4,638,033,401
Net defined benefit liabilities 20 4,388,337,963 2,511,838,894
Leasehold deposits received 12 57,948,012,269 53,848,412,018
Provisions 1,504,378,384 -
Current income tax liabilities 7,674,842,295 9,140,342,918
Deferred income tax liabilities 27 25,078,547,564 23,056,840,364
Derivatives liabilities 12,21 3,493,828,647 1,937,593,381
Financial guarantee liabilities 1,406,867,122 -
Non-controlling interest liabilities 19,820,000 19,820,000
168,909,017,144 140,059,492,032
Total liabilities 4,284,157,743,941 3,800,317,672,962
Equity
Capital stock 1,22
Common stock 100,000,000,000 100,000,000,000
Preferred stock 25,000,000,000 25,000,000,000
125,000,000,000 125,000,000,000
Capital surplus 22
Paid-in capital in excess of par value 74,608,059,537 74,608,059,537
Hybrid security 22 119,644,480,000 -
Capital adjustments
Other capital adjustments (2,397,101,756) -
Accumulated other comprehensive income (loss) 29
Unrealized loss on valuation of derivatives 21 (2,630,032,786) (950,104,066)
Unrealized gain (loss) on valuation of available-for-
sale securities 734,946,364 (1,908,746,117)
Accumulated comprehensive income (loss) of equity
method investee 10,905,883,336 (9,334,142,540)
Remeasurement of defined benefit plans (3,936,978,968) (2,254,434,232)
5,073,817,946 (14,447,426,955)
Retained earnings 23
Legal reserve 8,830,000,000 7,100,000,000
Voluntary reserve 16,151,091,015 15,389,637,505
Unappropriated retained earnings 147,838,850,023 146,751,713,281
(Estimated provision of regulatory reserve for credit
losses W5,033,207,723 and W761,453,510,
respectively)
172,819,941,038 169,241,350,786
Total equity 494,749,196,765 354,401,983,368
Total liabilities and equity W 4,778,906,940,706 4,154,719,656,330
See accompanying notes to the consolidated financial statements.
7. Hyundai Commercial, Inc. and Subsidiaries
Consolidated Statements of Comprehensive Income
For the years ended December 31, 2014 and 2013
5
(In Korean won) Notes 2014 2013
Operating revenue
Interest income 24 W 9,875,705,713 9,434,233,198
Income on loans 24,25 288,623,054,487 281,391,820,093
Income on installment financial
receivables 24,25 23,849,029,020 29,016,725,243
Income on leases 24,25 18,063,862,667 11,466,743,779
Gain on valuation of trading securities 7 25,446,540 -
Gain on disposal of loans 2,628,857,257 3,988,547,540
Gain on foreign transactions 24,173,868 316,000,000
Dividend income 100,000,000 200,000,000
Gain on disposal of available-for-sale securities 849,181,503 3,267,027,980
Other operating revenue 6,791,882,187 7,149,934,537
350,831,193,242 346,231,032,370
Operating expenses
Interest expense 24 152,688,056,216 157,791,181,350
Lease expenses 242,468,518 -
Bad debt expense 11 31,947,097,202 25,054,917,751
Loss on disposal of loans 4,571,267,448 7,510,206,205
Loss on valuation of trading securities 7 437,301 -
Loss on foreign transactions - 1,316
General and administrative expenses 26 81,725,221,148 71,486,179,960
Loss on valuation of derivatives 24,000,000 83,414,242
Loss on derivative transactions 152,712 -
Other operating expenses 15,134,656,913 8,435,402,416
286,333,357,458 270,361,303,240
Operating income 64,497,835,784 75,869,729,130
Non-operating income
Gain on equity method valuation 9 12,382,461,066 9,041,656,171
Gain on disposal of property and equipment 2,385,472 42,750,144
Miscellaneous income 1,165,732,176 641,755,608
13,550,578,714 9,726,161,923
Non-operating expenses
Loss on equity method valuation 9 34,799,344,400 25,292,131,269
Loss on disposal of property and equipment 1,745,306 -
Impairment loss on other investment assets 503,604,200 -
Donation 2,000,000 1,952,381
Miscellaneous losses 728,738,174 546,058,448
36,035,432,080 25,840,142,098
Profit before income taxes 42,012,982,418 59,755,748,955
Income tax expenses 27 17,301,625,045 23,138,278,177
Profit for the period 23 W 24,711,357,373 36,617,470,778
(Profit adjusted by regulatory reserve for credit losses
amounted to W19,678,149,650 and W35,856,017,268 for
the years ended December 31, 2014 and 2013,
respectively)
See accompanying notes to the consolidated financial statements.
8. Hyundai Commercial, Inc. and Subsidiaries
Consolidated Statements of Comprehensive Income, Continued
For the years ended December 31, 2014 and 2013
6
(In Korean won) Notes 2014 2013
Other comprehensive income (loss), net of income taxes 29
Items that are or may be reclassified to profit or loss
subsequently W 21,203,789,637 (14,802,629,099)
Items that will not be reclassified to profit or loss
subsequently (1,682,544,736) (584,283,616)
19,521,244,901 (15,386,912,715)
Total comprehensive income for the period W 44,232,602,274 21,230,558,063
Earnings per share 28
Basic earnings per share W 809 1,531
Diluted earnings per share 835 1,465
See accompanying notes to the consolidated financial statements.
9. Hyundai Commercial, Inc. and Subsidiaries
Consolidated Statements of Changes in Equity
For the years ended December 31, 2014 and 2013
7
(In Korean won)
Capital
stock
Capital
surplus Hybrid security
Capital
adjustments
Accumulated
other
comprehensive
income (loss)
Retained
earnings
Total
attributable
to owners of
the Controlling
Company
Balance as of January 1, 2013 W 125,000,000,000 74,608,059,537 - - 939,485,760 137,592,534,587 338,140,079,884
Total comprehensive income (loss)
Profit for the period - - - - - 36,617,470,778 36,617,470,778
Other comprehensive income (loss)
Net unrealized gain on valuation of derivatives - - - - 964,717,915 - 964,717,915
Net unrealized loss on valuation of available-
for-sale securities - - - - (2,621,906,414) - (2,621,906,414)
Other comprehensive income of equity
method investees - - - - (13,145,440,600) 1,031,345,421 (12,114,095,179)
Remeasurement of defined benefit plans - - - - (584,283,616) - (584,283,616)
- - - - (15,386,912,715) 37,648,816,199 22,261,903,484
Transactions with owners
Annual dividends paid - - - - - (6,000,000,000) (6,000,000,000)
Balance as of December 31, 2013 W 125,000,000,000 74,608,059,537 - - (14,447,426,955) 169,241,350,786 354,401,983,368
Balance as of January 1, 2014 W 125,000,000,000 74,608,059,537 - - (14,447,426,955) 169,241,350,786 354,401,983,368
Total comprehensive income (loss)
Profit for the period - - - - - 24,711,357,373 24,711,357,373
Other comprehensive income (loss)
Net unrealized loss on valuation of derivatives - - - - (1,679,928,720) - (1,679,928,720)
Net unrealized gain on valuation of available-
for-sale securities - - - - 2,643,692,481 - 2,643,692,481
Other comprehensive income of equity
method investees - - - - 20,240,025,876 - 20,240,025,876
Remeasurement of defined benefit plans - - - - (1,682,544,736) - (1,682,544,736)
- - - - 19,521,244,901 24,711,357,373 44,232,602,274
Transactions with owners
Annual dividends paid - - - - - (17,300,000,000) (17,300,000,000)
Issuance of hybrid security - - 119,644,480,000 - - - 119,644,480,000
Interest paid to hybrid security holders - - - - - (3,832,767,121) (3,832,767,121)
Other transactions - - - (2,397,101,756) - - (2,397,101,756)
Balance as of December 31, 2014 W 125,000,000,000 74,608,059,537 119,644,480,000 (2,397,101,756) 5,073,817,946 172,819,941,038 494,749,196,765
See accompanying notes to the consolidated financial statements.
10. Hyundai Commercial, Inc. and Subsidiaries
Consolidated Statements of Cash Flows
For the years ended December 31, 2014 and 2013
8
(In Korean won) Notes 2014 2013
Cash flows from operating activities
Cash generated from (used in) operations 30 W (396,423,330,520) 16,926,012,674
Interest received 10,278,137,577 7,852,640,077
Interest paid (145,979,896,118) (153,042,772,791)
Dividend received 100,000,000 200,000,000
Income taxes paid (16,517,530,400) (20,254,938,110)
Net cash used in operating activities (548,542,619,461) (148,319,058,150)
Cash flows from investing activities
Proceeds from disposal of available-for-sale securities 21,756,263,190 8,759,859,472
Acquisition of available-for-sale securities (16,384,501,882) (44,267,937,586)
Acquisition of investments in associates (40,149,070,000) (940,000,000)
Proceeds from disposal of vehicles - 33,890,000
Proceeds from disposal of fixtures and furniture 2,973,100 11,675,000
Acquisition of fixtures and furniture (3,161,370,683) (1,815,170,606)
Acquisition of other investment assets - (28,568,880)
Disposal of other property and equipment 40,000,000 -
Acquisition of intangible assets (6,320,581,602) (376,058,800)
Increase in advanced payments (5,402,944,414) (11,522,462,304)
Decrease in leasehold deposits 31,366,720 9,303,000,928
Increase in leasehold deposits (281,917,103) (289,147,437)
Net cash used in investing activities (49,869,782,674) (41,130,920,213)
Cash flows from financing activities
Proceeds from borrowings 1,072,744,977,700 673,059,902,143
Repayments of borrowings (1,236,871,735,422) (799,773,487,454)
Issuance of debentures 2,322,141,754,502 1,250,875,138,454
Repayments of debentures (1,533,906,000,000) (876,336,940,878)
Issuance of securitized debts - 170,000,000,000
Repayments of securitized debts (169,869,837,782) (220,000,000,000)
Liquidation of derivatives - (4,711,000,000)
Payments of dividends (17,300,000,000) (6,000,000,000)
Issuance of hybrid security 119,644,480,000 -
Interest paid to hybrid security holders (3,470,465,752) -
Liquidation of preferred shares (2,397,101,756) -
Net cash provided by financing activities 550,716,071,490 187,113,612,265
Net cash decrease in cash and cash
equivalents (47,696,330,645) (2,336,366,098)
Cash and cash equivalents at beginning of period 30 280,489,429,324 282,825,795,422
Cash and cash equivalents at end of period 30 W 232,793,098,679 280,489,429,324
See accompanying notes to the consolidated financial statements.
11. Hyundai Commercial, Inc. and Subsidiaries
Notes to the Consolidated Financial Statements
For the years ended December 31, 2014 and 2013
(In thousands of won)
9
1. Reporting Entity
Hyundai Commercial, Inc. (the “Controlling Company) and its subsidiaries (collectively, the “Group”)
included in consolidation are summarized as below.
(a) Controlling Company
Hyundai Commercial, Inc. was established on March 27, 2007, by taking over all the assets, liabilities,
rights, and obligations related with the loans of the industrial product division of Hyundai Capital
Services, Inc. and its installment financing and lease financing division. It is engaged in installment
financing and leasing of facilities. The Group’s operations are headquartered at 3, Gukhoe-daero 66-gil,
Yeongdeungpo-gu, Seoul, Korea. The common shareholders of the Group as of December 31, 2014
are as follows:
Number of shares Percentage of ownership (%)
Hyundai Motor Company 10,000,000 50.00
Myung-yi Chung 6,667,000 33.33
Tae-young Chung 3,333,000 16.67
20,000,000 100.00
(b) The Group’s subsidiaries
Subsidiaries as of December 31, 2014 and 2013 were as follows. The Group has substantial power
over the subsidiaries established as special purpose entities for asset securitization even though its
ownership interest over the subsidiaries do not exceed 50%.
December 31, 2014 December 31, 2013
Special Purpose Entities
Commercial Auto First
SPC (Trust)
Commercial Auto First
SPC (Trust)
Commercial Auto Second
SPC (Trust)
Commercial Auto Second
SPC (Trust)
12. Hyundai Commercial, Inc. and Subsidiaries
Notes to the Consolidated Financial Statements
For the years ended December 31, 2014 and 2013
(In thousands of won)
10
1. Reporting Entity, Continued
(c) Condensed financial information of subsidiaries
Assets Liabilities Equity
Operating
revenue
Loss for
the year
December 31, 2014
Commercial Auto
First SPC (trust) W 50,117,158 50,096,903 20,255 5,465,260 (73,271)
Commercial Auto
Second SPC
(trust) 40,081,826 40,064,499 17,327 4,116,981 (56,871)
December 31, 2013
Commercial Auto
First SPC (trust) W 150,305,348 150,211,822 93,526 9,796,267 (131,774)
Commercial Auto
Second SPC
(trust) 110,203,346 110,129,148 74,198 5,437,737 (83,405)
13. Hyundai Commercial, Inc. and Subsidiaries
Notes to the Consolidated Financial Statements
For the years ended December 31, 2014 and 2013
(In thousands of won)
11
2. Basis of Preparation
(a) Statement of compliance
The consolidated financial statements have been prepared in accordance with the Korean International
Financial Reporting Standards (“K-IFRS”) as prescribed in the Act on External Audits of Corporations in
the Republic of Korea.
(b) Basis of measurement
The consolidated financial statements have been prepared on the historical cost basis except for the
following material items in the consolidated statement of financial position:
- Financial instruments at fair value through profit or loss are measured at fair value
- Available-for-sale financial instruments measured at fair value
- Derivative financial instruments measured at fair value
- The liability (asset) for defined benefit obligations is recognized as the present value of the defined
benefit obligation less the fair value of the plan assets.
(c) Use of estimates and judgments
The preparation of the consolidated financial statements in conformity with K-IFRS requires
management to make judgments, estimates and assumptions that affect the application of accounting
policies and the reported amounts of assets, liabilities, income and expenses. Actual results may
differ from these estimates.
Estimates and underlying assumptions are evaluated on an ongoing basis. Revisions to accounting
estimates are recognized in the period in which the estimates are revised and in any future years
affected.
Information about critical judgments in applying accounting policies that have the most significant
effect on the amounts recognized in the consolidated financial statements is included in the following
notes:
- Note 4(i) – Allowance for financial receivables
- Note 4(o) – Net defined benefit liabilities
Information about assumptions and estimation uncertainties that have a significant risk of resulting in a
material adjustment within the next financial year are included in the following notes:
- Note 11 – Allowance for Doubtful Accounts
- Note 20 – Net Defined Benefit Liabilities
- Note 31 – Commitments and Contingencies
(d) Measurement of fair values
The Group regularly reviews significant unobservable inputs and valuation adjustments. If third party
information, such as broker quotes or pricing services, is used to measure fair values, then the Group
assesses the evidence obtained from the third parties to support the conclusion that such valuations
meet the requirements of K-IFRS, including the level in the fair value hierarchy.
14. Hyundai Commercial, Inc. and Subsidiaries
Notes to the Consolidated Financial Statements
For the years ended December 31, 2014 and 2013
(In thousands of won)
12
2. Basis of Preparation, Continued
(d) Measurement of fair values, Continued
When measuring the fair value of an asset or a liability, the Group uses market observable data as far
as possible. Fair values are categorized into different levels in a fair value hierarchy based on the inputs
used in the valuation techniques as follows.
- Level 1: quoted prices (unadjusted) in active markets for identical assets or liabilities.
- Level 2: inputs other than quoted prices included in Level 1 that are observable for the asset or
liability, either directly (i.e. as prices) or indirectly (i.e. derived from prices).
- Level 3: inputs for the asset or liability that are not based on observable market data (unobservable
inputs).
If the inputs used to measure the fair value of an asset or a liability might be categorized in different
levels of the fair value hierarchy, then the fair value measurement is categorized in its entirety in the
same level of the fair value hierarchy as the lowest level input that is significant to the entire
measurement.
The Group recognizes transfers between levels of the fair value hierarchy at the end of the reporting
period during which the change has occurred.
Further information about the assumptions made in measuring fair values is included in Note 12.
15. Hyundai Commercial, Inc. and Subsidiaries
Notes to the Consolidated Financial Statements
For the years ended December 31, 2014 and 2013
(In thousands of won)
13
3. Changes in accounting policies
(a) New standards and interpretations adopted
i) Amendments to K-IFRS No. 1032, Financial Instruments: Presentation
The Group has adopted amendments to K-IFRS 1032, Offsetting Financial Assets and Financial
Liabilities, since January 1, 2014. The amendments require that financial assets and financial liabilities
are offset and the net amount is presented in the statement of financial position when an entity
currently has a legally enforceable right to set off the recognized amounts and intends either to settle
on a net basis, or to realize the asset and settle the liability simultaneously.
According to the amendments, the right to set off should not be contingent on a future event, and
legally enforceable in the normal course of business, in the event of default, and in the event of
insolvency or bankruptcy of the entity and all of the counterparties.
The entity intends to settle on a net basis, if the gross settlement mechanism has features that
eliminate or result in insignificant credit and liquidity risk, and that will process receivables and
payables in a single settlement process or cycle.
In accordance with the transitional requirements of K-IFRS 1032, the Group applied the amendments
retrospectively. The adoption of the amendments had no significant impact on the Group’s
consolidated financial statements.
ii) Amendments to K-IFRS No. 1036, Impairment of Assets
The Group has adopted amendments to K-IFRS 1036, Impairment of Assets. The amendments
clarified that the Group should disclose the recoverable amounts of the asset or cash-generating unit,
only when an impairment loss has been recognized or reversed for the asset or cash-generating unit
during the period.
The Group retrospectively applied the amendments in accordance with the transitional requirements of
K-IFRS 1036. The adoption of the amendments had no impact or no significant impact on the Group’s
consolidated financial statements.
iii) K-IFRS No. 2121, Levies
The Group has adopted K-IFRS No.2121, Levies, since January 1, 2014. The interpretation confirms
that an entity recognizes a liability for a levy when the triggering event specified in the legislation
occurs. An entity does not recognize a liability at an earlier date, even if it has no realistic opportunity
to avoid the triggering event. If a levy is only payable once a specified amount has been reached,
then no liability is recognized until this ‘minimum threshold’ is reached. The same recognition
principles apply in the interim financial statements as in the annual financial statements, even if this
results in uneven charges over the course of the year. The adoption of the interpretation had no
significant impact on the Group’s consolidated financial statements.
16. Hyundai Commercial, Inc. and Subsidiaries
Notes to the Consolidated Financial Statements
For the years ended December 31, 2014 and 2013
(In thousands of won)
14
4. Significant Accounting Policies
Significant accounting policies applied consolidated financial statements preparing according to K-IFRS
are following, and consolidated financial statements as of current and prior that is for period presented
for comparative was prepared by the same accounting policies.
Some amount of statement of comprehensive income for prior period presented for comparative are
changed some item’s presentation and classified to reflect the changes related other comprehensive
income items presentation method standard.
(a) Consolidation
i) Subsidiaries
The Group controls subsidiaries when it is exposed, or has rights, to variable returns from its
involvement with the subsidiaries and has the ability to affect those returns through its power over the
subsidiaries. The financial statements of subsidiaries are included in the consolidated financial
statements from the date that control commences until the date that control ceases. If a subsidiary of
the Group uses accounting policies other than those adopted in the consolidated financial statements
for like transactions and events in similar circumstances, appropriate adjustments are made to its
financial statements in preparing the consolidated financial statements.
ii) Intra-group transactions
Intra-group balances and transactions, and any unrealized income and expenses arising from intra-group
transactions, are eliminated in preparing the consolidated financial statements. Intra-group losses are
recognized as expense if intra-group losses indicate an impairment that requires recognition in the
consolidated financial statements.
iii) Non-controlling interests
Non-controlling interests in a subsidiary are accounted for separately from the parent’s ownership
interests in a subsidiary. Each component of net profit or loss and other comprehensive income is
attributed to the owners of the parent and non-controlling interest holders, even when the allocation
reduces the non-controlling interest balance below zero.
iv) Changes in ownership interests in a subsidiary
Changes in ownership interests in a subsidiary that do not result in a loss of control, such as the
subsequent purchase or sale by a parent of a subsidiary’s equity instruments, are accounted for as
equity transactions in capital adjustments. Adjustments to non-controlling interests are based on a
proportionate amount of net asset of the subsidiary. No adjustments are made to goodwill and no
gain or loss is recognized in profit or loss. The difference between the consideration and the
adjustments made to non-controlling interest is recognized directly in equity attributable to the owners
of the Group.
17. Hyundai Commercial, Inc. and Subsidiaries
Notes to the Consolidated Financial Statements
For the years ended December 31, 2014 and 2013
(In thousands of won)
15
4. Significant Accounting Policies, Continued
(b) Associates
An associate is an entity over which the Group has significant influence and that is neither a subsidiary
nor an interest in a joint venture. Significant influence is the power to participate in the financial and
operating policy decisions of the investee but not have control or joint control over these policies.
Significant influence is generally presumed to exist when the Group holds 20% or more, but less than
50%, of the voting rights.
Under the equity method, an investment in an associate is initially recognized in the consolidated
statements of financial position at cost and adjusted thereafter to recognize the Group’s share of the
profit or loss and other comprehensive income of the associate. When the Group’s share of losses of
an associate exceeds the Group’s interest in that associate (which includes any long-term interests that,
in substance, form part of the Group’s net investment in the associate), the Group discontinues
recognizing its share of further losses. Additional losses are recognized only to the extent that the
Group has incurred legal or constructive obligations or made payments on behalf of the associate.
If an associate uses accounting policies different from those of the Group for like transactions and
events in similar circumstances, appropriate adjustments are made to its financial statements in
applying the equity method.
When the Group’s share of losses exceeds its interest in an equity accounted investee, the carrying
amount of that interest, including any long-term investments, is reduced to nil and the recognition of
further losses is discontinued except to the extent that the Group has an obligation or has to make
payments on behalf of the investee for further losses.
(c) Cash and cash equivalents
Cash and cash equivalents comprise balances with less than three months’ maturity from the date of
acquisition, including cash on hand, deposits held at call with banks and other short-term highly liquid
investments with original maturities of three months or less.
(d) Non-derivative financial assets
Non-derivative financial assets are classified into the following measurement categories: financial
assets at fair value through profit or loss, held-to-maturity investments, loans and receivables and
available-for-sale financial assets, all of which are initially recognized on the date at which the Group
becomes a party to the contractual provisions of the instrument.
A financial asset is measured initially at its fair value plus, for an item not at fair value through profit or
loss, transaction costs that are directly attributable to its acquisition.
i) Financial assets at fair value through profit or loss
Financial assets are classified as at fair value through profit or loss when the financial asset is either
held for trading or is designated at fair value through profit or loss. Financial assets at fair value
through profit or loss are measured at fair value upon initial recognition and changes therein are
recognized in profit or loss. Upon initial recognition, attributable transaction costs are recognized in
profit or loss as incurred.
ii) Held-to-maturity investments
If the non-derivative assets have a fixed maturity with fixed or determinable payments, and the Group
has the positive intent and ability to hold them until maturity, then such financial assets are classified as
held-to-maturity. Subsequent to initial recognition, held-to-maturity financial assets are measured at
amortized cost using the effective interest rate method.
18. Hyundai Commercial, Inc. and Subsidiaries
Notes to the Consolidated Financial Statements
For the years ended December 31, 2014 and 2013
(In thousands of won)
16
4. Significant Accounting Policies, Continued
(d) Non-derivative financial assets, Continued
iii) Loans and receivables
Loans and receivables are financial assets with fixed or determinable payments that are not quoted in
an active market. Subsequent to initial recognition, loans and receivables are measured at amortized
cost using the effective interest method.
iv) Available-for-sale financial assets
Available-for-sale financial assets are those non-derivative financial assets that are designated as
available-for-sale or are not classified as financial assets at fair value through profit or loss, held-to-
maturity investments or loans and receivables. Subsequent to initial recognition, they are measured at
fair value, with changes in fair value, net of any tax effect, recorded in other comprehensive income in
equity. Investments in equity instruments that do not have a quoted market price in an active market
and whose fair value cannot be reliably measured and derivatives those are linked to and must be
settled by delivery of such unquoted equity instruments are measured at cost.
v) Derecognition of financial assets
The Group de-recognizes a financial asset when the contractual rights to the cash flows from the asset
expire, or it transfers the rights to receive the contractual cash flows of the financial asset in a
transaction in which substantially all the risks and rewards of ownership of the financial asset are
transferred. If the Group retains substantially all the risks and rewards of ownership of the transferred
financial assets, the Group continues to recognize the transferred financial assets and recognizes
financial liabilities for the consideration received.
vi) Offsetting between financial assets and financial liabilities
Financial assets and financial liabilities are offset and the net amount is presented in the consolidated
statement of financial position only when the Group currently has a legally enforceable right to offset
the recognized amounts, and there is the intention to settle on a net basis or to realize the asset and
settle the liability simultaneously.
19. Hyundai Commercial, Inc. and Subsidiaries
Notes to the Consolidated Financial Statements
For the years ended December 31, 2014 and 2013
(In thousands of won)
17
4. Significant Accounting Policies, Continued
(e) Derivative financial instruments
Derivatives are initially recognized at fair value. Subsequent to initial recognition, derivatives are
measured at fair value, and changes therein are accounted for as described below.
1) Hedge accounting
The Group holds various derivative financial instruments, such as currency swaps and interest rate
swaps, etc., to hedge its foreign currency and interest rate risk exposures.
On initial designation of the hedge, the Group formally documents the relationship between the
hedging instruments and hedged items, including the risk management objectives and strategy in
undertaking the hedge transaction, together with the methods that will be used to assess the
effectiveness of the hedging relationship.
i) Fair value hedge
Changes in the fair value of a derivative hedging instrument designated as a fair value hedge are
recognized in profit or loss. The gain or loss from remeasuring the hedging instrument at fair value for
a derivative hedging instrument and the gain or loss on the hedged item attributable to the hedged risk
are recognized in profit or loss in the same line item of the consolidated statement of comprehensive
income. The Group discontinues fair value hedge accounting if the hedging instrument expires or is
sold, terminated or exercised, or if the hedge no longer meets the criteria for hedge accounting. Any
adjustment arising from gain or loss on the hedged item attributable to the hedged risk is amortized to
profit or loss from the date the hedge accounting is discontinued.
ii) Cash flow hedge
When a derivative is designated to hedge the variability in cash flows attributable to a particular risk
associated with a recognized asset or liability or a highly probable forecasted transaction that could
affect profit or loss, the effective portion of changes in the fair value of the derivative is recognized in
other comprehensive income, net of tax, and presented in the hedging reserve in equity. Any
ineffective portion of changes in the fair value of the derivative is recognized immediately in profit or
loss.
If the hedging instrument no longer meets the criteria for hedge accounting, expires or is sold,
terminated, exercised, or the designation is revoked, then hedge accounting is discontinued
prospectively. The cumulative gain or loss on the hedging instrument that has been recognized in
other comprehensive income is reclassified to profit or loss in the periods during which the forecasted
transaction occurs. If the forecasted transaction is no longer expected to occur, then the balance in
other comprehensive income is recognized immediately in profit or loss.
2) Embedded derivative instruments
Embedded derivatives are separated from the host contract and accounted for separately only if the
following criteria has been met: (a) the economic characteristics and risks of the host contract and the
embedded derivatives are not clearly and closely related to a separate instrument with the same terms
as the embedded derivative that would meet the definition of a derivative, and (b) the hybrid (combined)
instrument is not measured at fair value through profit or loss. Changes in the fair value of separable
embedded derivatives are recognized immediately in profit or loss.
3) Other derivative instruments
Changes in the fair value of other derivative financial instrument not designated as a hedging
instrument are recognized immediately in profit or loss.
20. Hyundai Commercial, Inc. and Subsidiaries
Notes to the Consolidated Financial Statements
For the years ended December 31, 2014 and 2013
(In thousands of won)
18
4. Significant Accounting Policies, Continued
(f) Impairment of financial assets
A financial asset not carried at fair value through profit or loss is assessed at each reporting date to
determine whether there is objective evidence that it is impaired. A financial asset is impaired if
objective evidence indicates that a loss event has occurred after the initial recognition of the asset, and
that the loss event had a negative effect on the estimated future cash flows of that asset that can be
estimated reliably. However, losses expected as a result of future events, regardless of likelihood,
are not recognized.
Objective evidence that a financial asset is impaired includes, but is not limited to, the following events:
i) Assets carried at amortized cost
An impairment loss in respect of assets carried at amortized cost measured at amortized cost is
calculated as the difference between its carrying amount and the present value of the estimated future
cash flows discounted at the asset’s original effective interest rate and is recognized in profit or loss.
Interest on the impaired asset continues to be recognized through the unwinding of the discount.
When a subsequent event causes the amount of impairment loss to decrease, the decrease in
impairment loss is reversed through profit or loss.
ii) Available-for-sale financial assets
When a decline in the fair value of an available-for-sale financial asset has been recognized in other
comprehensive income and there is objective evidence that the asset is impaired, the cumulative loss
that had been recognized in other comprehensive income is reclassified from equity to profit or loss as
a reclassification adjustment even though the financial asset has not been derecognized. Impairment
losses recognized in profit or loss for an investment in an equity instrument classified as available-for-
sale are not reversed through profit or loss. If, in a subsequent period, the fair value of a debt
instrument classified as available-for-sale increases and the increase can be objectively related to an
event occurring after the impairment loss was recognized in profit or loss, the impairment loss is
reversed, with the amount of the reversal recognized in profit or loss.
(g) Revenue recognition
The Group recognizes capital lent to customers as loans receivables. Installment financial capital paid
by the Group to manufacturers or sellers on behalf of customers is recognized as installment financial
assets. Financial lease receivables classified as financial leases are recognized as lease receivables.
The expected future cash flows from loans receivables, installment financial assets and lease
receivables (“financial receivables”) described above are amortized under the effective interest method
over the period of the financial receivables being used by customers.
(h) Deferral of loan origination fee and loan origination cost
Loan origination fee, which is processing fee in relation to the loan origination process such as upfront
fee, is deferred and deducted from the loan account, adjusted over the life of the loan based on the
effective interest rate method. Loan origination cost, which relates to activities performed by the
lender such as soliciting potential borrowers, is deferred and added to the loan account, adjusted over
the life of the loan based on the effective interest rate method when the future economic benefit in
connection with the cost incurred can be identified on a per loan basis.
21. Hyundai Commercial, Inc. and Subsidiaries
Notes to the Consolidated Financial Statements
For the years ended December 31, 2014 and 2013
(In thousands of won)
19
4. Significant Accounting Policies, Continued
(i) Allowance for financial receivables
i) Calculation of allowance for doubtful accounts
The Group recognizes the impairment of receivables as an allowance for doubtful accounts. It is
based on the impairment estimates made through impairment assessment of receivables carried at
amortized cost. Allowance for doubtful account consists of impairments related to individually
material financial receivables and collective assessment for impairment incurred in homogeneous
assets.
Individually material receivables undertake the individual assessment of the difference between the
assets’ carrying amount and the present value of estimated future cash flows. Unimpaired assets
from individual assessments and individually immaterial assets undertake the collective assessment
classified by asset groups that have analogous risk attributes. The Group uses statistical model in the
collective assessment based on the expected probability of default, periodic collect amounts, loss-given
default based on the past losses, loss emergence period, and management’s decision about the
current economy and credit circumstance. The material factors used in statistical model for the
collective assessment are evaluated to compare with actual data regularly.
The amount of impairment loss is reflected in allowance for doubtful accounts as profit or loss.
ii) Write-off policy
The Group writes off the doubtful receivables when the assets are deemed unrecoverable. This
decision considers the information about significant changes of financial position such that a borrower
or an obligor is in default, or the amount recoverable from security is not enough. Write-off decision of
standard small loan is generally made based on the delinquent status of loan.
22. Hyundai Commercial, Inc. and Subsidiaries
Notes to the Consolidated Financial Statements
For the years ended December 31, 2014 and 2013
(In thousands of won)
20
4. Significant Accounting Policies, Continued
(j) Leases
i) Classification
The Group classifies and accounts for leases as either a finance or operating lease, depending on the
terms. Leases where the lessee assumes substantially all of the risks and rewards of ownership are
classified as finance leases. All other leases are classified as operating leases.
The lease arrangement classified as a finance lease is where: ① the lease transfers ownership of the
asset to the lessee by the end of the lease term, the lessee has the option to purchase the asset at②
a price that is expected to be sufficiently lower than the fair value at the date the option becomes
exercisable for it to be reasonably certain, at the inception of the lease, that the option will be exercised,
the lease term is for the major part of the economic life of the asset e③ ven if the title is not
transferred, at the inception of the lease the present value of the minimum lease payments amounts④
to at least substantially all of the fair value of the leased asset, or the leased assets are of such a⑤
specialized nature that only the lessee can use them without major modifications.
Minimum lease payments include that part of the residual value that is guaranteed by the lessee, by a
party related to the lessee or by a third party unrelated to the Group that is financially capable of
discharging the obligation under the guarantee.
ii) Finance leases
Where the Group has substantially all the risks and rewards of ownership, lease of property, and
equipment are classified as finance lease. An amount equal to the net investment in the lease is
presented as a receivable. Expenses that are incurred with regard to the lease contract made but not
executed at the date of the statement of financial position are accounted for as prepaid leased assets
and are classified as finance lease receivables at the inception of the lease. Lease receivables include
amounts such as commissions, legal fees, and internal costs that are incremental and directly
attributable to negotiation and arranging a lease. Each lease payment is allocated between principal
and finance income. Financial income on an uncollected part of net investment shall be allocated to
each period during the lease term so as to produce a constant periodic rate of interest on the remaining
balance of the liability.
23. Hyundai Commercial, Inc. and Subsidiaries
Notes to the Consolidated Financial Statements
For the years ended December 31, 2014 and 2013
(In thousands of won)
21
4. Significant Accounting Policies, Continued
(k) Property and equipment
Property and equipment are initially measured at cost and after initial recognition, are carried at cost
less accumulated depreciation and accumulated impairment losses. The cost of property and
equipment includes expenditures arising directly from the construction or acquisition of the asset, any
costs directly attributable to bringing the asset to the location and condition necessary for it to be
capable of operating in the manner intended by management and the initial estimate of the costs of
dismantling and removing the item and restoring the site on which it is located.
The cost of replacing a part of an item of property or equipment is recognized in the carrying amount of
the item if it is probable that the future economic benefits embodied within the part will flow to the
Group and its cost can be measured reliably. The carrying amount of the replaced cost is
derecognized. The cost of the day to day servicing of property and equipment are recognized in profit
or loss as incurred. Property and equipment are depreciated on a straight-line basis over the
estimated useful lives, which most closely reflect the expected pattern of consumption of the future
economic benefits embodied in the asset. The estimated useful lives for the current and comparative
years are as follows:
Description Depreciation method Useful lives
Vehicles Straight-line 4 years
Fixtures and furniture Straight-line 4 years
Works of art classified under other tangible assets are not amortized due to their indefinite useful life in
nature.
The assets’ residual values and useful lives are reviewed, and adjusted if appropriate, at the end of
each reporting period. An asset’s carrying amount is written down immediately to its recoverable
amount if the carry amount is greater than its estimated recoverable amount. Gains and losses on
disposals are determined by comparing the proceeds with the carrying amount, and recognized within
other operating income (expenses) in the consolidated statement of comprehensive income.
24. Hyundai Commercial, Inc. and Subsidiaries
Notes to the Consolidated Financial Statements
For the years ended December 31, 2014 and 2013
(In thousands of won)
22
4. Significant Accounting Policies, Continued
(l) Intangible assets
Intangible assets are measured initially at cost and, subsequently, are carried at cost less accumulated
amortization and accumulated impairment losses.
Amortization of intangible assets is calculated on a straight-line basis over the estimated useful lives of
intangible assets from the date that they are available for use. The residual value of intangible assets
is zero.
Descriptions Amortization method Useful lives
Development Straight-line 5 years
Software Straight-line 4 years
Other intangible assets Straight-line 5 years
However, as there are no foreseeable limits to the periods over which club memberships are expected
to be available for use, this intangible asset is determined as having indefinite useful lives and not
amortized.
i) Research and development
Expenditures on research activities, undertaken with the prospect of gaining new scientific or technical
knowledge and understanding, are recognized in profit or loss as incurred. Development expenditures
are capitalized only if development costs can be measured reliably, the product or process is
technically and commercially feasible, future economic benefits are probable, and the Group intends to
and has sufficient resources to complete development and to use or sell the asset. Other
development expenditures are recognized in profit or loss as incurred.
ii) Subsequent expenditures
Subsequent expenditures are capitalized only when they increase the future economic benefits
embodied in the specific asset to which it relates. All other expenditures, including expenditures on
internally generated goodwill and brands, are recognized in profit or loss as incurred.
(m) Impairment of non-financial assets
Assets that have an indefinite useful life are not subject to amortization and are tested annually for
impairment. Assets that are subject to amortization are reviewed for impairment whenever events or
changes in circumstances indicate that the carrying amount may not be recoverable. An impairment
loss is recognized for the amount by which the asset’s carrying amount exceeds its recoverable
amount. The recoverable amount is the higher of the asset’s fair value less costs to sell and value in
use. For the purposes of assessing impairment, assets are grouped at the lowest levels for which
there are separately identifiable cash flows (cash generating units). Non-financial assets that are
subject to amortization suffered impairment are viewed for possible reversal of the impairment at each
reporting date.
25. Hyundai Commercial, Inc. and Subsidiaries
Notes to the Consolidated Financial Statements
For the years ended December 31, 2014 and 2013
(In thousands of won)
23
4. Significant Accounting Policies, Continued
(n) Non-derivative financial liabilities
The Group classifies non-derivative financial liabilities into financial liabilities at fair value through profit
or loss or other financial liabilities in accordance with the substance of the contractual arrangement and
the definitions of financial liabilities. The Group recognizes financial liabilities in the consolidated
statement of financial position when the Group becomes a party to the contractual provisions of the
financial liability.
i) Financial liabilities at fair value through profit or loss
Financial liabilities at fair value through profit or loss include financial liabilities held for trading or
designated as such upon initial recognition. Subsequent to initial recognition, financial liabilities at fair
value through profit or loss are measured at fair value, and changes therein are recognized in profit or
loss. Upon initial recognition, transaction costs that are directly attributable to the acquisition are
recognized in profit or loss as incurred.
ii) Other financial liabilities
Non-derivative financial liabilities other than financial liabilities at fair value through profit or loss are
classified as other financial liabilities. At the date of initial recognition, other financial liabilities are
measured at fair value minus transaction costs that are directly attributable to the acquisition.
Subsequent to initial recognition, other financial liabilities are measured at amortized cost using the
effective interest method.
The Group derecognizes a financial liability from the consolidated statement of financial position when
it is extinguished (i.e., when the obligation specified in the contract is discharged, cancelled or expires).
(o) Net defined benefit liabilities
The Group operates a defined benefit plan. A defined benefit plan is a post-employment benefit plan
other than a defined contribution plan.
The liability recognized in the statement of financial position in respect of defined benefit pension plans
is the present value of the defined benefit obligation at the end of reporting period less the fair value of
plan assets, together with adjustments for unrecognized past-service costs. The defined benefit
obligation is calculated annually by independent actuaries using the projected unit credit method. The
present value of the defined benefit obligation is determined by discounting the estimated future cash
outflows using interest rates of high-quality corporate bonds that are denominated in the currency in
which the benefits will be paid, and that have terms to maturity approximating to the terms of the
related pension obligation. Actuarial gains and losses arising from experience adjustments and
changes in actuarial assumptions are recognized in other comprehensive income or loss in the period
in which they arise.
26. Hyundai Commercial, Inc. and Subsidiaries
Notes to the Consolidated Financial Statements
For the years ended December 31, 2014 and 2013
(In thousands of won)
24
4. Significant Accounting Policies, Continued
(p) Provisions and contingent liabilities
When there is a probability that an outflow of economic benefits will occur due to a present obligation
resulting from a present legal or as a result of past events, and whose amount is reasonably estimable,
a corresponding amount of provision is recognized in the consolidated financial statements.
Provisions are the best estimate of the expenditure required to settle the present obligation that
consider the risks and uncertainties inevitably surround many events and circumstances at the
reporting date. Where the effect of the time value of money is material, the amount of a provision is
the present value of the expenditure expected to be required to settle the obligation.
Provisions are reviewed at the end of each reporting period and adjusted to reflect the current best
estimates. If it is no longer probable that an outflow of resources embodying economic benefits will
be required to settle the obligation, the provision is reversed.
A possible obligation that arises from past events and whose existence will be confirmed only by the
occurrence or non-occurrence of uncertain future events, or a present obligation that arises from past
events but is not certain to occur, or cannot be reliably estimated, a disclosure regarding the contingent
liability is made in the notes to the consolidated financial statements.
(q) Foreign currency
Items included in the financial statements of each of the Group’s entities are measured using the
currency of the primary economic environment in which the entity operates (the “functional
currency”). The consolidated financial statements are presented in Korean won, which is the Group’s
functional currency.
Foreign currency transactions are translated into the functional currency using the exchange rates
prevailing at the dates of the transactions or valuation where items are remeasured. Foreign
exchange gains and losses resulting from the settlement of such transactions and from the translation
at year-end exchange rates of monetary assets and liabilities denominated in foreign currencies are
recognized in the statement of comprehensive income, except when deferred in other comprehensive
income as qualifying cash flow hedges.
(r) Equity
Ordinary shares are classified as equity. Incremental costs directly attributable to the issuance of
ordinary shares and share options are recognized as a deduction from equity, net of any tax effects.
Preference share capital is classified as equity if it is non-redeemable, or redeemable only at the
Group’s option, and any dividends are discretionary. Dividends thereon are recognized as
distributions within equity upon approval by the Group’s shareholders.
27. Hyundai Commercial, Inc. and Subsidiaries
Notes to the Consolidated Financial Statements
For the years ended December 31, 2014 and 2013
(In thousands of won)
25
4. Significant Accounting Policies, Continued
(s) Income tax
Income tax expense comprises current and deferred tax. Current tax and deferred tax are recognized
in profit or loss except to the extent that it relates to a business combination, or items recognized
directly in equity or in other comprehensive income.
i) Current income tax
Current income tax is the expected tax payable or receivable on the taxable profit or loss for the year,
using tax rates enacted or substantively enacted at the end of the reporting period and any adjustment
to tax payable in respect of previous years. The taxable profit is different from the accounting profit
for the period since the taxable profit is calculated excluding the temporary differences, which will be
taxable or deductible in determining taxable profit (tax loss) of future periods, and non-taxable or non-
deductible items from the accounting profit.
ii) Deferred income tax
Deferred income tax is recognized, using the liability method, on temporary differences arising
between the tax bases of assets and liabilities and their carrying amounts in the consolidated financial
statements.
However, deferred tax assets and liabilities are not recognized if they arise from initial recognition of an
asset or liability in a transaction other than a business combination that at the time of the transaction
affects neither accounting nor taxable profit or loss. Deferred income tax is determined using tax
rates and laws that have been enacted or substantially enacted by the statement of financial position
date and are expected to apply when the related deferred income tax asset is realized or the deferred
income tax liability is settled. Deferred income tax assets are recognized only to the extent that it is
probable that future taxable profit will be available against which the temporary differences can be
utilized.
The carrying amount of a deferred tax asset is reviewed at the end of each reporting period and
reduces the carrying amount to the extent that it is no longer probable that sufficient taxable profit will
be available to allow the benefit of part or all of that deferred tax asset to be utilized.
Deferred income tax is provided on temporary differences arising on investments in subsidiaries,
associates and joint ventures except for deferred income tax liability where the timing of the reversal
of the temporary difference is controlled by the Group and it is probable that the temporary difference
will not reverse in the foreseeable future.
Deferred income tax assets and liabilities are offset when there is a legally enforceable right to offset
current tax assets against current tax liabilities and when the deferred income taxes assets and
liabilities relate to income taxes levied by the same taxation authority on either the same taxable entity
or different taxable entities where there is an intention to settle the balances on a net basis.
28. Hyundai Commercial, Inc. and Subsidiaries
Notes to the Consolidated Financial Statements
For the years ended December 31, 2014 and 2013
(In thousands of won)
26
4. Significant Accounting Policies, Continued
(t) Earnings per share
The Group presents its basic and diluted earnings per ordinary share in consolidated comprehensive
statement of income. Basic earnings per share amounts are calculated by dividing net profit for the
period attributable to ordinary shareholders of the Group by the weighted average number of ordinary
shares outstanding during the period. Diluted earnings per share amounts are calculated by adjusting
net profit attributable to ordinary shareholders of the Group for basic earnings considered potential
ordinary shares with dilution effect and weighted average number of ordinary shares outstanding.
(u) Dividend distribution
Dividend distribution to the Group’s shareholders is recognized as a liability in the financial statements
in the period in which the dividends are approved by the Group’s shareholders.
(v) Approval of financial statements
The Group’s consolidated financial statements were approved by the board of directors on February
26, 2015 and will be reported at the annual meeting of shareholders on March 27, 2015.
29. Hyundai Commercial, Inc. and Subsidiaries
Notes to the Consolidated Financial Statements
For the years ended December 31, 2014 and 2013
(In thousands of won)
27
5. Segment Reporting
The Group is engaged in limited financial business (Loans, Installment Finance, and Lease, etc.) under
the Specialized Credit Financial Business Law in Korea. Therefore, segment reporting is not disclosed
as the Group’s own business is comprised of single operating segment.
6. Restricted Financial Instruments
Restricted financial instruments as of December 31, 2014 and 2013 are as follows:
Type Depository 2014 2013 Restriction
Due from banks
Kookmin Bank
and 2 others W 9,000 9,000
Guarantee deposit
for account opening
7. Trading Securities
Trading securities as of December 31, 2014 and 2013 are as follows:
(*) For liquidity management, the Group holds short-term investments in excess of immediate funding
needs. These excess funds are invested in short-term, highly liquid financial instruments, which
provide liquidity for the Group’s short-term funding needs and flexibility in the use of other funding
sources.
Debt securities as of December 31, 2014 and 2013 are as follows:
Carrying value
Acquisition cost 2014 2013
Commercial papers W 29,038,668 29,063,677 -
Gain and loss from trading securities recognized in profit or loss as of December 31, 2014 and 2013 are
as follows:
Book value
2014 2013
Gain on valuation of trading securities W 25,446 -
Loss on valuation of trading securities 437 -
2014 2013
Trading securities (*)
Debt securities W 29,063,677 -
30. Hyundai Commercial, Inc. and Subsidiaries
Notes to the Consolidated Financial Statements
For the years ended December 31, 2014 and 2013
(In thousands of won)
28
8. Available-for-sale Securities
Balances as of available-for-sale securities as of December 31, 2014 and 2013 are as follows:
2014 2013
Equity securities
Marketable equity securities W 4,655,000 7,200,000
Unlisted equity securities 2,893,203 2,700,821
Equity investments 1 1
Beneficiary certificates 26,879,856 27,416,294
34,428,060 37,317,116
Debt securities 12,439,707 15,596,231
W 46,867,767 52,913,347
31. Hyundai Commercial, Inc. and Subsidiaries
Notes to the Consolidated Financial Statements
For the years ended December 31, 2014 and 2013
(In thousands of won)
29
8. Available-for-sale Securities, Continued
Details of available-for-sale securities as of December 31, 2014 and 2013 are as follows:
Book value
Number
of shares
Owner-
ship (%)
Acquisition
cost 2014 2013
Marketable equity securities
JNK Heaters Co., Ltd. 1,000,000 12.50 W 10,126,881 4,655,000 7,200,000
Unlisted equity securities
Anyang KDC Project
Corp. (*1) 389,999 15.00 2,580,576 2,832,087 2,689,862
Anyang KDC Asset
Management Corp. (*1) 1,499 15.00 9,919 11,243 10,339
Isung Eng, Corp. 24 - 620 620 620
Tong Yang Leisure Co.,
Ltd. (*1) 6,200 0.18 190,395 49,253 -
2,781,510 2,893,203 2,700,821
Equity investments
HB Fourth ABS, Ltd. 13 0.19 1 1 1
Beneficiary certificates
Hanjoo New Credit
Private Special Asset
Investment Trust (*2) - - 618,376 621,184 4,134,256
Yuniae Daebu Investment
Trust (*2) - - 4,947,777 5,021,568 7,764,524
Nice Investment Second
Trust (*2) - - 6,334,000 6,408,806 8,705,756
Daesong Finance Daebu
(*2) - - - - 6,811,758
YNK Partners Daebu - - 5,022,659 5,092,928 -
Hyundai Ship Investment
Fund No.3 (*3) - - 9,680,000 9,735,370 -
26,602,812 26,879,856 27,416,294
Debt securities
Leehan Corp. - - - - 3,512,054
Commercial Auto Third
SPC (*1) - - 4,000,000 4,128,163 4,007,450
Commercial Auto Fourth
SPC (*1) - - 8,000,000 8,311,544 8,076,727
12,000,000 12,439,707 15,596,231
W 51,511,204 46,867,767 52,913,347
32. Hyundai Commercial, Inc. and Subsidiaries
Notes to the Consolidated Financial Statements
For the years ended December 31, 2014 and 2013
(In thousands of won)
30
8. Available-for-sale Securities, Continued
(*1) The fair value of the securities was estimated based on the prices provided by an external
appraiser, Korea Investors Service Pricing Inc.
(*2) The fair value of beneficiary certificates which is related to NPL investment was estimated based
on the prices provided by an external appraiser, Korea Investors Service Pricing Inc. The fair
value of the securities was determined by discounting the expected cash flows based on principal
and interest arising from trusted asset at an appropriate rate.
(*3) The fair value of the securities was estimated based on the prices provided by an external
appraiser, KIS Pricing Inc. The fair value is measured by deducting other assets and liabilities
within the investment trust from the amount estimated by discounting expected future cash flows
of beneficiary certificates.
33. Hyundai Commercial, Inc. and Subsidiaries
Notes to the Consolidated Financial Statements
For the years ended December 31, 2014 and 2013
(In thousands of won)
31
9. Investments in Associates
(1) Details of investments in associates as of December 31, 2014 and 2013 are as follows:
Loca-
tion
Number of
shares
Owner-
ship (%)
Acquisition
cost Book value
December 31, 2014
Hyundai Card Co.,
Ltd. (*) Korea 8,889,622 5.54 W 113,820,162 178,492,382
Hyundai Life
Insurance Co., Ltd. Korea 15,509,040 39.65 180,002,130 117,138,268
W 293,822,292 295,630,650
December 31, 2013
Hyundai Card Co.,
Ltd. (*) Korea 8,889,622 5.54 W 113,820,162 168,007,972
Hyundai Life
Insurance Co., Ltd. Korea 10,785,620 39.44 139,853,060 90,109,793
W 253,673,222 258,117,765
(*) The Group’s shareholdings are less than 20%. However, the Group is able to significantly exert
influence through its involvement in the financial and operating processes, and thus classified as
investments in associates.
34. Hyundai Commercial, Inc. and Subsidiaries
Notes to the Consolidated Financial Statements
For the years ended December 31, 2014 and 2013
(In thousands of won)
32
9. Investments in Associates, Continued
(2) Details of valuation of equity method investment and other changes for the years then ended
December 31, 2014 and 2013 are as follows:
Beginning
balance Acquisition
Share of
profit (loss)
Changes in
accumulated
other
comprehen-
sive income
(loss) (*1)
Changes
in
retained
earnings
Ending
balance
December 31, 2014
Hyundai Card Co.,
Ltd. W 168,007,972 - 12,382,461 (1,898,051) - 178,492,382
Hyundai Life
Insurance Co.,
Ltd.(*2) 90,109,793 40,149,070 (34,799,344) 21,678,749 - 117,138,268
W 258,117,765 40,149,070 (22,416,883) 19,780,698 - 295,630,650
December 31, 2013
Hyundai Card Co.,
Ltd. W 158,386,190 - 9,041,656 80,467 499,659 168,007,972
Hyundai Life
Insurance Co.,
Ltd.(*2) 127,015,755 940,000 (25,292,131) (13,206,434) 652,603 90,109,793
W 285,401,945 940,000 (16,250,475) (13,125,967) 1,152,262 258,117,765
(*1) Tax effects are not deducted.
(*2) The Group recognized expense associated with the investment in Hyundai Life Insurance Co., Ltd.
which amounted to W8,582,824 thousand as other operating expense.
(3) Summary of financial information of associates as of and for the years ended December 31, 2014
and 2013 are as follows:
Summary of financial information of associates (*1)
Reporting date Total assets Total liabilities Net assets
December 31, 2014
Hyundai Card Co., Ltd. December 31 W 12,402,910,868 9,847,530,042 2,555,380,826
Hyundai Life Insurance Co.,
Ltd. December 31 4,902,840,052 4,668,160,432 234,679,620
December 31, 2013
Hyundai Card Co., Ltd. December 31 W 11,520,877,692 9,154,729,617 2,366,148,075
Hyundai Life Insurance Co.,
Ltd. December 31 (*2) 4,107,538,481 3,941,914,013 165,624,468
35. Hyundai Commercial, Inc. and Subsidiaries
Notes to the Consolidated Financial Statements
For the years ended December 31, 2014 and 2013
(In thousands of won)
33
9. Investments in Associates, Continued
Reporting
date
Summary of financial information of associates (*1)
Operating
revenue
Profit (loss) for
the year
Total
comprehen-
sive income
(loss)
Dividends
received
December 31, 2014
Hyundai Card Co., Ltd. December 31 W 2,617,995,017 223,514,021 189,252,571 -
Hyundai Life Insurance
Co., Ltd. December 31 1,061,859,537 (85,392,841) (30,601,310) -
December 31, 2013
Hyundai Card Co., Ltd. December 31 W 2,527,479,161 163,209,633 173,857,648 -
Hyundai Life Insurance
Co., Ltd.
December 31
(*2) 981,376,579 (39,543,472) (73,229,042) -
(*1) Summarized financial statements of Hyundai Life Insurance Co., Ltd. were adjusted to reflect fair
value adjustments made at the time of acquisition.
(*2) The fiscal year-end date of Hyundai Life Insurance Co., Ltd. has been changed from March 31 to
December 31 according to Enforcement Decree of the Insurance Business Act, Article 61.
(4) Reconciliations of the summarized financial information presented to the carrying amount of its
interest in associate as of December 31, 2014 and 2013 are as follows:
Net assets
Ownership
(%)
Shares of
assets Goodwill
Unamortized
fair value
adjustments
(*) Book value
December 31, 2014
Hyundai Card Co., Ltd. W 2,555,380,826 5.54 141,565,632 36,926,750 - 178,492,382
Hyundai Life Insurance
Co., Ltd. 234,679,620 39.65 93,058,209 19,739,063 4,340,996 117,138,268
W 2,790,060,446 234,623,841 56,665,813 4,340,996 295,630,650
December 31, 2013
Hyundai Card Co., Ltd. W 2,366,148,075 5.54 131,081,222 36,926,750 - 168,007,972
Hyundai Life Insurance
Co., Ltd. 165,624,468 39.44 65,322,218 17,265,061 7,522,514 90,109,793
W 2,531,772,543 196,403,440 54,191,811 7,522,514 258,117,765
(*) Fair value adjustments are related to value of business acquired, sales channel and IT systems
made at the time of acquisition.
36. Hyundai Commercial, Inc. and Subsidiaries
Notes to the Consolidated Financial Statements
For the years ended December 31, 2014 and 2013
(In thousands of won)
34
10. Financial Receivables
Details of financial receivables as of December 31, 2014 and 2013 are as follows:
Principal
Deferred loan
origination
fees and
costs
Present value
discount
Allowance for
doubtful
accounts Book value
December 31, 2014
Loans receivables
Factoring receivables W 2,156,213 - - (2,516) 2,153,697
Loans 3,483,482,341 42,746,404 (366,685) (22,435,823) 3,503,426,237
3,485,638,554 42,746,404 (366,685) (22,438,339) 3,505,579,934
Installment financial
assets
Auto 281,405,117 3,938,103 - (1,468,052) 283,875,168
Durable goods 13,839,097 (351,353) - (3,882) 13,483,862
295,244,214 3,586,750 - (1,471,934) 297,359,030
Lease receivables
Financial lease
receivables 306,642,700 540,517 - (3,233,418) 303,949,799
W 4,087,525,468 46,873,671 (366,685) (27,143,691) 4,106,888,763
December 31, 2013
Loans receivables
Factoring receivables W 4,145,309 - - (28,760) 4,116,549
Loans 2,962,002,487 41,732,726 (320,405) (21,626,634) 2,981,788,174
2,966,147,796 41,732,726 (320,405) (21,655,394) 2,985,904,723
Installment financial
assets
Auto 278,334,703 3,560,044 - (1,827,954) 280,066,793
Durable goods 20,315,358 (243,945) - (135,965) 19,935,448
298,650,061 3,316,099 - (1,963,919) 300,002,241
Lease receivables
Financial lease
receivables 213,344,202 192,101 - (1,815,587) 211,720,716
W 3,478,142,059 45,240,926 (320,405) (25,434,900) 3,497,627,680
37. Hyundai Commercial, Inc. and Subsidiaries
Notes to the Consolidated Financial Statements
For the years ended December 31, 2014 and 2013
(In thousands of won)
35
11. Allowance for Doubtful Accounts
Changes in allowance for doubtful accounts for the years ended December 31, 2014 and 2013 are as
follows:
Loans
receivables
Installment
financial
assets
Lease
receivables Other assets Total
December 31, 2014
Beginning balance W 21,655,394 1,963,919 1,815,587 163,604 25,598,504
Amounts written off (9,722,696) (1,073,302) (1,969,996) - (12,765,994)
Recoveries of amounts
previously written off 1,069,282 252,861 187 - 1,322,330
Disposal of receivables (17,579,858) (1,017,426) - - (18,597,284)
Unwinding of discount (215,080) (11,780) - - (226,860)
Additional (reversed)
allowance 27,231,297 1,357,662 3,387,640 (29,502) 31,947,097
Ending balance W 22,438,339 1,471,934 3,233,418 134,102 27,277,793
December 31, 2013
Beginning balance W 19,259,170 2,527,318 1,026,911 227,475 23,040,874
Amounts written off (6,452,388) (280,185) (128,917) - (6,861,490)
Recoveries of amounts
previously written off 1,278,189 59,806 23,660 - 1,361,655
Disposal of receivables (15,011,571) (1,698,041) (955) - (16,710,567)
Unwinding of discount (262,070) (24,816) - - (286,886)
Additional (reversed)
allowance 22,844,064 1,379,837 894,888 (63,871) 25,054,918
Ending balance W 21,655,394 1,963,919 1,815,587 163,604 25,598,504
38. Hyundai Commercial, Inc. and Subsidiaries
Notes to the Consolidated Financial Statements
For the years ended December 31, 2014 and 2013
(In thousands of won)
36
12. Fair Value of Financial Instruments
Fair value is the amount at which the asset could be exchanged or the liabilities could be settled in a
transaction between knowledgeable and willing independent parties. The best estimated fair value is
the published price quotation in an active market. The Group believes that valuation technique applied
to the financial instruments is adequate and fair value of financial instruments is reasonable, but if the
Group uses another valuation technique or assumptions, such fair value might be changed. Also, as
fair value measurement of financial instruments uses variable valuation techniques and assumptions,
comparing fair value with those recognized by other financial institutions might be difficult.
The method of measuring fair value of financial instruments is as follows:
Type Fair Value Measurement Method
Cash and due from
banks
The book value and the fair value of cash are identical. As cash, deposits, and
other cash equivalent instruments can be easily converted into cash, the book
value approximates the fair value.
Trading securities In case that the market of a financial instrument is active, fair value is established
at the closing quoted price as of the last day for the reporting period. The fair
value of investments in money market funds is determined by the sum of
acquisition cost and accrued interest.
Available-for-sale
securities
When available, the Group measures the fair value of a security using quoted
prices in an active market. If a market for a security is not active, the Group
establishes fair value by using a highly accredited independent valuation agency.
The independent valuation agency utilizes various valuation techniques, which
include discounted cash flow model, imputed market value model, free cash flow
to equity model, dividend discount model, risk adjusted discount rate method,
and net asset valuation approach. Depending on the characteristic and nature of
the instrument, the fair value is measured by using at least one valuation
technique.
Loans receivables /
Installment
financial assets /
Lease receivables
The fair value is determined using discounted cash flow model that incorporate
parameter inputs for expected maturity rate/prepayment rate, as appropriate.
As the discount rate used for determining the fair value incorporates the time
value of money and credit risk, the Group’s discount rate system is formed to
consider the market risk and the credit risk.
Derivative
instruments
The fair value of interest rate swaps and currency swaps are determined by using
a discounted cash flow model based on a current interest rate yield curve
appropriate for market interest rate. The fair value of each derivative is
measured by offsetting and discounting the expected cash flows of the swap at
appropriate discount rate which is based on forward interest rate and exchange
rate that is generated by using the above method.
Borrowings /
Dentures /
Securitized debts
The fair value is determined by using discounted cash flow method. In other
words, the fair value of a financial instrument is determined by discounting the
expected cash flows at an appropriate rate.
Other financial
assets and other
financial liabilities
The fair value is determined by using the discounted cash flow method.
However, when the cash flow cannot be objectively measured, the book value
approximates the fair value.
39. Hyundai Commercial, Inc. and Subsidiaries
Notes to the Consolidated Financial Statements
For the years ended December 31, 2014 and 2013
(In thousands of won)
37
12. Fair Value of Financial Instruments, Continued
(1) Fair values of financial instruments as of December 31, 2014 and 2013 are as follows:
December 31, 2014 December 31, 2013
Book value Fair value Book value Fair value
Financial assets
Cash and due from banks W 232,802,099 232,802,099 280,498,429 280,498,429
Trading securities 29,063,677 29,063,677 - -
Available-for-sale securities 46,867,767 46,867,767 52,913,347 52,913,347
Loans receivables 3,505,579,934 3,508,954,446 2,985,904,723 2,968,560,192
Installment financial assets 297,359,030 296,679,081 300,002,241 298,739,837
Lease receivables 303,949,799 304,045,372 211,720,716 211,044,247
Derivative assets - - 162,823 162,823
Account receivables 3,553,469 3,553,469 18,075,353 18,075,353
Accrued revenues 20,826,869 20,826,869 18,155,916 18,155,916
Leasehold deposits 2,409,426 2,326,800 2,126,868 2,086,563
W 4,442,412,070 4,445,119,580 3,869,560,416 3,850,236,707
Financial liabilities
Borrowings W 432,828,419 433,598,405 596,955,177 598,777,407
Debentures 3,592,437,798 3,637,422,103 2,803,450,657 2,850,826,093
Securitized debts 89,982,509 90,975,852 259,852,347 265,161,361
Derivative liabilities 3,493,829 3,493,829 1,937,593 1,937,593
Account payables 20,409,057 20,409,057 14,442,798 14,442,798
Accrued expenses 32,305,067 32,305,067 24,018,798 24,018,798
Withholdings (*) 8,545,657 8,545,657 4,170,622 4,170,622
Leasehold deposits 57,948,012 59,530,573 53,848,412 54,366,279
W 4,237,950,348 4,286,280,543 3,758,676,404 3,813,700,951
(*) Excluding taxes and dues
40. Hyundai Commercial, Inc. and Subsidiaries
Notes to the Consolidated Financial Statements
For the years ended December 31, 2014 and 2013
(In thousands of won)
38
12. Fair Value of Financial Instruments, Continued
(2) Fair Value Hierarchy
The levels of fair value hierarchy have been defined as follows:
- Level 1: Quoted prices in active markets for identical assets or liabilities. For example, listed
stocks and derivatives.
- Level 2: Inputs for the asset or liability included within valuation techniques that are observable
market data. For example, most bonds issued in Korean won and foreign currency, general
unlisted derivatives like swap, forward, option.
- Level 3: Inputs for the asset or liability that is not based on observable market data. For example,
unlisted stocks, complicated structured bonds, complicated unlisted derivatives and others.
A. Financial assets and liabilities carried at fair value in the consolidated statements of financial position
1) The fair value hierarchy of financial instruments as of December 31, 2014 and 2013 are as follows:
Fair value hierarchy
Book value Fair value Level 1 Level 2 Level 3
December 31, 2014
Financial assets
Available-for-sale
securities W 29,063,677 29,063,677 - 29,063,677 -
Derivative assets 46,867,767 46,867,767 4,655,000 - 42,212,767
W 75,931,444 75,931,444 4,655,000 29,063,677 42,212,767
Financial liabilities
Derivative liabilities W 3,493,829 3,493,829 - 3,493,829 -
December 31, 2013
Financial assets
Available-for-sale
securities W 52,913,347 52,913,347 7,200,000 - 45,713,347
Derivative assets 162,823 162,823 - 162,823 -
W 53,076,170 53,076,170 7,200,000 162,823 45,713,347
Financial liabilities
Derivative liabilities W 1,937,593 1,937,593 - 1,937,593 -
41. Hyundai Commercial, Inc. and Subsidiaries
Notes to the Consolidated Financial Statements
For the years ended December 31, 2014 and 2013
(In thousands of won)
39
12. Fair Value of Financial Instruments, Continued
2) The valuation techniques and the fair value measurement input variables of financial assets and
liabilities classified as level 2 as of December 31, 2014 and 2013 are as follows:
Fair value
December 31,
2014
December 31,
2013
Valuation
techniques Inputs
Financial assets
Trading securities W 29,063,677 - DCF Model Discount rate,
short -term
interest rate,
volatility, and
others
Derivative assets - 162,823 DCF Model Discount rate,
short -term
interest rate,
volatility, and
others
Financial liabilities
Derivative financial
liabilities
3,493,829 1,937,593 DCF Model Discount rate,
volatility, foreign
exchange rate,
stock price, and
others
Valuation techniques and quantitative information unobserved inputs of financial instruments classified
as level 3 as of December 31, 2014 and 2013 are as follows:
December 31, 2014
Fair value
Valuation
techniques Inputs
Unobservable
inputs
Estimated
range of
unobservable
inputs (%)
Financial assets
Available-for-sale
securities
W 42,212,767 DCF Model Discount rate Recovery rate 94.74 ~ 100.00
Spot rate 3.44 ~ 6.34
Issue rate,
Residual
maturity,
Credit rating
-
Discount curve 3.61 ~ 9.76
42. Hyundai Commercial, Inc. and Subsidiaries
Notes to the Consolidated Financial Statements
For the years ended December 31, 2014 and 2013
(In thousands of won)
40
12. Fair Value of Financial Instruments, Continued
December 31, 2013
Fair value
Valuation
techniques Inputs
Unobservable
inputs
Estimated
range of
unobservable
inputs (%)
Financial assets
Available-for-sale
securities
W 45,713,347 DCF Model Discount rate Recovery rate 94.74 ~ 100.00
Spot rate 3.86 ~ 7.74
Issue rate,
Residual
maturity,
Credit rating
-
Discount curve 4.03 ~ 10.77
Financial assets classified as level 3 are available-for-sale financial assets as of December 31, 2014.
Changes in other comprehensive income due to changes in inputs to valuation are considered to have
insignificant impacts considering the amount of total equity.
3) The changes in financial instruments of level 3 for the years ended December 31, 2014 and 2013 are
as follows:
Available-for-sale securities
2014 2013
Beginning balance W 45,713,347 16,334,327
Acquisition 16,570,396 44,267,937
Interest income 386,359 2,000,762
Gain (loss) on valuation (other comprehensive
income or loss) 560,840 (11,396,848)
Disposal (21,018,175) (5,492,831)
Ending balance W 42,212,767 45,713,347
43. Hyundai Commercial, Inc. and Subsidiaries
Notes to the Consolidated Financial Statements
For the years ended December 31, 2014 and 2013
(In thousands of won)
41
12. Fair Value of Financial Instruments, Continued
B. Financial instruments not measured at fair value but disclosed
1) The fair value hierarchy of financial instruments not measured at fair value but disclosed as of
December 31, 2014 and 2013 are as follows:
December 31, 2014
Book value Fair value
Fair value hierarchy
Level 1 Level 2 Level 3
Financial assets
Cash and due from
banks (*) W 232,802,099 232,802,099 - 232,802,099 -
Loans receivables 3,505,579,934 3,508,954,446 - - 3,508,954,446
Installment
financial assets 297,359,030 296,679,081 - - 296,679,081
Lease receivables 303,949,799 304,045,372 - - 304,045,372
Account
receivables 3,553,469 3,553,469 - - 3,553,469
Accrued revenues 20,826,869 20,826,869 - - 20,826,869
Leasehold deposits 2,409,426 2,326,800 - 2,326,800 -
W 4,366,480,626 4,369,188,136 - 235,128,899 4,134,059,237
Financial liabilities
Borrowings W 432,828,419 433,598,405 - 433,598,405 -
Debentures 3,592,437,798 3,637,422,103 - 3,637,422,103 -
Securitized debts 89,982,509 90,975,852 - - 90,975,852
Account payables 20,409,057 20,409,057 - - 20,409,057
Accrued expenses 32,305,067 32,305,067 - - 32,305,067
Withholdings 8,545,657 8,545,657 - - 8,545,657
Leasehold deposits 57,948,012 59,530,573 - 59,530,573 -
W 4,234,456,519 4,282,786,714 - 4,130,551,081 152,235,633
(*) In the items classified as level 2, the book value is disclosed as fair value since the book value is a
reasonable estimate of the fair value.
44. Hyundai Commercial, Inc. and Subsidiaries
Notes to the Consolidated Financial Statements
For the years ended December 31, 2014 and 2013
(In thousands of won)
42
12. Fair Value of Financial Instruments, Continued
December 31, 2013
Book value Fair value
Fair value hierarchy
Level 1 Level 2 Level 3
Financial assets
Cash and due from
banks (*) W 280,498,429 280,498,429 - 280,498,429 -
Loans receivables 2,985,904,723 2,968,560,192 - - 2,968,560,192
Installment financial
assets 300,002,241 298,739,837 - - 298,739,837
Lease receivables 211,720,716 211,044,247 - - 211,044,247
Account receivables 18,075,353 18,075,353 - - 18,075,353
Accrued revenues 18,155,916 18,155,916 - - 18,155,916
Leasehold deposits 2,126,868 2,086,563 - 2,086,563 -
W 3,816,484,246 3,797,160,537 - 282,584,992 3,514,575,545
Financial liabilities
Borrowings W 596,955,177 598,777,407 - 598,777,407 -
Debentures 2,803,450,657 2,850,826,093 - 2,850,826,093 -
Securitized debts 259,852,347 265,161,361 - - 265,161,361
Account payables 14,442,798 14,442,798 - - 14,442,798
Accrued expenses 24,018,798 24,018,798 - - 24,018,798
Withholdings 4,170,622 4,170,622 - - 4,170,622
Leasehold deposits 53,848,412 54,366,279 - 54,366,279 -
W 3,756,738,811 3,811,763,358 - 3,503,969,779 307,793,579
(*) In the items classified as level 2, book value is disclosed as fair value since the book value is a
reasonable estimate of the fair value.
45. Hyundai Commercial, Inc. and Subsidiaries
Notes to the Consolidated Financial Statements
For the years ended December 31, 2014 and 2013
(In thousands of won)
43
12. Fair Value of Financial Instruments, Continued
2) Valuation techniques and inputs used to measure fair value
Since the book value is a reasonable estimate of the fair value, the valuation techniques and inputs
related to items that recognize the book value as the fair value are not disclosed.
The valuation techniques and the fair value measurement input variables of financial instruments
classified as level 2 or level 3 which the fair value are disclosed as of December 31, 2014 and 2013 are
as follows:
Fair value
December 31,
2014
December 31,
2013
Valuation
technique Inputs
Financial assets
Loans receivables W 3,508,954,446 2,968,560,192 DCF model Procurement interest
rate, credit spread,
other spread
Installment financial assets 296,679,081 298,739,837 DCF model Procurement interest
rate, credit spread,
other spread
Financial lease receivables 304,045,372 211,044,247 DCF model Procurement interest
rate, credit spread,
other spread
Leasehold deposits 2,326,800 2,086,563 DCF model Base interest rate
W 4,112,005,699 3,480,430,839
Financial liabilities
Borrowings W 433,598,405 598,777,407 DCF model Procurement interest
rate, credit spread,
other spread
Debentures 3,637,422,103 2,850,826,093 DCF model Procurement interest
rate, credit spread,
other spread
Securitized debts 90,975,852 265,161,361 DCF model Procurement interest
rate, credit spread,
other spread
Leasehold deposits 59,530,573 54,366,279 DCF model Base interest rate
W 4,221,526,933 3,769,131,140
46. Hyundai Commercial, Inc. and Subsidiaries
Notes to the Consolidated Financial Statements
For the years ended December 31, 2014 and 2013
(In thousands of won)
44
12. Fair Value of Financial Instruments, Continued
The book values of financial instruments by categories as of December 31, 2014 and 2013 were as
follows:
Financial
assets at fair
value
through
profit or loss
Available-
for-sale
financial
assets
Loans and
receivables
Hedging
derivative
instruments Total
December 31, 2014
Financial assets
Cash and due from banks W - - 232,802,099 - 232,802,099
Trading securities 29,063,677 - - - 29,063,677
Available-for-sale securities - 46,867,767 - - 46,867,767
Loans receivable - - 3,505,579,934 - 3,505,579,934
Installment financial assets - - 297,359,030 - 297,359,030
Financial lease receivables - - 303,949,799 - 303,949,799
Account receivables - - 3,553,469 - 3,553,469
Accrued revenues - - 20,826,869 - 20,826,869
Leasehold deposits - - 2,409,426 - 2,409,426
W 29,063,677 46,867,767 4,366,480,626 - 4,442,412,070
December 31, 2013
Financial assets
Cash and due from banks W - - 280,498,429 - 280,498,429
Available-for-sale securities - 52,913,347 - - 52,913,347
Loans receivable - - 2,985,904,723 - 2,985,904,723
Installment financial assets - - 300,002,241 - 300,002,241
Financial lease receivables - - 211,720,716 - 211,720,716
Derivative assets 153 - - 162,670 162,823
Account receivables - - 18,075,353 - 18,075,353
Accrued revenues - - 18,155,916 - 18,155,916
Leasehold deposits - - 2,126,868 - 2,126,868
W 153 52,913,347 3,816,484,246 162,670 3,869,560,416
47. Hyundai Commercial, Inc. and Subsidiaries
Notes to the Consolidated Financial Statements
For the years ended December 31, 2014 and 2013
(In thousands of won)
45
12. Fair Value of Financial Instruments, Continued
Financial
liabilities at
amortized cost
Hedging
derivative
instruments Total
December 31, 2014
Financial liabilities
Borrowings W 432,828,419 - 432,828,419
Debentures 3,592,437,798 - 3,592,437,798
Securitized debts 89,982,509 - 89,982,509
Derivative liabilities - 3,493,829 3,493,829
Account payables 20,409,057 - 20,409,057
Accrued expenses 32,305,067 - 32,305,067
Withholdings (*) 8,545,657 - 8,545,657
Leasehold deposits received 57,948,012 - 57,948,012
W 4,234,456,519 3,493,829 4,237,950,348
December 31, 2013
Financial liabilities
Borrowings W 596,955,177 - 596,955,177
Debentures 2,803,450,657 - 2,803,450,657
Securitized debts 259,852,347 - 259,852,347
Derivative liabilities - 1,937,593 1,937,593
Account payables 14,442,798 - 14,442,798
Accrued expenses 24,018,798 - 24,018,798
Withholdings (*) 4,170,622 - 4,170,622
Leasehold deposits received 53,848,412 - 53,848,412
W 3,756,738,811 1,937,593 3,758,676,404
(*) Excluding taxes and dues
48. Hyundai Commercial, Inc. and Subsidiaries
Notes to the Consolidated Financial Statements
For the years ended December 31, 2014 and 2013
(In thousands of won)
46
13. Transfer of Financial Assets
(a) Financial assets that are not entirely derecognized
The Group issued senior and subordinated securitized debts based on loans and instalment receivables
which were securitized. The securitized debts have recourse only to the transferred assets.
Details of financial assets transferred but not entirely derecognized as of December 31, 2014 and 2013
are as follows:
December 31, 2014 December 31, 2013
Book value of assets:
Loans receivables W 837,293,807 605,061,704
Installment financial assets 1,428,220 8,609,642
838,722,027 613,671,346
Book value of related liabilities W 89,982,509 259,852,347
Liabilities having right of resource
on transferred assets:
Fair value of assets W 839,524,750 610,120,433
Fair value of related liabilities (90,975,852) (265,161,361)
Net position W 748,548,898 344,959,072
(b) Financial assets that are entirely derecognized
The Group derecognized loans receivables from the consolidated financial statements by transferring
them for W101,598,233 thousand to Commercial Auto Third SPC (Trustee Bank: Citibank Korea, Inc.)
on December 18, 2012. Gains related to the transaction amounted to W2,450,829 thousand.
Also the Group derecognized loans receivables from the consolidated financial statements by
transferring them for W202,700,000 thousand to Commercial Auto Fourth SPC (Trustee Bank: Woori
Bank) on November 15, 2013. Gains related to the transaction amounted to W2,674,381 thousand.
49. Hyundai Commercial, Inc. and Subsidiaries
Notes to the Consolidated Financial Statements
For the years ended December 31, 2014 and 2013
(In thousands of won)
47
13. Transfer of Financial Assets, Continued
(b) Financial assets that are entirely derecognized, Continued
The Group has continuing involvement in the transferred assets after taking over debt securities issued
by Commercial Auto Third SPC and Commercial Auto Fourth SPC.
Details of continuing involvement were as follows:
Maximum
exposure
to loss
Type of continuing
involvement
Available-for-sale
securities
December 31, 2014
Commercial Auto Third SPC Acquisition on debt
securities
W 4,128,163 4,128,163
Commercial Auto Fourth SPC 8,311,544 8,311,544
W 12,439,707 12,439,707
Maximum
exposure
to loss
Type of continuing
involvement
Available-for-sale
securities
December 31, 2013
Commercial Auto Third SPC Acquisition on debt
securities
W 4,007,450 4,007,450
Commercial Auto Fourth SPC 8,076,727 8,076,727
W 12,084,177 12,084,177
50. Hyundai Commercial, Inc. and Subsidiaries
Notes to the Consolidated Financial Statements
For the years ended December 31, 2014 and 2013
(In thousands of won)
48
14. Financial Lease Receivables
Details of total lease investments and present value of minimum lease payment as of December 31,
2014 and 2013 are as follows:
December 31, 2014 December 31, 2013
Total lease
investments
Present value
of minimum
lease
payment
Total lease
investments
Present value
of minimum
lease
payment
Less than 1 year W 114,331,819 98,361,154 88,198,065 78,351,361
1 to 5 years 228,163,719 208,822,062 144,063,735 135,184,942
W 342,495,538 307,183,216 232,261,800 213,536,303
Details of unearned interest income as of December 31, 2014 and 2013 are as follows:
December 31, 2014 December 31, 2013
Total lease investments W 342,495,538 232,261,800
Net lease investments
Minimum lease payment (present value) W 307,183,216 213,536,303
Unguaranteed residual value (present value) - -
W 307,183,216 213,536,303
Unearned interest income W 35,312,322 18,725,497
15. Property and Equipment
Details of property and equipment as of December 31, 2014 and 2013 are as follows:
Acquisition cost
Accumulated
depreciation Book value
December 31, 2014
Vehicles W 113,472 (94,428) 19,044
Fixtures and furniture 13,163,555 (7,935,609) 5,227,946
Others 371,000 - 371,000
W 13,648,027 (8,030,037) 5,617,990
December 31, 2013
Vehicles W 113,472 (75,385) 38,087
Fixtures and furniture 9,574,766 (6,315,628) 3,259,138
Others 411,000 - 411,000
W 10,099,238 (6,391,013) 3,708,225
51. Hyundai Commercial, Inc. and Subsidiaries
Notes to the Consolidated Financial Statements
For the years ended December 31, 2014 and 2013
(In thousands of won)
49
15. Property and Equipment, Continued
Changes in property and equipment for the years ended December 31, 2014 and 2013 are as follows:
Beginning
balance Acquisition Disposal
Deprecia-
tion
Ending
balance
December 31, 2014
Vehicles W 38,087 - - (19,043) 19,044
Fixtures and
furniture 3,259,138 3,736,064 (2,333) (1,764,923) 5,227,946
Others 411,000 - (40,000) - 371,000
W 3,708,225 3,736,064 (42,333) (1,783,966) 5,617,990
December 31, 2013
Vehicles W 69,799 - (2,534) (29,178) 38,087
Fixtures and
furniture 2,701,927 1,815,171 (281) (1,257,679) 3,259,138
Others 411,000 - - - 411,000
W 3,182,726 1,815,171 (2,815) (1,286,857) 3,708,225
As of December 31, 2014, the Group maintained comprehensive property insurance with Hyundai
Marine and Fire Insurance for its fixtures and furniture, and other tangible assets for up to W4,631,921
thousand (W2,746,052 thousand as of December 31, 2013), vehicle insurance for its vehicles, and
group accident insurance, travel insurance and business damage insurance for its employees. Also,
the Group maintained comprehensive property insurance with Hyundai Marine and Fire Insurance for
its machine tool installment financial assets and lease assets for up to W41,212,098 thousand
(W104,410,832 thousand as of December 31, 2013).
52. Hyundai Commercial, Inc. and Subsidiaries
Notes to the Consolidated Financial Statements
For the years ended December 31, 2014 and 2013
(In thousands of won)
50
16. Intangible Assets
Details of intangible assets as of December 31, 2014 and 2013 are as follows:
Acquisition cost
Accumulated
amortization Book value
December 31, 2014
Development costs W 7,502,523 (2,850,184) 4,652,339
Software 8,144,817 (6,229,114) 1,915,703
Membership 4,720,565 - 4,720,565
Others 812,901 (117,671) 695,230
W 21,180,806 (9,196,969) 11,983,837
December 31, 2013
Development costs W 4,818,913 (1,573,439) 3,245,474
Software 6,794,896 (5,565,983) 1,228,913
Others 25,851 (25,848) 3
W 11,639,660 (7,165,270) 4,474,390
Changes in intangible assets for the years ended December 31, 2014 and 2013 are as follows:
(*1) Includes transfer from advance payments
(*2) Due to changes in the Group’s accounting policy, there were reclassification from other
investment assets to membership. From this amount, W190,395 thousand was converted into
available-for-sale securities.
Beginning
balance
Acquisition
(*) Amortization Ending balance
December 31, 2013
Development costs W 1,978,048 1,971,120 (703,694) 3,245,474
Software 1,474,742 376,059 (621,888) 1,228,913
Others 220 - (217) 3
W 3,453,010 2,347,179 (1,325,799) 4,474,390
(*) Includes transfer from advance payments
Beginning
balance
Acquisition
(*1)
Transfer
(*2) Amortization
Impairment
loss
Ending
balance
December 31, 2014
Development costs W 3,245,474 2,683,611 - (1,276,746) - 4,652,339
Software 1,228,913 1,349,921 - (663,131) - 1,915,703
Memberships - 1,500,000 3,724,169 - (503,604) 4,720,565
Others 3 787,050 - (91,823) - 695,230
W 4,474,390 6,320,582 3,724,169 (2,031,700) (503,604) 11,983,837
53. Hyundai Commercial, Inc. and Subsidiaries
Notes to the Consolidated Financial Statements
For the years ended December 31, 2014 and 2013
(In thousands of won)
51
17. Borrowings
Details of borrowings as of December 31, 2014 and 2013 are as follows:
Lender
Annual interest
rate (%)
December 31,
2014
December 31,
2013
Borrowings in won
Commercial paper Dongbu Securities
and 3 others 2.20 ~ 2.85 W 120,000,000 90,000,000
General loan Woori Bank and 5
others 2.47 ~ 4.54 312,828,419 506,955,177
W 432,828,419 596,955,177
18. Debentures
Details of debentures issued by the Group as of December 31, 2014 and 2013 are as follows:
Annual interest
rate (%) Par value Book value
December 31, 2014
Current portion of debenture
Debentures 2.14 ~ 5.4 W 979,000,000 979,000,000
Discount on debentures - (383,842)
979,000,000 978,616,158
Non-current portion of debenture
Debentures 2.30 ~ 6.48 2,615,946,000 2,615,946,000
Discount on debentures - (2,124,360)
2,615,946,000 2,613,821,640
W 3,594,946,000 3,592,437,798
December 31, 2013
Current portion of debenture
Debentures 2.74 ~ 8.00 W 712,388,000 712,388,000
Discount on debentures - (314,325)
712,388,000 712,073,675
Non-current portion of debenture
Debentures 2.82 ~ 6.48 2,093,000,000 2,093,000,000
Discount on debentures - (1,623,018)
2,093,000,000 2,091,376,982
W 2,805,388,000 2,803,450,657