1. 9th World Conference on Experimental Heat Transfer, Fluid Mechanics and Thermodynamics
12-15 June, 2017, Iguazu Falls, Brazil
ANALYSIS OF CHORD LENGTH DISTRIBUTION IN PHASE
INVERSION OF WATER-OIL EMULSIONS AT ELECTRICAL
SUBMERSIBLE PUMP OUTLET
Natan Augusto Vieira Bulgarelli
Faculty of Mechanical Engineering, University of Campinas, Campinas, Sao Paulo, Brazil
bulgarelli@fem.unicamp.br
Jorge Luiz Biazussi¹
Carlos Eduardo Perles¹
William Monte Verde¹
¹Center for Petroleum Studies, University of Campinas, Campinas, Sao Paulo, Brazil
Marcelo Souza de Castro²
Antonio Carlos Bannwart²
²Faculty of Mechanical Engineering, University of Campinas, Campinas, Sao Paulo, Brazil
Abstract. This work aims to investigate the chord length distribution in phase inversion phenomenon of water-oil
emulsions at Electrical Submersible Pump (ESP) outlet. The 8-stage ESP was tested in three different rotational speeds
(83.7, 125.7 and 251.3 rad/s) and an oil viscosity of 0.052 Pa.s for the best efficiency point (BEP) flow rates. The BEP
was defined from the ESP single phase efficiency curves for 83.7, 125.7 and 251.3 rad/s for 0.052 Pa.s oil viscosity. For
water/oil tests, the total flow rate was kept constant and the water cut was increased from zero to a hundred percent. The
Focused Beam Reflectance Measurement (FBRM) technique was used to obtain the chord length distribution at ESP
outlet. The phase inversion was detected at the ESP by a significant lift capacity variation for the three rotational speeds
tested. For the water-in-oil emulsion (oil as continuous phase), the ESP presented low lift capacity which was significantly
increased after the phase inversion point. For all ESP rotational speeds tested, the droplet chord length increased up to the
phase inversion point, dropping after it.
Keywords: chord length distribution, phase inversion, electrical submersible pumps, oil-water flow, emulsions
1. INTRODUCTION
One of the most used artificial lift method in oil exploration is the Electrical Submersible Pump (ESP) due to its great
production and wide application in several scenarios. Usually, the petroleum reservoirs are composed by crude oil-water-
gas mixtures and then, the ESP may operate with gas-liquid (oil-gas), liquid-liquid (oil-water) or liquid-liquid-gas (oil-
water-gas) mixtures. Understanding the ESP behavior for liquid-liquid mixtures is very important because it is the kind
of mixture observed in many industrial and natural processes. These mixtures are composed by two immiscible or low
immiscible phases which can be found in several geometric configurations of flow patterns. When these phases are
strongly mixed (dispersed flow pattern), the homogeneous mixture produced is denominated emulsion. Mixtures of water
and oil can produce two main types of emulsion: the water-in-oil, when the oil is the continuous phase and water is the
dispersed phase or the oil-in-water, when the water is a continuous phase and oil is the dispersed phase. The main property
affected by the continuous phase is the emulsion effective viscosity. Thus, it is necessary to determine the boundary that
separates the two kinds of emulsion, called phase inversion point. To analyze the ESP performance, it is necessary to
obtain and to understand the phase inversion due to its huge influence at effective viscosity that affects directly the ESP
efficiency.
The influence of emulsion flow inside pumps on ESP performance is not still well known. When the operating point
is oil-in-water, the performance become similar to that observed in water single phase flow. But, if the ESP operates with
water-in-oil emulsion or high viscous oil, the ESP performance suffers a significant degradation.
The analyses of ESPs operating with emulsions is recent, thus, there is a lack of references in literature covering this
topic. On the other hand, the oil-water flow in pipes has been investigated by research studies (Arirachakaranet al., 1989;
Ioannouet al., 2004; Guetet al., 2006; Ngan et al., 2009; Plasenciaet al., 2013). The authors observed a sudden drop in
friction pressure gradient due to the effective viscosity decreasing, when the continuous phase changed from oil to water.
Some studies have involved droplet size distribution and oil/water emulsion effective viscosity in centrifugal pumps,
such as Khalil et al.,(2006); Ibrahim and Maloka, (2006); Khalil et al., (2008) and Morales et al., (2012). The viscosity
of stable and unstable emulsions was analyzed by Khalil et al. (2006). These data were used in a later study (Khalil et al.,
2008) in which the emulsion viscosity was the main factor affecting the performance of a centrifugal pump. Khalil et al.
(2006) concluded that the viscosity of an unstable emulsion is smaller than that for a stable one. The possible reason for
2. 9th World Conference on Experimental Heat Transfer, Fluid Mechanics and Thermodynamics
12-15 June, 2017, Iguazu Falls, Brazil
that is that the surfactants added to the system caused the reduction of internal droplet recirculation, making the droplets
behave like rigid spheres, increasing the emulsion viscosity.
One of the first studies about droplet size characterization of oil/water dispersion in centrifugal pumps was realized
by Ibrahim and Maloka (2006). They analyzed a daughter droplet size distribution occurring at the centrifugal pump. The
authors proposed a correlation for the characteristic diameters of daughter droplet size distribution as a function of the
inlet distribution.
Khalil et al. (2008) performed an experimental investigation about the centrifugal pump performance operating with
oil/water emulsions flow. Using a mineral oil and tap water, it was prepared three different emulsions with water cut from
100 to 35%. Two sets were prepared with surfactants producing stable emulsions and one without surfactant. It was
observed that the flow rate, head and efficiency of the pump decreased when the centrifugal pump was operating with
emulsion flow. The performance reduction was more significant for the stable than for the unstable emulsion. The type
of surfactant used also affected the performance.
The study of Morales et al. (2012) was the first report in which was studied the droplet formation phenomenon in
oil/water flow in a centrifugal pump. The droplet size distribution was measured at the pump outlet for the oil-in-water
flow as a function of the water cut, pump rotational speed and mixture flow rate. They observed that the increase in pump
rotational speed caused a decrease in droplet size. The author also noticed that the effects of mixture flow rate, water cut
and inlet droplet size distribution could be negligible. The main mechanism of droplet formation was the turbulent breakup
when the water was the continuous phase. A mechanistic model was developed to predict the droplet size distribution,
presenting a reasonable agreement with the experimental data.
There are many techniques to measure particle size, such as particle video microscope (PVM), laser diffraction, laser
reflection, microscopy and ultrasound. The techniques most applied for in situ measurements are the particle video
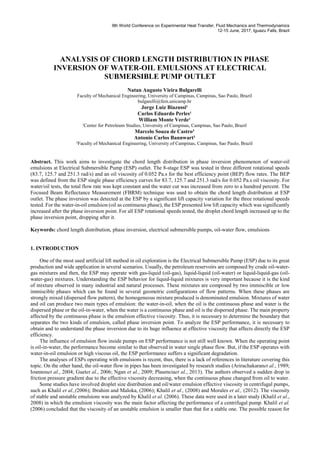
microscope (PVM) and the focused beam reflectance measurement (FBRM). The FBRM probe (Fig. 2a) was inserted
against the flow direction, forcing the emulsion flow pass in front of the probe window where occurs the measurement
(Fig. 2b). A laser beam goes through a rotational optics at a fixed velocity (2 m/s proximally) passes through a sapphire
window scanning the emulsion flow (Fig. 2b). The particles hit by the laser beam reflect the light back to the detector.
Thus, the chord length distribution is determined by multiplying the optical rotational speed and the reflective time, as
shown in Fig. 2c. In this work, it was used a FBRM probe of Mettler-Toledo ParticleTrack™G600 particle size analyzer.
Figure 1. (a) Focused Beam Reflectance Measurement (FBRM) probe. (b) Particles scanning process. (c) Chord lengths
obtained by FBRM technique. (Mettler-Toledo ParticleTrack™, 2013)
Helthet al. (2002), Li et al. (2005) and Greaves et al. (2008) compared the chord length distribution measured using
the FBRM probe and reference techniques, such as microscopy, laser diffraction and PVM. The effect of the focal point,
agitation speed, particle properties and suspension volume fraction on the measured FBRM chord length distribution of
weighting the distribution was analyzed by Helth et al.(2002). The authors observed a satisfactory agreement between
the mean of square-weighted chord lengths and the real mean droplet diameter measured by other sizing techniques in
the range of 50-400μm. They suggested the use of length weightings model for smaller sizes (< 50μm) and cube
weightings model for larger sizes (> 400μm). Helthet al. (2002) also observed that moving the focal point deeper into the
fluid the count of measured longer chords increased because of the difficulty of larger particles to get closer the
measurement window.
Li et al. (2005) compared the FBRM technique with other three sizing techniques: ultrasonic attenuation, image
analysis of microscope photographs and laser diffraction. The authors verified that the chord length distribution by FBRM
technique is very complex because it is also affected by shape and optical properties of the interface. This dependency is
more significant for small particles (< 20μm) due to backscattering effects.
Instead of the real droplet size, the FBRM technique provides the chord length distribution. For this reason, Greaves
et al. (2008) studied the accuracy of the FBRM probe. They used the particle video microscope (PVM) probe to test the
FBRM results accuracy. The results of FBRM were underestimated for emulsion systems and overestimated for larger
(a) (b) (c)
3. 9th World Conference on Experimental Heat Transfer, Fluid Mechanics and Thermodynamics
12-15 June, 2017, Iguazu Falls, Brazil
glass particles in comparison to PVM. The authors concluded that the FBRM can precisely detect system changes such
as particle size variations.
The FBRM was applied to study the droplet size distribution in water/crude oil emulsions (Plasencia et al., 2013).
Using six different crude oils in a range of 4.8 - 23.5 Pa.s of viscosity, Plasencia et al. (2013) carried out a comparative
study of the water-in-crude oil emulsions pipe flow in a small flow loop. They calculated the effective viscosity by
pressure drop measurement. The phase inversion point and the in-situ droplet size distribution were measured using a
FBRM technique. Plasencia et al. (2013) observed a similar increase of emulsion viscosity for six crude oils up to 30%
of water cut, from which the viscosity differences increased. They noticed the formation of smaller droplets with the
increase of shear rates caused by mixture velocity. With the increase of water cut and with the phase inversion point
approach, larger droplets were produced.
In this work, the experimental data was collected at LabPetro - Experimental Laboratory of Petroleum "Dr. Kelsen
Valente" at University of Campinas - Brazil in a flow loop facility specially designed for ESP performance testing with
oil-water emulsion flow. This investigation aims evaluate qualitatively the influence of the chord length distribution in
phase inversion phenomenon. The 8-stage ESP was tested in three different rotational speeds (83.7, 125.7 and 251.3 rad/s)
and a 0.052 Pa.s oil for its best efficiency point (BEP) flow rates. The total flow rate was kept constant and the water cut
were increased from zero to a hundred percent.
2. METHODS ANDEXPERIMENTAL PROCEDURE
2.1. Single phase tests
Firstly, the efficiency of the ESP was obtained for the pure oil at 0.052 Pa.s oil viscosity and in three ESP rotational
speeds (83.7, 125.7, 251.3 rad/s). The efficiency curve shows the ESP efficiency as a function of the dimensionless flow
rate, keeping the temperature and ESP rotational speed constant and varying the total flow rate.
This curve provides as result the ESP best efficiency point (BEP), which corresponds to the maximum efficiency point
of the ESP. The viscosity and rotational speed directly affects the efficiency curve. Thus, the BEP changes for each
operating condition.
Dimensionless analysis is usually applied to analyze and compare different total flow rates and rotational speeds in
centrifugal pumps. The Buckingham’s Pi Theorem can be applied to determine the dimensionless head (𝛹𝑚), Eq. (1), and
the dimensionless flow rate (𝛷), Eq.(2).
𝛹𝑚 =
∆𝑃
𝜔2𝐷2 (1)
𝛷 =
𝑞
𝜔𝐷3 (2)
Where: ∆𝑃 is the differential pressure between ESP inlet and outlet, 𝜔 is the ESP rotational speed, 𝐷 is the ESP diameter
and 𝑞 is the mixture total flow rate.
The elevation and the dynamic pressure between the inlet and outlet of the pump are negligible, so the static pressure
difference is used to calculate the dimensionless head.
The ESP efficiency (𝜂), Eq. (3), is calculated by the ratio between the hydraulic power and shaft power (𝑊
𝑠
̇ ). The
emulsion density (𝜌𝑒), Eq. (4), can be obtained using the no-slip homogeneous model (Rodriguez and Oliemans, 2006).
Thus, the volumetric concentration of water (𝐶𝑤), Eq. (5), can be calculated by the ratio between water flow rate and
mixture total flow rate (oil flow rate plus water flow rate).
𝜂 =
𝜌𝑒𝑞∆𝑃
𝑊
𝑠
̇
(3)
𝜌𝑒 = 𝐶𝑤𝜌𝑤 + (1 − 𝐶𝑤)𝜌𝑜 (4)
𝐶𝑤 =
𝑞𝑤
𝑞
=
𝑞𝑤
𝑞𝑤 + 𝑞𝑜
(5)
Where: 𝜌𝑤 is the water density, 𝜌𝑜 is the oil density, 𝑞𝑤is the water flow rate and 𝑞𝑜is the oil flow rate.
4. 9th World Conference on Experimental Heat Transfer, Fluid Mechanics and Thermodynamics
12-15 June, 2017, Iguazu Falls, Brazil
2.2. Two phase tests with chord length distribution
It was carried out tests with a 0.052 Pa.s mineral oil in three ESP rotational speeds (83.7, 125.7 and 251.3 rad/s). The
standard test procedure started with oil and finished with water as continuous phase. Figure 2 shows the experimental
flow loop configuration used for the oil/water flow tests.
Figure 2. Experimental flow loop.
In these tests, to improve the control of mixture temperature, the fluids were mixed at the oil and water line
intersection before to the ESP input. After the mixing, the emulsion flows through 15 meter 3 inch pipe and reaches 8-
stage ESP and flow back in the return line (oil + water) that connects it with the oil/water separator tank. The control
temperature was the inlet ESP temperature (Ti).
The oil injection was carried out by a progressive cavity pump (booster 2) and the water by a centrifugal pump
(booster 3). Before mixing the oil and water, the water content in the oil flow was measured by using a water cut meter
present in the oil line. Afterwards, the water was added until the desired water cut was reached. For each acquisition data
point, it was necessary to wait the stabilization of the temperature and the ESP performance.
The chord length distribution at ESP outlet was obtained by a FBRM/Mettler™ probe. The outlet samples were
acquired using on/off valve. A Coriolis was used to keep constant the emulsion flow rate along the data acquisition.
3. RESULTS AND DISCUTIONS
3.1. ESP Single-phase curves with pure oil
The ESP efficiency curves were obtained for the three ESP rotation speeds tested at one oil viscosity (0.052±1 Pa.s).
At the flow loop facility, the oil viscosity was controlled by changing the temperature so it was necessary to know the oil
viscosity variation with temperature. The viscosity as a function of temperature was measured by using a rheometer
(Figure 3). The polynomial function fitted in this curve was applied to calculate the oil viscosity.
5. 9th World Conference on Experimental Heat Transfer, Fluid Mechanics and Thermodynamics
12-15 June, 2017, Iguazu Falls, Brazil
Figure 3. Oil viscosity as a function of temperature.
Figure 4 presents the ESP efficiency curves for three rotational speeds for 0.052±0.001 Pa.s oil. Based on these curves
it is possible to define the BEP for each rotational speed, as presented in Table 1.
Figure 4. Comparison of ESP efficiency as a function of dimensionless flow rate between 83.7, 125.7 and 251.3 rad/s
ESP rotational speeds for 0.052 Pa.s oil viscosity.
6. 9th World Conference on Experimental Heat Transfer, Fluid Mechanics and Thermodynamics
12-15 June, 2017, Iguazu Falls, Brazil
Table 1. Matrix of experimental tests.
Oil Viscosity
[Pa.s]
Rotational speed
[rad/s]
Total flow rate
(BEP) [m³/h]
0.052 ± 0.001
83.7 10.78
125.7 16.79
251.3 33.70
3.2. Effect of phase inversion in ESP head
Figure 5 shows the dimensionless head as a function of the water cut for ESP rotational speeds and oil viscosity
tested. The rotational speed, the total flow rate and the inlet temperature were kept constant during the experiments. Then,
the head behavior of the ESP were compared among the three ESP rotational speeds.
The water cut was increased from zero to a hundred percent in all tests. The phase inversion point at ESP was detected
through the lift capacity shift (dimensionless head shift). For the lower water cut values (oil as continuous phase) it was
observed a low ESP lift capacity. After the phase inversion point (water as a continuous phase), the head increased for all
ESP rotational speeds.
For all experiments it was observed that the head was strongly affected in the lower water cut values, what was
attributed to the increase of the emulsion effective viscosity when the oil is the continuous phase. These both
dimensionless head levels define the phase inversion point of the emulsion in the ESP. The phase inversion happens at
same point regardless of the ESP rotational speed and total flow rate.
Figure 5. Dimensionless head as a function of water cut at 0.052Pa.s for 83.7, 125.7 and 251.3 rad/s.
In Figure 5, it can be noticed that before phase inversion the ESP head improve with the rotational speed increase.
This happens due to high effective viscosity for the systems in which the oil is the continuous phase and then, the ESP’s
lift capacity is heavily affected by viscous flow (Reynolds number). Above the phase inversion point, the effective
viscosity decreased abruptly and the dimensionless flow rate affected the ESP lift capacity.
3.2. Chord length distribution “in situ” in phase inversion point at ESP outlet
The chord length distribution in situ in ESP outlet was obtained for three ESP rotational speeds and oil viscosity
tested using the FBRM/Mettler® probe. The percentage referring to total counts of particles and the cumulative
probability were used to analyze the chord length distribution. The standard test started with oil as continuous phase and
finished with water as continuous phase. The chord length distribution analyses were qualitative.
7. 9th World Conference on Experimental Heat Transfer, Fluid Mechanics and Thermodynamics
12-15 June, 2017, Iguazu Falls, Brazil
The percentage of total counts of particles as a function of the chord length in different water cut for three rotational
speeds at one viscosity allowed observing how the droplet size and size distribution parameters were affected for each
rotation and viscosity. The cumulative probability was used to verify the width of the droplet distribution.
Figure 6, 7 and 8 shows the percentage referring to total counts of particles as a function of the chord length in ESP
outlet. The phase inversion was found in, approximately, 30% water cut for these conditions.
Figure 6. Chord length distribution outlet for ESP rotational speed of 83.7 rad/s at 0.052 Pa.s.
Figure 7. Chord length distribution outlet for ESP rotational speed of 125.7 rad/s at 0.052 Pa.s.
8. 9th World Conference on Experimental Heat Transfer, Fluid Mechanics and Thermodynamics
12-15 June, 2017, Iguazu Falls, Brazil
Figure 8. Chord length distribution outlet for ESP rotational speed of 251.3 rad/s at 0.052 Pa.s.
At the ESP outlet, the chord length with the highest percentage was about the same for the three rotations (around 3
micrometer) before the phase inversion (oil as continuous phase). For the three rotations, the chord length increased
significantly water cut values close the phase inversion point. The chord length distribution was different for each ESP
rotational speed for water-in-oil emulsion flow. The results clearly show that the predominant chord length in distribution
decreased with the increase in ESP rotational speed and total flow rate for water-in-oil flow.
The maximum chord length of the distribution was obtained by cumulative probability (Figure 9, 10 and 11).
Figure 9. Cumulative probability of droplet chord length for ESP rotational speed of 83.7 rad/s at 0.052 Pa.s.
9. 9th World Conference on Experimental Heat Transfer, Fluid Mechanics and Thermodynamics
12-15 June, 2017, Iguazu Falls, Brazil
Figure 10. Cumulative probability of droplet chord length for ESP rotational speed of 125.7 rad/s at 0.052 Pa.s.
Figure 11. Cumulative probability of droplet chord length for ESP rotational speed of 251.3 rad/s at 0.052 Pa.s.
The maximum chord length variation increased with the water up to the phase inversion point for three ESP rotational
speeds. After that, it decreased with increase in water cut. It can also be observed that the maximum chord length
decreased with the increase in ESP rotational speeds. Morales et al. (2013) presented a similar conclusion for centrifugal
pumps.
10. 9th World Conference on Experimental Heat Transfer, Fluid Mechanics and Thermodynamics
12-15 June, 2017, Iguazu Falls, Brazil
4. CONCLUSIONS
In this work it was performed an experimental study of phase inversion phenomenon in electrical submersible pumps
for oil-water two-phase flow. The droplet size distribution in the phase inversion phenomenon was investigated. An 8-
stage ESP was tested with three different rotational speeds (83.7, 125.7 e 251.3 rad/s) and 0.052 Pa.s oil viscosity for BEP
flow rates. The oil viscosity was controlled by changing its temperature at ESP inlet.
The lift capacity of the ESP was affected by the continuous phase. The chord length increased up to the phase inversion
point and decreased after it at ESP outlet for every rotational speed tested. Before the phase inversion point, the chord
length was related to the water droplets dispersed in oil, after it, oil droplets dispersed in water. Then, for the three ESP
rotational speeds tested, the oil droplets were larger than the water droplets.
Using the FBRM probe, it was possible to detect change on chord length distribution with water cut, oil viscosity and
ESP rotational speed at the ESP outlet. For the ESP outlet, smaller chord length was observed before the phase inversion
point (water-in-oil emulsion) and larger after it, for all rotations and oil viscosity tested. For the 0.052Pa.s oil viscosity,
the chord length distribution shifted to larger particle sizes up to phase inversion point and, afterwards, the particle sizes
decreased with the increase of water cut for ESP rotational speeds. This behavior was reflected in the maximum chord
length for 0.052 Pa.s oil viscosity.
The chord length distribution width (maximum chord length) decreases with the increase of ESP rotational speed at
0.052 Pa.s was also observed.
4. ACKNOWLEDGEMENTS
The authors thank Statoil Brazil, ANP ("Compromisso de Investimentos com Pesquisa e Desenvolvimento"),
PRH/ANP and for FAEPEX-UNICAMP providing financial support for this work. Acknowledgments are also extended
to CEPETRO/UNICAMP and ALFA – Artificial Lift & Flow Assurance Research Group.
5. REFERENCES
Arirachakaran, S., Oglesby, K. D., Malinawsky, M. S., Shoham, O. and Brill, J. P., 1989. “An analysis of oil/water flow
phenomena in horizontal pipes”. SPE paper 18836. SPE Prof. Prod. Operating Symp., Oklahoma.
Guet, S., Rodriguez O. M. H., Oliemans R. V. A. and Brauner N. “An inverse dispersed multiphase flow model for liquid
production rate determination”. International Journal Of Multiphase Flow, [s.l.], v. 32, n. 5, p.553-567, maio 2006.
Elsevier BV.http://dx.doi.org/10.1016/j.ijmultiphaseflow.2006.01.008.
Greaves, D.; Boxall, J.; Mulligan, J.; Montesi, A.; Creek, J.; Sloan, E. D. and Koh, C. A.. “Measuring the particle size of
a known distribution using the focused beam reflectance measurement technique”. Chemical Engineering Science,
[s.l.], v. 63, n. 22, p.5410-5419, nov. 2008. Elsevier BV. http://dx.doi.org/10.1016/j.ces.2008.07.023.
Heath, A.R., Fawell, P.D., Bahri, P.A, Swift, J.D., 2002. “Avarege particle size by focused beam reflectance measurement
(FBRM)”. Particle and Particle Systems Characterization 19, 84-95.
Ibrahim, S. and Moloka, I. 2006. “Emulsification of Secondary Oil/Water Dispersions Using a Centrifugal Pump”. Pet.
Sci. Technol. 24:513-522.
Ioannou, K., Hu, B., Matar, O. K., Hewitt, G. F. and Angeli, P. 2004, “Phase inversion in dispersed liquid-liquid pipe
flows”, 5th International Conference on Multiphase Flow Yokohama, Japan.
Khalil, M., Kassab, S., Ismail, A. And Elazab, I. 2006. “Influence of Various Parameters on the Characteristics of Stable
and Unstable Oil-in-Water Emulsion”. 8th International Conference of Fluid Dynamics and Propulsion, 14-17
December 2006, Sharm El-Sheikh, Sinai, Egypt
Khalil, M., Kassab, S., Ismail, A. And Elazab, I. 2008. “Centrifugal Pump Performance Under Stable and Unstable Oil-
Water Emulsions Flow Paper IWTC12 presented at the Twelfth International Water Technology Conference,
Alexandria, Egypt, 27-30 March.
Kokal, S., 2005. “Crude-oil emulsions, a state-of-the-art review”. SPE 77497-PA. Production and Facilities.
Li, M., Wilkinson, D., Patchigolla, K., 2005. “Comparison of particle size distributions measured using different
techniques”. Particle and Particle Systems Characterization 23, 265-284.
Mettler-Toledo ParticleTrack™ Product Group, 2013. ParticleTrack™ G600 Hardware Manual (MK-PB-0078-AC Rev
B).Mettler-Toledo AutoChem, Inc., Columbia, MD.
Morales, R., Pereyra, E., Wang, S. and Shoham, O.. “Droplet Formation Through Centrifugal Pumps for Oil-in-Water
Dispersions”. Spe Journal, [s.l.], v. 18, n. 01, p.172-178, 14 dez. 2012. Society of Petroleum Engineers (SPE).
Ngan, K. H., Ioannou, K., Rhyne, L. D., Wang, W. and Angeli, P. “A methodology for predicting phase inversion during
liquid–liquid dispersed pipeline flow”. Chemical Engineering Research And Design, [s.l.], v. 87, n. 3, p.318-324, mar.
2009. Elsevier BV.
Pal, R., 2001, “Single-parameter and two-parameter rheological equations of state for nondilute emulsions”. Ind Eng
Chem Res, 40: 5666-5674
11. 9th World Conference on Experimental Heat Transfer, Fluid Mechanics and Thermodynamics
12-15 June, 2017, Iguazu Falls, Brazil
Plasencia, J., Pettersen, B. and Nydal, O. J.. “Pipe flow of water-in-crude oil emulsions: Effective viscosity, inversion
point and droplet size distribution”. Journal Of Petroleum Science And Engineering, [s.l.], v. 101, p.35-43, jan. 2013.
Elsevier BV.
Rodriguez, O.H.M, Oliemans, R.V.A., 2006. “Experimental study on oil-water flow in horizontal and slightly inclined
pipes”. Int. J. Multipahse Flow 32, 323-343.
Vieira, T. S., Siqueira, J. R., Bueno, A. D., Morales, R. E. M. and Estevam, V., “Analytical study of pressure losses and
fluid viscosity effects on pump performance during monophase flow inside an ESP stage”. Journal of Petroleum
Science and Engineering, [s.l.], v. 127, p.245-258, mar. 2015. Elsevier BV.
Yeh, G. C., Haynei, F. H., Jr. ande Moses, R. A., 1964, “Phase volume relationship at the point of phase inversion in
liquid dispersions”. AIChE J, 10(2): 260-265.