

Recommended
Recommended
More Related Content
Similar to 2019 no-fear-act-q1
Similar to 2019 no-fear-act-q1 (8)
More from https://www.cia.gov.com
More from https://www.cia.gov.com (20)
Recently uploaded
Recently uploaded (20)
2019 no-fear-act-q1
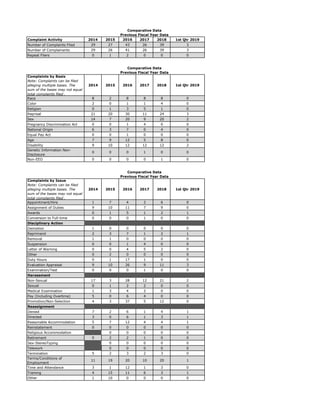
- 1. Comparative Data Previous Fiscal Year Data Complaint Activity 2014 2015 2016 2017 2018 1st Qtr 2019 Number of Complaints Filed 29 27 43 26 39 3 Number of Complainants 29 26 41 26 39 3 Repeat Filers 0 1 2 0 0 0 Comparative Data Previous Fiscal Year Data Complaints by Basis Note: Complaints can be filed alleging multiple bases. The sum of the bases may not equal total complaints filed . 2014 2015 2016 2017 2018 1st Qtr 2019 Race 8 2 8 8 8 0 Color 2 0 1 1 4 0 Religion 0 1 3 5 1 0 Reprisal 21 20 30 11 24 3 Sex 14 7 20 9 20 2 Pregnancy Discrimination Act 0 0 1 4 0 0 National Origin 6 3 7 0 4 0 Equal Pay Act 0 0 1 0 0 0 Age 7 9 12 5 8 0 Disability 9 10 12 12 12 2 Genetic Information Non- Disclosure 0 0 0 1 0 0 Non-EEO 0 0 0 0 1 0 Comparative Data Previous Fiscal Year Data Complaints by Issue Note: Complaints can be filed alleging multiple bases. The sum of the bases may not equal total complaints filed . 2014 2015 2016 2017 2018 1st Qtr 2019 Appointment/Hire 1 7 4 2 6 0 Assignment of Duties 9 10 11 7 9 0 Awards 0 1 5 1 2 1 Conversion to Full-time 0 0 0 1 0 0 Disciplinary Action Demotion 1 0 0 0 0 0 Reprimand 2 3 7 1 2 1 Removal 1 1 0 0 0 0 Suspension 0 0 1 4 0 0 Letter of Warning 0 0 4 5 2 0 Other 0 2 0 0 0 0 Duty Hours 0 1 17 1 0 0 Evaluation Appraisal 9 10 26 9 11 3 Examination/Test 0 0 0 1 0 0 Harassment Non-Sexual 17 3 28 12 21 2 Sexual 0 1 2 2 0 0 Medical Examination 1 3 4 2 0 0 Pay (Including Overtime) 5 0 6 4 0 0 Promotion/Non-Selection 4 3 37 5 12 0 Reassignment Denied 7 2 6 1 4 1 Directed 3 0 6 1 3 1 Reasonable Accommodation 5 7 12 4 4 1 Reinstatement 0 0 0 0 0 0 Religious Accommodation 0 0 0 0 0 Retirement 0 2 2 1 0 0 Sex-StereoTyping 0 0 0 0 0 Telework 0 0 0 0 0 Termination 5 2 3 2 3 0 Terms/Conditions of Employment 11 19 20 10 20 1 Time and Attendance 3 1 12 1 3 0 Training 4 15 11 6 3 1 Other 1 10 0 0 0 0
- 2. Comparative Data Previous Fiscal Year Data Processing Time 2014 2015 2016 2017 2018 1st Qtr 2019 Complaints pending during fiscal year Average number of days in investigation stage 484.72 443 453 613 615 550 Average number of days in final action stage 61 34 72.5 63 58 59 Complaint pending during fiscal year where hearing was requested Average number of days in investigation stage 558.57 476.55 319.33 643 609 446 Average number of days in final action stage 415 0 94 0 40 0 Complaint pending during fiscal year where hearing was not requested Average number of days in investigation stage 451.77 426.33 433.66 604 661 689 Average number of days in final action stage 61 59.5 59.6 63 61 59 Comparative Data Previous Fiscal Year Data Complaints Dismissed by Agency 2014 2015 2016 2017 2018 1st Qtr 2019 Total Complaints Dismissed by Agency 4 5 12 13 6 0 Average days pending prior to dismissal 24.5 40 61 100 159 0 Complaints Withdrawn by Complainants Total Complaints Withdrawn by Complainants 0 0 2 2 3 1 Comparative Data Previous Fiscal Year Data Pending Complaints Filed in Previous Fiscal Years by Status 2014 2015 2016 2017 2018 1st Qtr 2019 Total complaints from previous Fiscal Years 50 31 50 70 46 73 Total Complainants 36 30 42 63 44 69 Number complaints pending Investigation 2 4 13 28 7 29 ROI Issued, Pending Complainants Action 5 0 0 1 1 2 Hearing 31 22 28 31 30 32 Final Action 10 1 2 4 1 3 Appeal with EEOC Office of Federal Operations 2 4 7 6 7 7 Comparative Data Previous Fiscal Year Data Complaint Investigations 2014 2015 2016 2017 2018 1st Qtr 2019 Pending Complaints Where Investigations Exceeds Required Time Frames 7 7 15 23 14 15
- 3. Comparative Data Previous Fiscal Year Data Total Final Actions Finding Discrimination 2014 # 2014 % 2015 # 2015 % 2016 # 2016 % 2017 # 2017 % 2018 # 2018 % 1st Qtr 2019 # 1st Qtr 2019 % Total Number Findings 0 0 0 1 0 0 Without Hearing 0 0 0 0 0 0 0 0 0 0 0 0 With Hearing 0 0 0 0 0 0 1 100% 0 0% 0 0% Comparative Data Previous Fiscal Year Data Findings of Discrimination Rendered by Basis Note: Complaints can be filed alleging multiple bases. The sum of the bases may not equal total complaints filed. 2014 # 2014 % 2015 # 2015 % 2016 # 2016 % 2017 # 2017 % 2018 # 2018 % 1st Qtr 2019 # 1st Qtr 2019 % Total Number Findings 0 0 0 1 0 0 Race 0 0 0 0 0 0 0 0 0 0 0 0 Color 0 0 0 0 0 0 0 0 0 0 0 0 Religion 0 0 0 0 0 0 0 0 0 0 0 0 Reprisal 0 0 0 0 0 0 1 100% 0 0 0 0 Sex 0 0 0 0 0 0 1 100% 0 0 0 0 Pregnancy Discrimination Act 0 0 0 0 0 0 0 0 0 0 0 0 National Origin 0 0 0 0 0 0 0 0 0 0 0 0 Equal Pay Act 0 0 0 0 0 0 0 0 0 0 0 0 Age 0 0 0 0 0 0 1 100% 0 0 0 0 Disability 0 0 0 0 0 0 1 100% 0 0 0 0 Genetic Information 0 0 0 0 0 0 0 0 0 0 0 0 Non-EEO 0 0 0 0 0 0 0 0 0 0 0 0 Findings After Hearing 0 0 0 1 0 0 Race 0 0 0 0 0 0 0 0 0 0 0 0 Color 0 0 0 0 0 0 0 0 0 0 0 0 Religion 0 0 0 0 0 0 0 0 0 0 0 0 Reprisal 0 0 0 0 0 0 1 100% 0 0 0 0 Sex 0 0 0 0 0 0 1 100% 0 0 0 0 Pregnancy Discrimination Act 0 0 0 0 0 0 0 0 0 0 0 0 National Origin 0 0 0 0 0 0 0 0 0 0 0 0 Equal Pay Act 0 0 0 0 0 0 0 0 0 0 0 0 Age 0 0 0 0 0 0 1 100% 0 0 0 0 Disability 0 0 0 0 0 0 1 100% 0 0 0 0 Genetic Information 0 0 0 0 0 0 0 0 0 0 0 0 Non-EEO 0 0 0 0 0 0 0 0 0 0 0 0 Findings Without Hearing 0 0 0 0 0 0 Race 0 0 0 0 0 0 0 0 0 0 0 0 Color 0 0 0 0 0 0 0 0 0 0 0 0 Religion 0 0 0 0 0 0 0 0 0 0 0 0 Reprisal 0 0 0 0 0 0 0 0 0 0 0 0 Sex 0 0 0 0 0 0 0 0 0 0 0 0 Pregnancy Discrimination Act 0 0 0 0 0 0 0 0 0 0 0 0 National Origin 0 0 0 0 0 0 0 0 0 0 0 0 Equal Pay Act 0 0 0 0 0 0 0 0 0 0 0 0 Age 0 0 0 0 0 0 0 0 0 0 0 0 Disability 0 0 0 0 0 0 0 0 0 0 0 0 Genetic Information 0 0 0 0 0 0 0 0 0 0 0 0 Non-EEO 0 0 0 0 0 0 0 0 0 0 0 0
- 4. Comparative Data Previous Fiscal Year Data Findings of Discrimination Rendered by Issue 2014 # 2014 % 2015 # 2015 % 2016 # 2016 % 2017 # 2017 % 2018 # 2018 % 1st Qtr 2019 # 1st Qtr 2019 % Total Number Findings 0 0 0 1 0 0 Appointment/Hire 0 0 0 0 0 0 0 0 0 0 0 0 Assignment of Duties 0 0 0 0 0 0 0 0 0 0 0 0 Awards 0 0 0 0 0 0 0 0 0 0 0 0 Conversion to Full-time 0 0 0 0 0 0 0 0 0 0 0 0 Disciplinary Action Demotion 0 0 0 0 0 0 0 0 0 0 0 0 Reprimand 0 0 0 0 0 0 0 0 0 0 0 0 Suspension 0 0 0 0 0 0 0 0 0 0 0 0 Removal 0 0 0 0 0 0 0 0 0 0 0 0 Disciplinary Warning 0 0 0 0 0 0 0 0 0 0 0 0 Duty Hours 0 0 0 0 0 0 0 0 0 0 0 0 Evaluation/Appraisal 0 0 0 0 0 0 0 0 0 0 0 0 Examination/Test 0 0 0 0 0 0 0 0 0 0 0 0 Harassment Non-Sexual 0 0 0 0 0 0 1 100% 0 0 0 0 Sexual 0 0 0 0 0 0 0 0 0 0 0 0 Medical Examination 0 0 0 0 0 0 0 0 0 0 0 0 Pay (Including Overtime) 0 0 0 0 0 0 0 0 0 0 0 0 Promotion/Non-Selection 0 0 0 0 0 0 0 0 0 0 0 0 Reassignment Denied 0 0 0 0 0 0 0 0 0 0 0 0 Directed 0 0 0 0 0 0 1 100% 0 0 0 0 Reasonable Accommodation Disability 0 0 0 0 0 0 0 0 0 0 0 0 Reinstatement 0 0 0 0 0 0 0 0 0 0 0 0 Religious Accommodation 0 0 0 0 0 0 0 0 0 0 0 0 Retirement 0 0 0 0 0 0 0 0 0 0 0 0 Sex-Stereotyping 0 0 0 0 0 0 0 0 0 0 0 0 Telework 0 0 0 0 0 0 0 0 0 0 0 0 Termination 0 0 0 0 0 0 0 0 0 0 0 0 Terms/Conditions of Employment 0 0 0 0 0 0 0 0 0 0 0 0 Time and Attendance 0 0 0 0 0 0 0 0 0 0 0 0 Training 0 0 0 0 0 0 0 0 0 0 0 0 Other 0 0 0 0 0 0 0 0 0 0 0 0 Findings After Hearing 0 0 0 1 0 0 Appointment/Hire 0 0 0 0 0 0 0 0 0 0 0 0 Assignment of Duties 0 0 0 0 0 0 0 0 0 0 0 0 Awards 0 0 0 0 0 0 0 0 0 0 0 0 Conversion to Full-time 0 0 0 0 0 0 0 0 0 0 0 0 Disciplinary Action Demotion 0 0 0 0 0 0 0 0 0 0 0 0 Reprimand 0 0 0 0 0 0 0 0 0 0 0 0 Suspension 0 0 0 0 0 0 0 0 0 0 0 0 Removal 0 0 0 0 0 0 0 0 0 0 0 0 Discipinary Warning 0 0 0 0 0 0 0 0 0 0 0 0 Duty Hours 0 0 0 0 0 0 0 0 0 0 0 0 Evaluation/Appraisal 0 0 0 0 0 0 0 0 0 0 0 0 Examination/Test 0 0 0 0 0 0 0 0 0 0 0 0 Harassment Non-Sexual 0 0 0 0 0 0 1 100% 0 0 0 0 Sexual 0 0 0 0 0 0 0 0 0 0 0 0 Medical Examination 0 0 0 0 0 0 0 0 0 0 0 0 Pay (Including Overtime) 0 0 0 0 0 0 0 0 0 0 0 0 Promotion/Non-Selection 0 0 0 0 0 0 0 0 0 0 0 0 Reassignment Denied 0 0 0 0 0 0 0 0 0 0 0 0 Directed 0 0 0 0 0 0 1 100% 0 0 0 0 Reasonable Accommodation 0 0 0 0 0 0 0 0 0 0 0 0 Reinstatement 0 0 0 0 0 0 0 0 0 0 0 0 Religious Accommodation 0 0 0 0 0 0 0 0 0 0 0 0 Retirement 0 0 0 0 0 0 0 0 0 0 0 0 Sex-Stereotyping 0 0 0 0 0 0 0 0 0 0 0 0 Telework 0 0 0 0 0 0 0 0 0 0 0 0 Termination 0 0 0 0 0 0 0 0 0 0 0 0 Terms/Conditions of Employment 0 0 0 0 0 0 0 0 0 0 0 0 Time and Attendance 0 0 0 0 0 0 0 0 0 0 0 0 Training 0 0 0 0 0 0 0 0 0 0 0 0 Other 0 0 0 0 0 0 0 0 0 0 0 0 Findings Without Hearing 0 0 0 0 0 0 Appointment/Hire 0 0 0 0 0 0 0 0 0 0 0 0 Assignment of Duties 0 0 0 0 0 0 0 0 0 0 0 0 Awards 0 0 0 0 0 0 0 0 0 0 0 0 Conversion to Full-time 0 0 0 0 0 0 0 0 0 0 0 0 Disciplinary Action Demotion 0 0 0 0 0 0 0 0 0 0 0 0 Reprimand 0 0 0 0 0 0 0 0 0 0 0 0 Suspension 0 0 0 0 0 0 0 0 0 0 0 0 Removal 0 0 0 0 0 0 0 0 0 0 0 0 Disciplinary Warning 0 0 0 0 0 0 0 0 0 0 0 0 Duty Hours 0 0 0 0 0 0 0 0 0 0 0 0 Evaluation/Appraisal 0 0 0 0 0 0 0 0 0 0 0 0 Examination/Test 0 0 0 0 0 0 0 0 0 0 0 0 Harassment Non-Sexual 0 0 0 0 0 0 0 0 0 0 0 0 Sexual 0 0 0 0 0 0 0 0 0 0 0 0 Medical Examination 0 0 0 0 0 0 0 0 0 0 0 0 Pay (Including Overtime) 0 0 0 0 0 0 0 0 0 0 0 0 Promotion/Non-Selection 0 0 0 0 0 0 0 0 0 0 0 0 Reassignment Denied 0 0 0 0 0 0 0 0 0 0 0 0 Directed 0 0 0 0 0 0 0 0 0 0 0 0 Reasonable Accommodation 0 0 0 0 0 0 0 0 0 0 0 0 Reinstatement 0 0 0 0 0 0 0 0 0 0 0 0 Religious Accommodation 0 0 0 0 0 0 0 0 0 0 0 0 Retirement 0 0 0 0 0 0 0 0 0 0 0 0 Sex-Stereotyping 0 0 0 0 0 0 0 0 0 0 0 0 Telework 0 0 0 0 0 0 0 0 0 0 0 0 Termination 0 0 0 0 0 0 0 0 0 0 0 0 Terms/Conditions of Employment 0 0 0 0 0 0 0 0 0 0 0 0 Time and Attendance 0 0 0 0 0 0 0 0 0 0 0 0 Training 0 0 0 0 0 0 0 0 0 0 0 0 Other 0 0 0 0 0 0 0 0 0 0 0 0