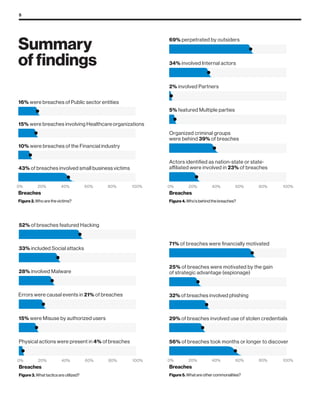
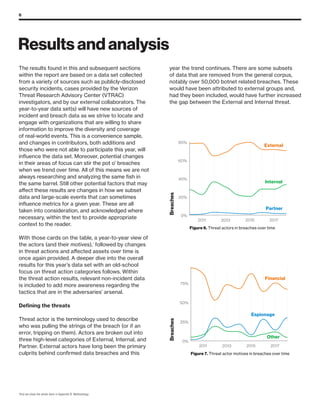
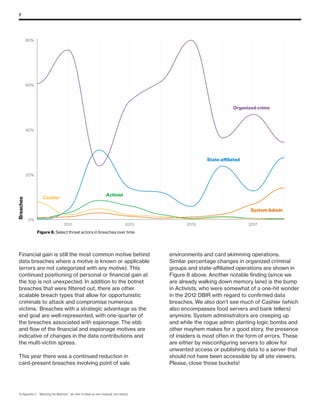
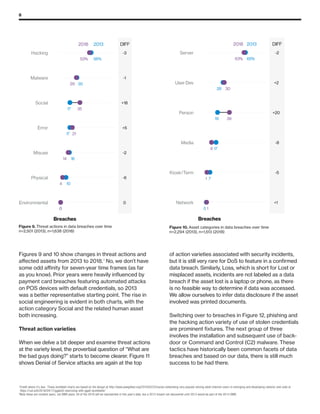
2019 Data Breach
Investigations
Report
business ready
4e
6f
20
63
6f
76
65
72
20
63
68
61
6c
6c
65
6e
67
65
20
74
68
69
73
20
79
65
61
72
2
Server (All breaches, n=1,881)
Server (Just large organization breaches, n=335)
Breaches
Figure 1. Top asset variety in breaches
0% 20% 40% 60% 80% 100%
Before we formally introduce you to the 2019 Data Breach Investigations Report (DBIR),
let us get some clarifications out of the way first to reduce potential ambiguity around terms,
labels, and figures that you will find throughout this study.
VERIS resources
The terms “threat actions,” “threat actors,” “varieties,” and “vectors”
will be referenced a lot. These are part of the Vocabulary for Event
Recording and Incident Sharing (VERIS), a framework designed to
allow for a consistent, unequivocal collection of security incident
details. Here are some select definitions followed by links with
more information on the framework and on the enumerations.
Threat actor:
Who is behind the event? This could be the external “bad guy”
that launches a phishing campaign, or an employee who leaves
sensitive documents in their seat back pocket.
Threat action:
What tactics (actions) were used to affect an asset? VERIS uses
seven primary categories of threat actions: Malware, Hacking,
Social, Misuse, Physical, Error, and Environmental. Examples at a
high level are hacking a server, installing malware, and influencing
human behavior.
Variety:
More specific enumerations of higher level categories - e.g.,
classifying the external “bad guy” as an organized criminal group,
or recording a hacking action as SQL injection or brute force.
Learn more here:
•	github.com/vz-risk/dbir/tree/gh-pages/2019 – DBIR figures and
figure data.
•	veriscommunity.net features information on the framework with
examples and enumeration listings.
•	github.com/vz-risk/veris features the full VERIS schema.
•	github.com/vz-risk/vcdb provides access to our database on
publicly disclosed breaches, the VERIS Community Database.
•	http://veriscommunity.net/veris_webapp_min.html
allows you to record your own incidents and breaches. Don’t fret,
it saves any data locally and you only share what you want.
Incident vs. breaches
We talk a lot about incidents and breaches and we use the
following definitions:
Incident:
A security event that compromises the integrity, confidentiality
or availability of an information asset.
Breach:
An incident that results in the confirmed disclosure—not just
potential exposure—of data to an unauthorized party.
Industry labels
We align with the North American Industry Classification
System (NAICS) standard to categorize the victim organizations
in our corpus. The standard uses 2 to 6 digit codes to classify
businesses and organizations. Our analysis is typically done at
the 2-digit level and we will specify NAICS codes along with an
industry label. For example, a chart with a label of Financial (52)
is not indicative of 52 as a value. 52 is the NAICS code for the
Finance and Insurance sector. The overall label of “Financial” is
used for brevity within the figures. Detailed information on the
codes and classification system is available here:
https://www.census.gov/cgi-bin/sssd/naics/naicsrch?chart=2017
This year we’re putting it in the bar charts. The black dot is the
value, but the slope gives you an idea of where the real value could
be between. In this sample figure we’ve added a few red bars to
highlight it, but in 19 bars out of 20 (95%),1
the real number will
be between the two red lines on the bar chart. Notice that as the
sample size (n) goes down, the bars get farther apart. If the lower
bound of the range on the top bar overlaps with the higher bound of
the bar beneath it, they are treated as statistically similar and thus
statements that x is more than y will not be proclaimed.
Questions? Comments? Brilliant ideas?
We want to hear them. Drop us a line at dbir@verizon.com,
find us on LinkedIn, tweet @VZEnterprise with the #dbir.
Got a data question? Tweet @VZDBIR!
A couple of tidbits
Figure 1. Top asset variety in breaches
1
https://en.wikipedia.org/wiki/Confidence_interval
New chart, who dis?
You may notice that the bar chart shown may not be as, well, bar-
ish as what you may be used to. Last year we talked a bit in the
Methodology section about confidence. When we say a number is
X, it’s really X +/- a small amount.
3
Table of contents
Introduction	4
Summary of findings	 5
Results and analysis	 6
Unbroken chains	 20
Incident classification patterns and subsets	 24
Data breaches: extended version	 27
Victim demographics and industry analysis	 30
Accommodation and Food Services	 35
Educational Services	 38
Financial and Insurance	 41
Healthcare	44
Information	46
Manufacturing	49
Professional, Technical and Scientific Services	 52
Public Administration	 55
Retail	58
Wrap up	 61
Year in review	 62
Appendix A: Transnational hacker debriefs	 65
Appendix B: Methodology	 68
Appendix C: Watching the watchers	 71
Appendix D: Contributing organizations	 75
4
Introduction
2
If you didn’t expect a Stan Lee reference in this report, then you are certainly a first-time reader. Welcome to the party pal!
Welcome! Pull up a chair with the 2019 Verizon
Data Breach Investigations Report (DBIR).
The statements you will read in the pages that follow
are data-driven, either by the incident corpus that
is the foundation of this publication, or by non-incident
data sets contributed by several security vendors.
This report is built upon analysis of 41,686 security
incidents, of which 2,013 were confirmed data
breaches. We will take a look at how results are
changing (or not) over the years as well as digging
into the overall threat landscape and the actors,
actions, and assets that are present in breaches.
Windows into the most common pairs of threat
actions and affected assets also are provided.
This affords the reader with yet another means to
analyze breaches and to find commonalities above
and beyond the incident classification patterns that
you may already be acquainted with.
Fear not, however. The nine incident classification
patterns are still around, and we continue to focus on
how they correlate to industry. In addition to the nine
primary patterns, we have created a subset of data to
pull out financially-motivated social engineering (FMSE)
attacks that do not have a goal of malware installation.
Instead, they are more focused on credential theft and
duping people into transferring money into adversary-
controlled accounts. In addition to comparing industry
threat profiles to each other, individual industry
sections are once again front and center.
Joining forces with the ever-growing incident/breach
corpus, several areas of research using non-incident
data sets such as malware blocks, results of phishing
training, and vulnerability scanning are also utilized.
Leveraging, and sometimes combining, disparate data
sources (like honeypots and internet scan research)
allows for additional data-driven context.
It is our charge to present information on the common
tactics used by attackers against organizations in
your industry. The purpose of this study is not to
rub salt in the wounds of information security, but to
contribute to the “light” that raises awareness and
provides the ability to learn from the past. Use it as
another arrow in your quiver to win hearts, minds, and
security budget. We often hear that this is “required
reading” and strive to deliver actionable information in
a manner that does not cause drowsiness, fatigue,
or any other adverse side effects.
We continue to be encouraged and energized by
the coordinated data sharing by our 73 data sources,
66 of which are organizations external to Verizon.
This community of data contributors represents an
international group of public and private entities willing
to support this annual publication. We again thank
them for their support, time, and, of course, DATA.
We all have wounds, none of us knows everything,
let’s learn from each other.
Excelsior!2
“The wound is the place where the light enters you.”
— Rumi
5
Summary
of findings
43% of breaches involved small business victims
10% were breaches of the Financial industry
15% were breaches involving Healthcare organizations
16% were breaches of Public sector entities
Breaches
Figure 2. Who are the victims?
0% 20% 40% 60% 80% 100%
Physical actions were present in 4% of breaches
15% were Misuse by authorized users
Errors were causal events in 21% of breaches
28% involved Malware
33% included Social attacks
52% of breaches featured Hacking
Breaches
Figure 3. What tactics are utilized?
0% 20% 40% 60% 80% 100%
Actors identified as nation-state or state-
affiliated were involved in 23% of breaches
Organized criminal groups
were behind 39% of breaches
Breaches
Figure 4. Who's behind the breaches?
5% featured Multiple parties
2% involved Partners
34% involved Internal actors
69% perpetrated by outsiders
0% 20% 40% 60% 80% 100%
56% of breaches took months or longer to discover
29% of breaches involved use of stolen credentials
32% of breaches involved phishing
25% of breaches were motivated by the gain
of strategic advantage (espionage)
71% of breaches were financially motivated
Breaches
Figure 5. What are other commonalities?
0% 20% 40% 60% 80% 100%
6
The results found in this and subsequent sections
within the report are based on a data set collected
from a variety of sources such as publicly-disclosed
security incidents, cases provided by the Verizon
Threat Research Advisory Center (VTRAC)
investigators, and by our external collaborators. The
year-to-year data set(s) will have new sources of
incident and breach data as we strive to locate and
engage with organizations that are willing to share
information to improve the diversity and coverage
of real-world events. This is a convenience sample,
and changes in contributors, both additions and
those who were not able to participate this year, will
influence the data set. Moreover, potential changes
in their areas of focus can stir the pot o’ breaches
when we trend over time. All of this means we are not
always researching and analyzing the same fish in
the same barrel. Still other potential factors that may
affect these results are changes in how we subset
data and large-scale events that can sometimes
influence metrics for a given year. These are all
taken into consideration, and acknowledged where
necessary, within the text to provide appropriate
context to the reader.
With those cards on the table, a year-to-year view of
the actors (and their motives),3
followed by changes
in threat actions and affected assets over time is
once again provided. A deeper dive into the overall
results for this year’s data set with an old-school
focus on threat action categories follows. Within
the threat action results, relevant non-incident data
is included to add more awareness regarding the
tactics that are in the adversaries’ arsenal.
Defining the threats
Threat actor is the terminology used to describe
who was pulling the strings of the breach (or if an
error, tripping on them). Actors are broken out into
three high-level categories of External, Internal, and
Partner. External actors have long been the primary
culprits behind confirmed data breaches and this
year the trend continues. There are some subsets
of data that are removed from the general corpus,
notably over 50,000 botnet related breaches. These
would have been attributed to external groups and,
had they been included, would have further increased
the gap between the External and Internal threat.
Financial
Other
Espionage
0%
25%
50%
75%
Breaches
Figure 7. Threat actor motives in breaches over time
2011 20172013 2015
External
Internal
Partner
0%
20%
40%
60%
80%
Breaches
Figure 6. Threat actors in breaches over time
2011 20172013 2015
Results and analysis
3
And we show the whole deck in Appendix B: Methodology.
7
State-affiliated
Activist
System Admin
Cashier
Organized crime
0%
20%
40%
60%
80%
2011 2013 2015 2017
Breaches
Figure 8. Select threat actors in breaches over time
Financial gain is still the most common motive behind
data breaches where a motive is known or applicable
(errors are not categorized with any motive). This
continued positioning of personal or financial gain at
the top is not unexpected. In addition to the botnet
breaches that were filtered out, there are other
scalable breach types that allow for opportunistic
criminals to attack and compromise numerous
victims.4
Breaches with a strategic advantage as the
end goal are well-represented, with one-quarter of
the breaches associated with espionage. The ebb
and flow of the financial and espionage motives are
indicative of changes in the data contributions and
the multi-victim sprees.
This year there was a continued reduction in
card-present breaches involving point of sale
environments and card skimming operations.
Similar percentage changes in organized criminal
groups and state-affiliated operations are shown in
Figure 8 above. Another notable finding (since we
are already walking down memory lane) is the bump
in Activists, who were somewhat of a one-hit wonder
in the 2012 DBIR with regard to confirmed data
breaches. We also don’t see much of Cashier (which
also encompasses food servers and bank tellers)
anymore. System administrators are creeping up
and while the rogue admin planting logic bombs and
other mayhem makes for a good story, the presence
of insiders is most often in the form of errors. These
are either by misconfiguring servers to allow for
unwanted access or publishing data to a server that
should not have been accessible by all site viewers.
Please, close those buckets!
4
In Appendix C: “Watching the Watchers”, we refer to these as zero-marginal cost attacks.
8
20132018
0
10
16
17
17
30
56%
0
4
14
21
35
29
53%
0
-6
-2
+5
+18
-1
-3
DIFF
Environmental
Physical
Misuse
Error
Social
Malware
Hacking
Breaches
Figure 9. Threat actions in data breaches over
time n=2,501 (2013), n=1638 (2018)
20132018
0
7
17
19
28
65%
1
1
9
39
30
63%
+1
-5
-8
+20
+2
-2
DIFF
Network
Kiosk/Term
Media
Person
User Dev
Server
Breaches
Figure 10. Asset categories in data breaches over
time n=2,294 (2013), n=1,513 (2018)
Figures 9 and 10 show changes in threat actions and
affected assets from 2013 to 2018.5,6
No, we don’t have
some odd affinity for seven-year time frames (as far
as you know). Prior years were heavily influenced by
payment card breaches featuring automated attacks
on POS devices with default credentials, so 2013
was a better representative starting point. The rise in
social engineering is evident in both charts, with the
action category Social and the related human asset
both increasing.
Threat action varieties
When we delve a bit deeper and examine threat actions
at the variety level, the proverbial question of “What are
the bad guys doing?” starts to become clearer. Figure 11
shows Denial of Service attacks are again at the top
of action varieties associated with security incidents,
but it is still very rare for DoS to feature in a confirmed
data breach. Similarly, Loss, which is short for Lost or
misplaced assets, incidents are not labeled as a data
breach if the asset lost is a laptop or phone, as there
is no feasible way to determine if data was accessed.
We allow ourselves to infer data disclosure if the asset
involved was printed documents.
Switching over to breaches in Figure 12, phishing and
the hacking action variety of use of stolen credentials
are prominent fixtures. The next group of three
involves the installation and subsequent use of back-
door or Command and Control (C2) malware. These
tactics have historically been common facets of data
breaches and based on our data, there is still much
success to be had there.
5
Credit where it’s due. These dumbbell charts are based on the design at http://www.pewglobal.org/2016/02/22/social-networking-very-popular-among-adult-internet-users-in-emerging-and-developing-nations/ and code at
https://rud.is/b/2016/04/17/ggplot2-exercising-with-ggalt-dumbbells/
6
Note these are incident years, not DBIR years. All of the 2018 will be represented in this year’s data, but a 2012 breach not discovered until 2013 would be part of the 2014 DBIR.
Figure 9. Threat actions in data breaches over time
n=2,501 (2013), n=1,638 (2018)
Figure 10. Asset categories in data breaches over time
n=2,294 (2013), n=1,513 (2018)
9
Adware
Adminware
Data mishandling
Pretexting
Spyware/Keylogger
Use of backdoor or C2
Backdoor
Privilege abuse
Ransomware
Use of stolen creds
Phishing
Misdelivery
C2
Loss
DoS
Incidents
Figure 11. Top threat action varieties in incidents, (n=17,310)
0% 20% 40% 60% 80% 100%
Misconfiguration
Exploit vuln
Pretexting
Publishing error
Adminware
Data mishandling
Capture app data
Misdelivery
Spyware/Keylogger
Privilege abuse
Use of backdoor or C2
C2
Backdoor
Use of stolen creds
Phishing
Breaches
Figure 12. Top threat action varieties in breaches (n=1,774)
0% 20% 40% 60% 80% 100%
10
Physical access
3rd party desktop
Command shell
Partner
VPN
Other
Desktop sharing software
Desktop sharing
Backdoor or C2
Web application
Breaches
Figure 14. Top hacking action vectors in breaches (n=862)
0% 20% 40% 60% 80% 100%
Other
SQLi
RFI
Abuse of functionality
Buffer overflow
Brute force
Exploit vuln
Use of backdoor or C2
Use of stolen creds
Breaches
Figure 13. Top hacking action varieties in breaches (n=755)
0% 20% 40% 60% 80% 100%
Hacking
A quick glance at the figures below uncovers two
prominent hacking variety and vector combinations.
The more obvious scenario is using a backdoor or
C2 via the backdoor or C2 channel, and the less
obvious, but more interesting, use of stolen
credentials. Utilizing valid credentials to pop web
applications is not exactly avant garde.
The reason it becomes noteworthy is that 60%
of the time, the compromised web application vector
was the front-end to cloud based email servers.
Even though stolen credentials are not directly
associated with patch currency, it is still a necessary
and noble undertaking. At most, six percent of
breaches in our data set this year involved exploiting
vulnerabilities. Remember that time your network
was scanned for vulnerabilities and there were zero
findings? You slept soundly that night only to be
jolted from your drowsy utopia by your alarm radio
blaring “I Got You Babe.” Vulnerability scanning always
yields findings (even benign informational ones) and
it is up to the administrators to determine which are
accepted, and which are addressed.
11
Capture stored data
Downloader
Spam
Capture app data
Adware
Adminware
Spyware/keylogger
Backdoor
Ransomware
C2
Incidents
Figure 16. Top malware action varieties in incidents (n=2,103)
0% 20% 40% 60% 80% 100%
AUC: 32.4%
COT: 43.8%
0%
25%
50%
75%
100%
7 30 60 90
Days taken to patch
Findingsfixed
Figure 15. Time to patch
Figure 15 shows the patching behavior of hundreds
of organizations from multiple vulnerability scanning
contributors. Based on scan history, we determine
that organizations will typically have a big push to
remediate findings after they are initially discovered
and after that there is a steady increase in percentage
of findings fixed until it levels out. Not unlike the
amount of romance and mutual regard that occurs
while dating vs. once married. You get the idea.
The area under the curve (AUC) is how protected
you are while you are actively patching. Quick
remediation will result in a higher AUC. The
percentage completed-on-time (COT) is the amount
of vulnerabilities patched at a pre-determined
cut-off time; we used 90 days. Your COT metric
could be different, and it would make sense to have
different COTs for Internet-facing devices or browser
vulnerabilities, and certainly for vulnerabilities with
active exploitation in the wild.
It is important to acknowledge that there will always
be findings. The key is to prioritize the important
ones and have a plan for the remaining actionable
vulnerabilities; and to be able to defend acceptance of
unaddressed findings.
Malware
Malware can be leveraged in numerous ways to
establish or advance attacks. Command and Control
(C2) and backdoors are found in both security
incidents and breaches. Ransomware is still a major
issue for organizations and is not forced to rely on
data theft in order to be lucrative.
12
Ransomware
Ram scraper
Password dumper
Capture stored data
Downloader
Adminware
Capture app data
Spyware/keylogger
C2
Backdoor
Breaches
Figure 17. Top malware action varieties in breaches (n=500)
0% 20% 40% 60% 80% 100%
Web download
Other
Network propagation
Email link
Remote injection
Download by malware
Web drive-by
Email unknown
Direct install
Email attachment
Incidents
Figure 18. Top malware action vectors in incidents (n=795)
0% 20% 40% 60% 80% 100%
We were at a hipster coffee shop and it was packed
with people talking about cryptomining malware as
the next big thing. The numbers in this year’s
data set do not support the hype, however, as this
malware functionality does not even appear in the
top 10 varieties. In previous versions of VERIS,
cryptominers were lumped in with click-fraud, but
they received their own stand-alone enumeration
this year. Combining both the new and legacy
enumerations for this year, the total was 39—more
than zero, but still far fewer than the almost 500
ransomware cases this year.
13
Figure 18 displays that when the method of malware
installation was known, email was the most common
point of entry. This finding is supported in Figure 19,
which presents data received from millions of
malware detonations, and illustrates that the median
company received over 90% of their detected
malware by email. Direct install is indicative of a
device that is already compromised and the malware
is installed after access is established. It is possible
for malware to be introduced via email, and once the
foothold is gained, additional malware is downloaded,
encoded to bypass detection and installed directly. Like
most enumerations, these are not mutually exclusive.
Social
While hacking and malicious code may be the words
that resonate most with people when the term “data
breach” is used, there are other threat action catego-
ries that have been around much longer and are still
ubiquitous. Social engineering, along with Misuse,
Error, and Physical, do not rely on the existence of
“cyberstuff” and are definitely worth discussing. We
will talk about these “OGs” now, beginning with the
manipulation of human behavior.
There is some cause for hope in regard to phishing,
as click rates from the combined results of multiple
security awareness vendors are going down. As you
can see in Figure 21, click rates are at 3%.
94% 0% 45% 26% 22%
Delivery Method File Type
email web other Office doc Windows app other
0%
25%
50%
75%
100%
Figure 19. Malware types and delivery methods
23%
Scam
Other
Influence
Forgery
Extortion
Bribery
Pretexting
Phishing
Breaches
Figure 20. Top social action varieties in breaches (n=670)
0% 20% 40% 60% 80% 100%
14
2.99%
0%
5%
10%
15%
20%
25%
2012 2014 2016 2018
Clicked
Figure 21. Click rates over time in sanctioned
phishing exercises
With regard to the event chain for these attacks, if the
device on which the communication was read and/or
interacted with does not have malicious code installed
as part of the phish, it may not be recorded as an
affected asset. For example, if a user is tricked into
visiting a phony site and he/she then enters credentials,
the human asset is recorded as well as the asset that
the credentials are used to access. To that end, those
moments when the users thoughts are adrift provide
an excellent opportunity for criminals to phish via SMS
or emails to mobile devices. This is supported by the
18% of clicks from the sanctioned phishing data that
were attributed to mobile. Below is a window into
mobile devices and how the way humans use them can
contribute to successful phishing attacks provided by
researcher Arun Vishwanath, Chief Technologist, Avant
Research Group, LLC.
7
Vishwanath, A. (2016). Mobile device affordance: Explicating how smartphones influence the outcome of phishing attacks. Computers in Human Behavior, 63, 198-207.
8
Vishwanath, A. (2017). Getting phished on social media. Decision Support Systems, 103, 70-81.
9
Vishwanath, A., Harrison, B.,  Ng, Y. J. (2018). Suspicion, cognition, and automaticity model of phishing susceptibility. Communication Research, 45(8), 1146-1166.
Research points to users being significantly
more susceptible to social attacks they
receive on mobile devices. This is the case for
email-based spear phishing, spoofing attacks
that attempt to mimic legitimate webpages, as
well as attacks via social media.7, 8, 9
The reasons for this stem from the design
of mobile and how users interact with these
devices. In hardware terms, mobile devices
have relatively limited screen sizes that restrict
what can be accessed and viewed clearly.
Most smartphones also limit the ability to
view multiple pages side-by-side, and navi-
gating pages and apps necessitates toggling
between them—all of which make it tedious
for users to check the veracity of emails and
requests while on mobile.
Mobile OS and apps also restrict the
availability of information often necessary
for verifying whether an email or webpage is
fraudulent. For instance, many mobile browsers
limit users’ ability to assess the quality of a
website’s SSL certificate. Likewise, many
mobile email apps also limit what aspects of
the email header are visible and whether the
email-source information is even accessible.
Mobile software also enhances the prominence
of GUI elements that foster action—accept,
reply, send, like, and such­—which make it easier
for users to respond to a request. Thus, on the
one hand, the hardware and software on mobile
devices restrict the quality of information that
is available, while on the other they make it
easier for users to make snap decisions.
The final nail is driven in by how people use
mobile devices. Users often interact with
their mobile devices while walking, talking,
driving, and doing all manner of other activities
that interfere with their ability to pay careful
attention to incoming information. While
already cognitively constrained, on screen
notifications that allow users to respond to
incoming requests, often without even having
to navigate back to the application from which
the request emanates, further enhance the
likelihood of reactively responding to requests.
Thus, the confluence of design and how
users interact with mobile devices make it
easier for users to make snap, often
uninformed decisions—which significantly
increases their susceptibility to social
attacks on mobile devices.
Figure 21. Click rates over time in sanctioned phishing exercises
15
Misuse
Misuse is the malicious or inappropriate use of
existing privileges. Often it cannot be further defined
beyond that point in this document due to a lack
of granularity provided; this fact is reflected in the
more generic label of Privilege abuse as the
top variety in Figure 22. The motives are
predominantly financial in nature, but employees
taking sensitive data on the way out to provide
themselves with an illegal advantage in their next
endeavor are also common.
Illicit content
Net misuse
Unapproved software
Unapproved hardware
Possession abuse
Email misuse
Knowledge abuse
Unapproved workaround
Data mishandling
Privilege abuse
Breaches
Figure 22. Top misuse varieties in breaches (n=292)
0% 20% 40% 60% 80% 100%
Secondary
Fear
Ideology
Convenience
Other
Grudge
Fun
Espionage
Financial
Breaches
Figure 23. Actor motives in misuse breaches (n=245)
0% 20% 40% 60% 80% 100%
16
Person - Finance
User Dev - POS terminal
Server - POS controller
User Dev - Laptop
Person - End-user
Media - Documents
Server - Database
Server - Web application
User Dev - Desktop
Server - Mail
Breaches
Figure 25. Top asset varieties in breaches (n=1,699)
0% 20% 40% 60% 80% 100%
2010 2018
4
2
14
0
31
0
16
32%
0
4
5
5
7
21
21
37%
-4
+2
-9
+5
-24
+21
+5
+5
DIFF
Gaffe
Omission
Disposal
error
Programming
error
Loss
Misconfiguration
Publishing
error
Misdelivery
Breaches
Figure 24. Top error varieties in breaches
over time n=100 (2010), n=347 (2018)
Error
As we see in Figure 24, the top two error varieties
are consistent with prior publications, with
Misconfiguration increasing at the expense of Loss
and Disposal Errors. Sending data to the incorrect
recipients (either via email or by mailed documents)
is still an issue. Similarly, exposing data on a public
website (publishing error) or misconfiguring an asset
to allow for unwanted guests also remain prevalent.
Affected assets
Workstations, web applications, and surprisingly,
mail servers are in the top group of assets affected
in data breaches. There is a great deal to be
learned about how threat actions associate with
assets within the event chains of breaches. We
get down to business in Table 1 to pull out some of
the more interesting stories the 2019 DBIR data
has to tell us.
Figure 24. Top error varieties in breaches over time
n=100 (2010), n=347 (2018)
17
The table above does exclude assets where a
particular variety was not known. In the majority of
phishing breaches, we are not privy to the exact
role of the influenced user and thus, Person -
Unknown would have been present. We can deduce
that phishing of Those Who Cannot Be Named
leads to malware installed on desktops or tricking
users into providing their credentials.
Most often, those compromised credentials were to
cloud-based mail servers. There was an uptick
in actors seeking these credentials to compromise a
user’s email account. It turns out there are
several ways to leverage this newly found access.
Actors can launch large phishing campaigns from
the account, or if the account owner has a certain
degree of clout, send more targeted and elaborate
emails to employees who are authorized to pay
bogus invoices.
There were also numerous cases where an
organization’s email accounts were compromised
and the adversary inserted themselves into
conversations that centered around payments. At
this point, the actors are appropriately positioned
to add forwarding rules in order to shut out the
real account owner from the conversation. Then
they simply inform the other recipients that
they need to wire money to a different account on
this occasion because…reasons.
Table 1
Top action and asset variety combinations within breaches, (n= 2,013)
	 Action	 Asset	 Count 	
	 Hacking - Use of stolen creds	 Server - Mail	 340	
	 Social - Phishing	 Server - Mail	 270	
	 Social - Phishing	 User Dev - Desktop	 251	
	 Malware - Backdoor	 User Dev - Desktop	 229	
	 Malware - C2	 User Dev - Desktop	 210	
	 Hacking - Use of backdoor or C2	 User Dev - Desktop	 208	
	 Malware - Spyware/Keylogger	 User Dev - Desktop	 103	
	 Malware - Adminware	 User Dev - Desktop	 91	
	 Misuse - Privilege abuse	 Server - Database	 90	
	 Malware - Capture app data	 Server - Web application	 83
18
Other
Classified
System
Bank
Secrets
Payment
Medical
Personal
Credentials
Internal
Breaches
Figure 27. Top data varieties compromised in breaches (n=1,285)
0% 20% 40% 60% 80% 100%
Compromised data
Figure 27 details the varieties of data that were
disclosed as a result of the data breaches
that occurred this year. Personal information is
once again prevalent. Credentials and Internal
are statistically even, and are often both found in
the same breach. The previously mentioned
credential theft leading to the access of corporate
email is a very common example.
Another trend in this year’s data set is a marked shift
away from going after payment cards via ATM/gas
pump skimming or Point of Sale systems and towards
e-commerce applications. The 83 breaches with
the association of web application and the action of
type capture application data is one indicator of this
change. Figure 26 below illustrates how breaches
with compromised payment cards are becoming
increasingly about web servers – additional details
can be found in the Retail industry section.
Not Webapp
Server
Webapp
Server25%
50%
75%
2015 2016 2017 2018
Figure 26. Webapp Server vs. Not Webapp Server
assets in payment data breaches over time
19
Breach timeline
As we have mentioned in previous reports, when
breaches are successful, the time to compromise
is typically quite short. Obviously, we have no way
of knowing how many resources were expended
in activities such as intelligence gathering and
other preparations.10
However, the time from the
attacker’s first action in an event chain to the initial
compromise of an asset is typically measured in
minutes. Conversely, the time to discovery is more
likely to be months. Discovery time is very dependent
on the type of attack in question. With payment card
compromises, for instance, discovery is usually based
upon the fraudulent use of the stolen data (typically
weeks or months), while a stolen laptop will usually be
discovered much more quickly because it is relatively
obvious when someone has broken the glass out of
your car door and taken your computer.
Finally, it goes without saying that not being
compromised in the first place is the most desirable
scenario in which to find oneself. Therefore, a focus
on understanding what data types you possess
that are likely to be targeted, along with the correct
application of controls to make that data more difficult
(even with an initial device compromise) to access and
exfiltrate is vital. Unfortunately, we do not have a lot
of data around time to exfiltration, but improvements
within your own organization in relation to both that
metric along with time to discovery can result in the
prevention of a high-impact confirmed data breach.
Containment, (n=127)
Discovery, (n=390)
Exfiltration, (n=87)
Compromise, (n=140)
Seconds Minutes Hours Days Weeks Months Years
0%
20%
40%
60%
0%
20%
40%
60%
0%
20%
40%
60%
0%
20%
40%
60%
Breaches
Figure 28. Breach timelines
10
Though we are starting to look before and after the breach in the Data Breaches, Extended Version section
20
This calls for the old Billy Baroo.
Last year we pointed out how a golfer navigating a golf
course is a lot like an adversary attacking your network.11
The course creator builds sand traps and water
hazards along the way to make life difficult. Additional
steps, such as the length of grass in the rough and
even the pin placement on the green can raise the
stroke average for a given hole. In our world, you’ve put
defenses and mitigations in place to deter, detect, and
defend. And just like on the golf course, the attackers
reach into their bag, pull out their iron, in the form of
a threat action, and do everything they can to land on
the attribute they want in the soft grass of the fairway.
The first thing to know is that unlike a golfer who
graciously paces all the way back to the tees to take
his or her first shot, your attackers won’t be anywhere
near as courteous. In Figure 29 we see that attack
paths are much more likely to be short than long. And
why not, if you’re not following the rules (and which
attackers do?) why hit from the tees unless you
absolutely have to? Just place your ball right there on
the green and tap it in for a birdie or a double eagle,
as the case may be. And while your normal genteel
golfer will abide (to a greater or lesser degree) by the
course rules on the off chance that there is a Marshall
watching and start on hole 1, threat actors will invari-
ably take the shotgun start approach. They will begin
their round on the hole they are shooting for, whether
it’s confidentiality, integrity, or availability.
Figure 30 provides a look at the three holes on our
InfoSec golf course. It displays the number of events
and threat actions in the attack chains, by last attri-
bute affected. There is a lot to take in, and we do want
to point a few things out.
Unbroken chains
11
We are not saying hackers have early 90’s John Daly mullets. We don’t have data to support that. We just imagine that they do, and that this is why they all wear hoodies in clip art.
“My golf security is so delicate, so
tenuously wired together with silent
inward prayers, exhortations and unstable
visualizations, that the sheer pressure
of an additional pair of eyes crumbles the
whole rickety structure into rubble.”
—John Updike, with the sympathy of some CISOs.
While it is our belief that this section can be of interest and benefit to our readers, there are a couple
of caveats that should be made clear from the beginning. First of all, we have only recently updated
the VERIS schema to allow for collection of event chain data. Secondly, not all incident and breach
records offer enough details to attempt to map out the path traveled by the threat actor.
We collect an action, actor, asset, and attribute at each step. However, each may be “Unknown” or
omitted completely if it did not occur in that particular step of the attack. To create a single path from
these factors, we begin by placing the actor at the first step at the beginning of the path. It’s followed
by the action and then attribute present in the step. For the remaining steps it proceeds from action
to attribute to action of the next step, simply skipping over any omitted.
0
100
200
300
0 5 10 15
Number of steps
Breaches
Figure 29. Number of steps per incident (n=1,285)
Short attack paths are much more common than long
attack paths.
21
First, starting with Confidentiality, take a look at just
how many short paths result from Misuse and Error,
and to a lesser extent from Physical actions. On the
other hand, we can see Hacking actions bounding
back and forth between attributes for several steps.
In Integrity we see an especially long chain beginning
with Hacking and going to and fro between that and
Malware as it compromises the Confidentiality and
Integrity of the target.
Obviously, there’s a lot going on in Figure 30. An
easier way of looking at it is what actions start
(Figure 31), continue (Figure 32), and end (Figure 33)
incidents.
Integrity
Confidentiality
Availability
Integrity
Confidentiality
Availability
Integrity
Confidentiality
Availability
IntegrityConfidentialityAvailability
14 12 10 8 6 4 2
Steps
Action Error Malware Physical Unknown Hacking Misuse Social
Figure 30. Attack chain by final attribute compromised¹² (n=941)
0
Integrity
Confidentiality
Availability
Integrity
Confidentiality
Availability
Integrity
Confidentiality
Availability
IntegrityConfidentialityAvailability
14 12 10 8 6 4 2
Steps
Action Error Malware Physical Unknown Hacking Misuse Social
Figure 30. Attack chain by final attribute compromised¹² (n=941)
0
12
There’s a lot going on in this figure. Take your time and explore it. For example, notice the differences between short and long attacks.
22
We see that the while Hacking
is a little farther ahead, the
first action in an incident could
be almost anything. The most
interesting part is that Malware
is at the end of the chart, even
behind Physical, which requires
the attacker to be, well, physically
present during the attack.
Malware is usually not the
driver you use to get off the tee;
remember that most is delivered
via social or hacking actions.
Moving on to Figure 32, Malware
makes its grand entrance. It
may not be the opening shot, but
it is the trusty 7-iron (or 3 wood,
pick your analogy according to
your skills), that is your go-to club
for those middle action shots.
Interestingly, there are almost
no Misuse and Physical middle
actions and no Error in our data
set. That’s primarily because
these are short attack paths
and to be in the middle you have
to have at least three events in
the chain.
And finally, we get a chance
to see where attacks end in
Figure 33. The most significant
part is how Social is now at the
bottom. While social attacks
are significant for starting and
continuing attacks as seen in
Figures 31, they’re rarely the
three-foot putt followed by
the tip of the visor to the
sunburned gallery.
Malware
Physical
Misuse
Social
Error
Hacking
0% 20% 40% 60% 80% 100%
Incidents
Figure 31. Actions in first step of
incidents (n=909). An additional
32 incidents, (3.40% of all paths),
started with an unknown action.
Physical
Misuse
Social
Hacking
Malware
Incidents
Figure 32. Actions in middle steps of
incidents (n=302)
0% 20% 40% 60% 80% 100%
Social
Physical
Misuse
Error
Malware
Hacking
Incidents
Figure 33. Actions in last step of
incidents (n=942)
0% 20% 40% 60% 80% 100%
23
0%
25%
50%
75%
0 5 10 15
Number of steps
Attacksuccess
Figure 34. Attack success by chain length in
simulated incidents (n=87)
At this point, you may be wondering if your sand traps
are sandy enough. Figure 34 comes from breach
simulation data. It shows that in testing, defenders fail
to stop short paths substantially more often than long
paths. So, just in case you were looking on your systems
and thinking “it’s the other guys that let the attackers
start on the putting green,” short attacks work.
Attack Paths and Mitigations
Our friends at the Center for Internet Security
contributed some thoughts on mitigating
attack paths:
Much of security has been founded on cat-
alogues of controls, vague vendor promises,
laborious legislation, and tomes of things to
do to keep your organization safe. Within this
sea of options, we also have to justify our
budgets, staff, and meet the business needs
of the organization. Leveraging an attack path
model is not only an important step towards
formalizing our understanding of attacks, but
also a means to understanding our defense.
Previously, when looking at attack summary
data we were presented with a snapshot of an
attacker’s process which requires us to infer
the preceding and proceeding events. Wheth-
er we realize it or not, such interpretations
impact how we plan our defenses. Defending
against malware takes a different approach if
the malware is dropped via social engineering,
a drive-by download, or brought in by an
insider via a USB device.
In addition, while being faced with what seems
like an endless list of potential attacks, limiting
ourselves to snapshots also hinders our ability
to find commonalities between these attacks.
Such commonalities may be key dependencies
in an attacker’s process which represent
opportunities for us to disrupt. The more
we can understand the sequence of events
happening in an attack, the more we as a
community can make it harder for adversaries
to reuse the same process.
24
Beginning with the 2014 report, we have utilized
nine basic patterns to categorize security incidents
and data breaches that share several similar
characteristics. This was done in an effort to
communicate that the majority of incidents/breaches,
even targeted, sophisticated attacks, generally
share enough commonalities to categorize them, and
study how often each pattern is found in a particular
industry’s data set. When we first identified the
patterns six years ago we reported that 92 percent
of the incidents in our corpus going back 10 years
could be categorized into one of the nine patterns.
Fast-forwarding to today with over 375,000 incidents
and over 17,000 data breaches, the numbers reveal
that 98.5% of security incidents and 88% of data
breaches continue to find a home within one of the
original nine patterns. So, it would appear that, as with
humans, the “I can change” mantra is false here as well.
Incident classification
patterns and subsets
Payment Card Skimmers
Point of Sale
Cyber-Espionage
Everything Else
Miscellaneous Errors
Web Applications
Lost and Stolen Assets
Crimeware
Denial of Service
Privilege Misuse
Incidents
Figure 35. Incidents per pattern (n=41,686)
0% 20% 40% 60% 80% 100%
Denial of Service
Payment Card Skimmers
Point of Sale
Lost and Stolen Assets
Crimeware
Everything Else
Cyber-Espionage
Privilege Misuse
Miscellaneous Errors
Web Applications
Breaches
Figure 36. Breaches per pattern (n=2,013)
0% 20% 40% 60% 80% 100%
25
The patterns will be referenced more in the
industry sections, but to get acquainted or rekindle
a relationship, they are defined below:
Crimeware:
All instances involving malware that did not fit into a
more specific pattern. The majority of incidents that
comprise this pattern are opportunistic in nature and
are financially motivated.
Notable findings: Command and control (C2) is
the most common functionality (47%) in incidents,
followed by Ransomware (28%).
Cyber-Espionage:
Incidents in this pattern include unauthorized
network or system access linked to state-affiliated
actors and/or exhibiting the motive of espionage.
Notable findings: Threat actors attributed to state-
affiliated groups or nation-states combine to make up
96% of breaches, with former employees, competitors,
and organized criminal groups representing the rest.
Phishing was present in 78% of Cyber-Espionage
incidents and the installation and use of backdoors
and/or C2 malware was found in over 87% of incidents.
Breaches involving internal actors are categorized in
the Insider and Privilege Misuse pattern.
Denial of Service:
Any attack intended to compromise the availability
of networks and systems. This includes both network
and application attacks designed to overwhelm
systems, resulting in performance degradation or
interruption of service.
Notable findings: This pattern is based on the specific
hacking action variety of DoS. The victims in our data
set are large organizations over 99 percent of the time.
Insider and Privilege Misuse:
All incidents tagged with the action category
of Misuse—any unapproved or malicious use of
organizational resources—fall within this pattern.
Notable findings: This is mainly insider misuse, but
former and collusive employees as well as partners
are present in the data set.
Miscellaneous Errors:
Incidents in which unintentional actions directly
compromised a security attribute of an asset.
Notable findings: Misdelivery of sensitive data,
publishing data to unintended audiences, and
misconfigured servers account for 85% of this pattern.
Payment Card Skimmers:
All incidents in which a skimming device was
physically implanted (tampering) on an asset that
reads magnetic stripe data from a payment card.
Notable findings: Physical tampering of ATMs and
gas pumps has decreased from last year. This may
be attributable to EMV and disruption of card-present
fraud capabilities.
Point of Sale Intrusions:
Remote attacks against the environments where
card-present retail transactions are conducted. POS
terminals and POS controllers are the targeted assets.
Physical tampering of PIN entry device (PED) pads or
swapping out devices is covered in the Payment Card
Skimmers section.
Notable findings: The Accommodation industry is still
the most common victim within this pattern, although
breaches were less common this year.
Physical Theft and Loss:
Any incident where an information asset went missing,
whether through misplacement or malice.
Notable findings: The top two assets found in Physical
Theft and Loss breaches are paper documents,
and laptops. When recorded, the most common
location of theft was at the victim work area, or from
employee-owned vehicles.
Web Application Attacks:
Any incident in which a web application was the
vector of attack. This includes exploits of code-level
vulnerabilities in the application as well as thwarting
authentication mechanisms.
Notable findings: Over one-half of breaches in this
pattern are associated with unauthorized access of
cloud-based email servers.
26
Patterns within patterns
There are two subsets of incidents that will be called
out when looking at industry breakouts. The increase
in mail server (and email account) compromise and
the significant dollar losses from social attacks leading
to fraudulent payments provided an opportunity to
create a Financially-Motivated Social Engineering
(FMSE) subset that Includes incidents and breaches
that would fall into Web Application Attacks or
Everything Else. These incidents are included in the
main corpus, but we will look at them independently
as well. The incidents that comprise the botnet
subset, are not part of the main data set, due
to the sheer volume. These incidents could fall into
Crimeware if modeled from the perspective of
the malware recipient, or Web applications if the
botnet steals credentials from one victim and is used
against another organizations’ application. Our
data is from the latter, organizations whose systems
are logged on via stolen user credentials.
Financially-Motivated Social Engineering Subset:
Financially motivated incidents that resulted in either
a data breach or fraudulent transaction that featured
a Social action but did not involve malware installation
or employee misuse. Financial pretexting and phishing
attacks (e.g., Business Email Compromise, W-2
phishing) are included in this subset.
Notable findings: 370 incidents, 248 of which are
confirmed data breaches, populate this subset. The
incidents are split almost evenly between parent
patterns of Everything Else and Web applications.
The breaches are closer to a 3:1 Web Application to
Everything Else ratio.
Everything Else:
Any incident or breach that was not categorized into
one of the nine aforementioned patterns.
Notable findings: Of the 241 breaches that fell into
the Everything Else pattern, 28% are part of the
Financially-Motivated Social Engineering attacks
subset discussed later in this section.
Analysis shows 6x fewer Human Resources personnel
being impacted in breaches this year. This finding, as
correlated with the W-2 scams, almost disappearing
from our dataset. While this may be due to improved
awareness within organizations, our data doesn’t offer
any definitive answers as to what has caused the drop.
Botnet Subset:
Comprised of over 50,000 instances of customers as
victims of banking Trojans or other credential-stealing
malware. These are generally low on details and
analyzed separately to avoid eclipsing the rest of the
main analysis data set.
Notable findings: 84% of the victims were in Finance
and Insurance (52), 10% in Information (51), and 5% in
Professional, Scientific, and Technical Services (54).
180 countries and territories are represented in these
breaches. Botnets are truly a low-effort attack that
knows no boundaries and brings attackers either direct
revenue through financial account compromise or
infrastructure to work from.
Secondary Subset:
Comprised of 6,527 incidents of web applications
used for secondary attacks such as DDoS sources or
malware hosting. These are legitimate incidents, but
low on details and analyzed separately from the main
analysis data set.
Notable findings: Many times, these are light on
specifics, but we do know that 39% of the time they
involved a malware action, with 70% of those
being DDoS, and 30% exploiting a vulnerability and
downloading additional malware. Attackers need
infrastructure too and just like with the botnet subset,
when an attacker takes over your web application,
your infrastructure just got converted to multi-tenant.
27
13
Save some large organizations that have gone after dark markets or bullet-proof hosting
There’s definitely a feeling in InfoSec that the attackers
are outpacing us. They’ve got all the creds, the
vulns, and the shells, not to mention the possibility
of huge monetary incentives. We, on the other hand,
have a four-year project just to replace the servers
on end-of-life operating systems. However, when
contemplating this unfair advantage it’s sometimes
easy for us to overlook the bigger picture. While it is
true that attacks typically happen quickly (hours or
less) when they are well aimed, and it also is true that
when our organizations are successfully breached
it often takes us months or more to learn of it, there
is still room for optimism. In the paths section we
examined the route that attackers take to get from
point A to point B. In this section we take a look at
those events that take place prior to the attack, and
those required after the attack has ended in order for
the attacker to realize their profit.
Like all good stories, attackers need somewhere to
begin, and whether this starting point is with a list of
vulnerable servers, phished emails, or stolen creden-
tials, if the proverbial lever is long enough they will
breach your perimeter. Therefore, it is wise to do all
that you can to reduce the number of starting points
that they are provided. After all, vulns can usually
be patched and creds can be better protected with
multi-factor authentication. Having said that, we do
realize that even the best security departments can
only do so much. Sixty-two percent of breaches not
involving an Error, Misuse, or Physical action (in other
words, wounds that weren’t self-inflicted) involved
the use of stolen creds, brute force, or phishing.
And all that malware doesn’t write itself. Admittedly,
there’s not a lot you can do about the development,
preparation, targeting, distribution, and other
shenanigans that take place on the part of the bad
guy before the breach.13
However, what goes down
after the breach is another story altogether.
Just ask the axis
Let’s look at what’s being stolen. In Figure 37
we illustrate the analysis of the amount lost to
attackers in two types of breaches: business email
compromises and computer data breaches. This
loss impact data comes courtesy of the Federal
Bureau of Investigation Internet Crime Complaint
Center (FBI IC3) who have offered some helpful
hints in the breakout at the end of this section.
When looking at the visualized distribution, the first
thing to notice is the spike at zero. Not all incidents
and breaches result in a loss. The second piece of
good news is that the median loss for a business email
compromise is approximately the same as the average
cost of a used car. The bad news is that the dollar
axis isn’t linear. There are about as many breaches
resulting in the loss of between zero and the median
as there are between the median and $100 million. We
are no longer talking about used-car money at this
point, unless you happen to be Jay Leno.
As mentioned above, there’s a great deal that has to
occur even after the breach takes place to make it
worth the criminal’s while. For example, business email
compromises normally involve the fraudulent transfer
of funds into an attacker-owned bank account.
Business Email
Compromise
Median = $24,439
(n = 18,606)
Computer
Data Breach
Median = $7,611
(n = 1,711)
$0 $100 $100K $100M
Dollars
Figure 37. Amount stolen by breach type
Data breaches: extended version
“Give me a place to stand and a lever long
enough and I will move the world.”
—Archimedes
28
Figure 38. Term clusters in criminal forum and marketplace posts
29
On this front, we have more glad tidings to impart.
When the IC3 Recovery Asset Team acts upon
BECs, and works with the destination bank, half of
all US-based business email compromises had 99%
of the money recovered or frozen; and only 9% had
nothing recovered. Let that sink in. BECs do not pay
out as well as it initially appears, and just because
the attacker won the first round doesn’t mean you
shouldn’t keep fighting.
On the other hand, BECs are still advantageous for
the criminal element because they provide a quick
way to cash out. Many other types of data breaches
require a little more work on the adversaries’ part to
convert stolen data into accessible wealth. A common
solution is to sell what you stole, whether PII, email
addresses, creds, credit card numbers, or access to
resources you have compromised. Figure 38 provides
information about the numerous things for sale in
the darker corners of the Internet (which surprisingly
enough, resemble a 1990s video game message
board). In the center we see a large blue cluster.
This is comprised primarily of credit card related
posts—the buying and selling of credit cards, to make
money, to take money, and to cash out gains. It also
includes smaller nodes related to the attacks involved
in actually stealing the cards. There’s an even smaller
cluster in the upper right which is related to credential
theft. These may grant access to more lucrative
things such as bank accounts, but many times are for
consumer services including video games, streaming
video, etc., that attackers use directly.
The alternative to posting this data for sale on the
dark web is using the data to steal identities and
committing direct fraud themselves. Herein lies the
appeal of stealing tax and health-related information.
Filing fraudulent tax returns or insurance claims is
a relatively straightforward way to put cash in one’s
pocket. The problem is that tax returns and insur-
ance claims don’t pay out in unmarked bills or wire
transfers to South America. This requires another
step in the post-breach to-do list: money laundering.
Normally money laundering is an expensive and
risky task. If, for example, the money has to go
through three separate set of hands on its way to
its final destination, each person needs to take their
respective cut. If the third person in the succession
says they did not receive it, but the first person
insists they sent it, who does the actor believe?
“There is no honor among thieves,” etc.
This is in large part why attackers often favor
cryptocurrency, as is it can be laundered
and transferred for relatively low cost and presents
negligible risk. However, a distinct drawback is
that this type of currency is a bit limited with regard
to what one can purchase with it. Thus, at some
point it has to be exchanged. For these and other
reasons, research into increasing both the risk
and cost associated with cryptocurrency laundering
and/or exchange for illicit purposes has a good
deal of potential as a means of increasing breach
overhead and thereby decreasing the relative
profit associated with such crimes.
About the IC3
The Federal Bureau of Investigation Internet
Crime Complaint Center (IC3) provides the
public with a trustworthy and convenient report-
ing mechanism to submit information concerning
suspected internet-facilitated criminal activity.
The IC3 defines the Business Email
Compromise (BEC) as a sophisticated scam
targeting both business and individuals per-
forming wire transfer payments.
The Recovery Asset Team (RAT) is an IC3
initiative to assist in the identification
and freezing of fraudulent funds related to
BEC incidents.
Regardless of dollar loss, victims are
encouraged and often directed by law enforce-
ment to file a complaint online at www.ic3.gov.
The IC3 RAT may be able to assist in the
recovery efforts.
30
Victim demographics
and industry analysis
	Incidents:	 Total	 Small	Large	Unknown	 Breaches:	Total	 Small	Large	 Unknown	
	Accommodation (72)	 87	 38	 9	 40		 61	 34	 7	 20
	Administrative (56)	 90	 13	 23	 54		 17	 6	 6	 5
	Agriculture (11)	 4	 2	 0	 2		 2	 2	 0	 0
	Construction (23)	 31	 11	 13	 7		 11	 7	 3	 1
	Education (61)	 382	 24	 11	 347		 99	 14	 8	 77
	Entertainment (71)	 6,299	 6	 6	 6,287		 10	 2	 3	 5
	Finance (52)	 927	 50	 64	 813		 207	 26	 19	 162
	Healthcare (62)	 466	 45	 40	 381		 304	 29	 25	 250
	Information (51)	 1,094	 30	 37	 1,027		 155	 20	 18	 117
	Management (55)	 4	 1	 3	 0		 2	 1	 1	 0
	Manufacturing (31-33)	 352	 27	 220	 105		 87	 10	 22	 55
	Mining (21)	 28	 3	 6	 19		 15	 2	 5	 8
	 Other Services (81)	 78	 14	 5	 59		 54	 6	 5	 43
	Professional (54)	 670	 54	 17	 599		 157	 34	 10	 113
	Public (92)	 23,399	 30	 22,930	 439		 330	 17	 83	 230
	 Real Estate (53)	 22	 9	 5	 8		 14	 6	 3	 5
	Retail (44-45)	 234	 58	 31	 145		 139	 46	 19	 74
	Trade (42)	 34	 5	 16	 13		 16	 4	 8	 4
	Transportation (48-49)	 112	 6	 23	 83		 36	 3	 9	 24
	Utilities (22)	 23	 3	 7	 13		 8	 2	 0	 6
	Unknown	 7,350	 0	 3,558	 3,792		 289	 0	 109	 180
	Total	 41,686	 429	27,024	 14,233		 2,013	 271	 363	 1,379
Table 2
Number of security incidents by victim industry and organization size
The data set for this report totals over 100,000
incidents, 101,168 to be exact. After we removed the
subsets that were detailed in the prior section, and
applied minimum complexity filters, the data set used
for core analysis is established. Table 2 is the repre-
sentation of that data set broken out by industry and
organization size, when known. Our annual statement
on what not to do with this breakout will now follow.
Do not utilize this to judge one industry over another –
so a security staffer from a construction organization
waving this in the face of their peer from the financial
sector and trash-talking is a big no-no.
31
ActionAssetPattern
684
206
75
69
23
22
14
4
1
575
100
76
52
36
32
29
21
9
408
79
60
59
30
14
13
9
226
37
31
30
24
19
9
6
110
104
76
71
62
39
3
3
40 2
17
14
7
5
4
1
1
13,021
4,758
2,820
1,515
992
143
93
61
163
58
40
36
23
16
14
5
92
54
21
16
14
12
10
10
7
2
796
244
72
38
14
5
699
100
96
88
38
32
524
100
91
37
13
8
279
50
43
40
19
6
124
110
100
91
85
47
61
45
18
5
5
1 13,021
4,922
4,317
1,279
201
20
233
88
56
36
16
4
162
90
16
16
15
15
874
41
38
2
1
1
722
90
69
24
16
1
559
104
58
20
4
324
45
45
10
2
225
98
93
71
3
1
68
40
18
1
3,009
1,244
777
201
3
259
62
58
2
1
1
184
30
15
9
8
1
Incidents
Accommodation
(72)
Education
(61)
Finance(52)
Healthcare
(62)
Information
(51)
Manufacturing
(31-33)
Professional
(54)
Public(92)
Retail
(44-45)
Payment Card Skimmers
Point of Sale
Lost and Stolen Assets
Miscellaneous Errors
Cyber-Espionage
Denial of Service
Everything Else
Privilege Misuse
Web Applications
Crimeware
Physical
Error
Social
Misuse
Hacking
Malware
Kiosk/Term
Media
Network
Person
Server
User Dev
0% 25% 50% 75% 100%
Figure 39. Industry comparison
65
45
20
17
7
3
1
1
70
45
34
22
18
12
7
2
73
28
26
10
8
8
5
1
35
24
20
9
5
3
3
97
85
65
28
27
2
2
1
38
14
3
3
2
1
1
1 140
58
40
37
33
16
8
36
14
13
12
8
5
2
88
14
11
9
8
4
3
3
2
75
67
33
32
7
2
95
69
45
36
33
18
100
69
31
29
10
3
42
38
37
16
9
1
110
85
78
78
17
46 7
42
14
2
2
1
205
173
153
66
40
9
58
42
26
14
13
2
102
70
14
14
10
6
133
32
19
2
1
1
117
70
38
17
13
1
111
73
29
14
2
60
40
32
6
1
165
80
79
29
1
55
33
14
1
173
165
131
31
1
64
44
26
2
1
118
16
10
7
4
1
Breaches
Accommodation
(72)
Education
(61)
Finance(52)
Healthcare
(62)
Information
(51)
Manufacturing
(31-33)
Professional
(54)
Public(92)
Retail
(44-45)
Figure 39. Industry Comparison
(left: all security incidents, right: only breaches)
32
Retail (44-45)
Accommodation (72)
Information (51)
Public (92)
Education (61)
Manufacturing (31-33)
Finance (52)
Healthcare (62)
Professional (54)
Incidents
Figure 40. FMSE incidents by industry (n=370)
0% 20% 40% 60% 80% 100%
Our community of contributors, disclosure
requirements, and the population sizes for the
industries all play a major part in the numbers
above. The actual threat landscapes for organizations
are better depicted in Figure 39. This shows what
types of attack patterns are more common to
your industry, along with breakouts for threat action
categories and affected assets. We will explore
deeper into the breach jungle, machete in hand, in
the individual industry sections.
As we break down industries we see, for example,
in Figure 40 how FMSE incidents disproportionately
affect Professional Services, Healthcare and Finance,
with more point of sale-centric industries appear
towards the bottom of the list. However, it’s clear
that FMSE incidents affect all industries and so all
organizations need to be trained and prepared to
prevent them.
Phishing
Figure 41 ranks the click rates per industry for
sanctioned security awareness training exercises. This
data was provided by several vendors in this space,
and merged together for analysis. While we realize
we were relatively strict earlier about curtailing trash
talk on the above Table, feel free to use this for some
good-natured banter on an as-needed basis. Just be
sure to keep it at an appropriate level. “Not looking
so hot anymore for someone who works outside,
Construction” is approximately the correct amount of
snark (trust us, we are experts). On a positive note, all
industries are clocking in with percentages that are
less than the overall percentage in this study 2 years
ago. So, this calls for much rejoicing.
3.12%
1.32%
2.33%
2.04%
3.23%
4.93%
2.13%
4.48%
Retail
(44-45)
Finance
(52)
Healthcare
(62)
Information
(51)
Manufacturing
(31-33)
Professional
(54)
Public
(92)
Education
(61)
0% 2% 4% 6%
Figure 41. Click rate in phishing
tests by industry
Before you flip/scroll over to your industry section,
we have aligned several non-incident data sources to
industry that are worth your while to peruse first.
33
0.69Gbps
1.47Gbps
1.27Gbps
0.65Gbps
0.93Gbps
0.7Gbps
1.1Gbps
0.11Mpps
0.5Mpps
0.36Mpps
0.16Mpps
0.45Mpps
0.11Mpps
0.29Mpps
BPS PPS
Education (61)
n=219
Finance (52)
n=565
Information (51)
n=660
Manufacturing (31-33)
n=161
Professional (54)
n=401
Public (92)
n=792
Retail (44-45)
n=52
10K1K100
Count
Density
Figure 42. DDoS attack bandwidth and packet counts by industry
100K 1M 10M 100M10K1K100 100K 1M 10M 100M 1B 10B 100B
Denial of Service
Over time DDoS attacks have been getting much
more tightly clumped with regard to size (similar to
Manufacturing in Figure 42). However, as other
industries illustrate, that is not always the case. Some
industries, Information for instance, experience
attacks across a much wider range. Another important
takeaway is that the median DDoS doesn’t change
much from industry to industry. The difference
between the biggest and smallest industry median is
800Mbps and 400Kpps.
What’s your vector, Victor?
Figure 43 takes a look at the median percentage of
malware vectors and file types per industry; in
other words, it helps you know where to look for the
malware that’s coming in to your organization and
what it will most likely look like. First of all, the majority
of initial malware is delivered by email. Secondary
infections are downloaded by the initial malware, or
directly installed and, as such, are more difficult
for network tools to spot. Secondly, though it varies
a bit by industry, Office documents and Windows
applications are the most common vehicles for the
malware along with “Other” (archives, PDFs, DLLs,
links, and Flash/iOS/Apple/Linux/Android apps).
34
Delivery Method File Type
Accommodation (72)
Education (61)
Finance (52)
Healthcare (62)
Information (51)
Manufacturing (31-33)
Professional (54)
Public (92)
Retail and Wholesale
0%
25%
50%
75%
100%
Figure 43. Malware types and delivery methods by industry
email web other Office doc Windows app other
95.2%
95.6%
96.9%
98.0%
97.7%
91.1%
96.8%
61.4%
94.8%
17.1% 0.0%
0.0%
0.0%
0.0%
0.0%
0.0%
0.0%
0.0%
0.0%
15.1%
14.4%
9.0%
10.5%
21.0%
10.3%
86.1%
16.7%
41.5%
64.4%
51.2%
37.6%
49.7%
67.1%
74.5%
26.6%
56.2%
28.2% 21.2%
16.1%
18.4%
25.7%
20.7%
17.4%
12.6%
34.2%
19.0%
24.9%
25.0%
33.3%
25.3%
10.0%
12.5%
27.2%
15.8%
35
Frequency
Top 3 patterns
Threat actors
Actor motives
Data compromised
87 incidents, 61 with
confirmed data disclosure
Point of Sale intrusions,
Web applications
and Crimeware patterns
represent 93% of all
data breaches within
Accommodation
External (95%), Internal (5%)
(breaches)
Financial (100%) (breaches)
Payment (77%),
Credentials (25%),
Internal (19%) (breaches)
How can we be of service?
The Accommodation industry prides itself on
hospitality, and over the years it has been far too
hospitable to criminals. Financially motivated actors
are bringing home the bacon by compromising the
Point of Sale (POS) environments and collecting
customers’ payment card data. Table 3 lists the 10
most common combinations of threat action varieties
and assets. These are pairings that are found in the
same breach, but not necessarily the same event or
step in the breach.
As stated above, some of these combinations are
indicative of a specific action taken against a specific
asset (e.g., RAM Scraping malware infecting a
Accommodation
and Food Services
The breach totals in our data set have decreased
from last year, primarily due to a lack of POS vendor
incidents that have led to numerous organizations
being compromised with stolen partner credentials.
POS Terminal). Others show that some actions are
conducted earlier or later in event chains that feature
a particular asset – you don’t phish a laptop, but
you may phish a human and install malware on his/her
laptop in the next step. In brief, the game has
not changed for this industry. POS Controllers are
compromised and malware specifically designed
to capture payment card data in memory is installed
and extended to connected POS Terminals. While
these POS intrusions are often a small business issue,
large hotel and restaurant chains can learn from
this data and if they use a franchise business model,
disseminate this knowledge to their franchisees.
The RAM scrapers may be the specialty of the
house, but malware does not spontaneously appear
on systems. When the infection vector is known,
it is typically a direct installation after the actors
use stolen, guessable, or default credentials to gain
access into the POS environment.
A cause for optimism?
While attacks against POS environments make up the
vast majority of data breaches against Accommodation
and Food Service organizations, the number has
decreased from 307 in last year’s report to 40 in this
report. Sounds pretty dope so far, but we do not use
number of breaches as a solid indicator of “better”
or “worse” as there are not only changes in our
contributors, but also changes in the types of events
our contributors may focus on year over year. Even
with such a drastic change, it isn’t unprecedented.
Figure 44 shows the volatility of breach counts of this
ilk. POS breaches are often conducted by organized
criminal groups looking to breach numerous targets
and there have been sprees of hundreds of victims
associated with the same hacking group. Back in 2011,
default credentials were used with great success
evidenced by over 400 breaches, and recent sprees
have been associated with POS vendors suffering
breaches leading to subsequent breaches
of their customer base.
36
0
100
200
300
400
2010 2012 2014 2016 2018
Breaches
Figure 44. POS intrusions in Accommodation
breaches over time
The absence of a large spree in this year’s data set
is reflected in the drop, but (and it seems like there is
always a “but”) after our window for data closed and
during this writing there has already been a publicly
disclosed POS vendor breach affecting multiple food
service victims.14
So, let this be the first ever sneak
peek into the 2020 DBIR – POS attacks are not quite
an endangered species.
14
https://ncbpdataevent.com/
And speaking of delivering bad news
Accommodation data breach victims are informed
of their plight the majority of the time via Common
Point of Purchase alerts as shown in Figure 45. In
fact, 100 percent of POS intrusions in this industry
were discovered via external methods. This is a
clear indicator that while there is work to be done
on preventative controls around POS compromise,
there is equal room for improvement in detecting
compromise. Being a realist and understanding that
many of these victims are “mom and pop” operations
asking for sophisticated file integrity software or
DLP is not a feasible plan of action for many of these
organizations. Working with POS vendors to ensure
that someone knows when the environment is
accessed via existing remote access methods is a
start. A pragmatic process to inform the business
owners that legitimate work is being done by the
partner would certainly be another simple step up
from the current state of affairs.
Table 3
Top threat action and asset pairings within Accommodation breaches (n= 61)
	 Action	 Asset	 Count 		
	 Malware - RAM scraper	 Server - POS controller	 32 		
	 Malware - RAM scraper	 User Dev - POS terminal	 27 		
	 Hacking - Use of stolen creds	 Server - Mail	 8 		
	 Social - Phishing	 Server - Mail	 8 		
	 Hacking - Use of stolen creds	 Server - POS controller	 7 		
	 Hacking - Use of stolen creds	 User Dev - POS terminal	 7 		
	 Malware - Backdoor	 Server - POS controller	 6 		
	 Malware - Backdoor	 User Dev - POS terminal	 6 	
	 Hacking - Brute force	 Server - POS controller	 5	
	 Hacking - Brute force	 User Dev - POS terminal	 3
37
IT review
Break in discovered
Log review
Law enforcement
Customer
Fraud detection
Breaches
Figure 45. Discovery methods in Accommodation breaches (n=42)
0% 20% 40% 60% 80% 100%
Cover your assets
The data shows year-over-year that
there is a malware problem affecting
POS controllers and terminals. Implement
anti-malware defenses across these
environments and validate (and re–vali-
date) the breadth of implementation and
currency of controls. Focus on detective
controls as well, the external correlation
of fraudulent usage of payment cards
should not be the sole means of finding
out that malware has been introduced
into your POS environment. Restrict
remote access to POS servers and
balance the business needs of intercon-
nectivity between POS systems among
your locations with defending against
the potential spread of malware from
the initial location compromised.
Sleep with one eye open
Since you can’t build a perfectly secure
system, security operations helps
monitor for those weird logins in the
middle of the night. If you can justify it
in your budget, a security operations
team is a must. Even if you can’t
afford an in-house team, contracting it
as a service or requiring it to be a part
of your POS or IT contracts will
cover you and allow you to benefit from
economies of scale.
Chips and Dip
When a chip-enabled card is dipped in a
properly configured EMV-enabled POS
terminal, the static, reusable magnetic
strip information (PAN) is not exposed
or stored. This is a good thing and along
with contactless payment methods,
disrupts the old way of stealing things
for the bad guys. The attacks against
EMV technology are more theoretical
and/or not conducive to real-world use.
We know that cyber-criminals are a
crafty bunch and nothing is bulletproof,
but continue to embrace and implement
new technologies that raise the bar to
protect against payment card fraud.
Things to consider:
No vacancy
The numbers from annual breach totals
are influenced by smaller food service
businesses caught up in what we have
described as POS smash-and-grabs.
Whether leveraging default credentials
or stolen credentials, organized criminal
groups often go after numerous little
fish – but not always. Several interna-
tional hotel chains and restaurants have
also been hit. While the initial intrusion
method may not have been as easy as
scanning the Internet and issuing a de-
fault password, there are some lessons
to be learned. Static authentication is
circumvented using valid credentials
and what follows is installation of RAM
scraping malware and adminware such
as psexec or PowerShell to facilitate
the spread of malware across multiple
terminals in multiple locations.
38
It’s in the syllabus
Anticipating the top pattern for Education each year
is a bit like playing the “which shell is it under?” game.
You know it’s (most likely) under one of three shells,
but when you finally point to one, the data proves you
wrong with a deft statistical sleight of hand. There
were three patterns in a statistical dead heat and like
the Netherlands’ women speed skaters in the 3000m,
it was a dominant podium sweep. Miscellaneous
Errors (35%) had a strong showing, because (spoiler
alert) people still have their moments. Most of these
errors are of the typical misdelivery and publishing
error types that we have all come to know and love.
Crimeware
Lost and Stolen Assets
Cyber-Espionage
Privilege Misuse
Everything Else
Web Applications
Miscellaneous Errors
Breaches
Figure 46. Patterns within Education breaches (n=99)
0% 20% 40% 60% 80% 100%
Web Application Attacks accounted for roughly one
quarter of breaches in the Education vertical.
This is mostly due to the frequent compromise of
cloud-based mail services via phishing links to
phony login pages. So, if you use such a service
24/7/...365 you might want to consider tightening
up your password security and implement a second
authentication factor and then turning off IMAP.
Education continues to be plagued by errors,
social engineering and inadequately secured email
credentials. With regard to incidents, DoS attacks
account for over half of all incidents in Education.
Frequency
Top 3 patterns
Threat actors
Actor motives
Data compromised
382 incidents, 99 with
confirmed data disclosure
Miscellaneous Errors,
Web Application Attacks,
and Everything Else
represent 80% of breaches
External (57%), Internal
(45%), Multiple parties (2%)
(breaches)
Financial (80%), Espionage
(11%), Fun (4%), Grudge (2%),
Ideology (2%) (breaches)
Personal (55%), Credentials
(53%), and Internal (35%)
(breaches)
Educational
Services
39
2016 2018
0
2
9
43
45%
2
2
5
12
79%
+2
0
-4
-31
+33
DIFF
Ideology
Grudge
Fun
Espionage
Financial
Breaches
Figure 49. External motives in Education
breaches over time n=44 (2016), n=42 (2018)
(Secondary motives excluded)
MitM
Exploit vuln
Brute force
Use of backdoor or C2
Use of stolen creds
Breaches
Figure 47. Hacking varieties in Education breaches (n=37)
0% 20% 40% 60% 80% 100%
Partner
Other
Desktop sharing
Backdoor or C2
Web application
Breaches
Figure 48. Hacking vectors in Education breaches (n=33)
0% 20% 40% 60% 80% 100%
Everything Else, as previously stated, is more or
less the pattern equivalent of a “lost and found” bin.
It contains numerous incident types we frequently
encounter but that do not provide enough granularity
for us to place in one of the other patterns. For exam-
ple, there are compromised mail servers, but it was
undetermined if stolen web credentials were the point
of entry. About half or more of these breaches could
be attributed to social engineering attacks via phishing.
When known, the motivation is primarily financial, and
is carried out mostly by organized criminal groups.
There was a smattering of state-affiliated or cyber-
espionage cases in this year’s data set, a reduction
from the 2017 report as shown in Figure 49. This
finding should not convince our readers that attacks
seeking research findings and other espionage-related
goals have gone the way of Home Economics in this
vertical, but is instead more related to the number and
type of incidents provided by our partners.
Figure 49. External motives in Education breaches over time
n=44 (2016), n=42 (2018) (Secondary motives excluded)
40
Things to consider:
Clean out your lockers
Many of the breaches that are repre-
sented in this industry are a result of
poor security hygiene and a lack of
attention to detail. Clean up human
error to the best extent possible – then
establish a baseline level of security
around internet-facing assets like web
servers. And in 2019, 2FA on those
servers is baseline security.
Varsity or JV?
Universities that partner with private 	
Silicon Valley companies, run policy
institutes or research centers are
probably more likely to be a target
of cyber-espionage than secondary
school districts. Understand what
data you have and the type of
adversary who historically seeks it.
Your institution of learning may not be
researching bleeding-edge tech, but
you have PII on students and faculty at
the very least.
Security conformity
There are threats that (no matter how
individualized one may feel) everyone
still has to contend with. Phishing and
general email security, Ransomware,
and DoS are all potential issues
that should be threat modeled and
addressed. These topics may not
seem new, but we still have not
learned our lesson.
41
Frequency
Top 3 patterns
Threat actors
Actor motives
Data compromised
Financial and
Insurance
927 incidents, 207 with
confirmed data disclosure
Web Applications, Privilege
Misuse, and Miscellaneous
Errors represent 72% of
breaches
External (72%), Internal
(36%), Multiple parties (10%),
Partner (2%) (breaches)
Financial (88%),
Espionage (10%) (breaches)
Personal (43%),
Credentials (38%),
Internal (38%) (breaches)
Filters are not just for social media photos
We use filters in data analysis to focus on particular
industries or threat actors and to pull out interesting
topics to discuss. We also exclude certain subsets of
data in order to reduce skew and avoid overlooking other
trends and findings. This is not to say that we ignore
or deny their existence, but rather we analyze them
Denial of Service and use of stolen credentials
on banking applications remain common.
Compromised email accounts become evident
once those attacked are filtered. ATM Skimming
continues to decline.
independently in other sections of this study. In this
industry, we acknowledge, but filter, customer
credential theft via banking Trojan botnets. Their
numbers in this year’s data set show that they are
not inconsequential matters, over 40,000 breaches
associated with botnets were separately analyzed
for the financial sector. We discuss both of these
scenarios in more depth in the Results and Analysis
section, but there is not much to say that has not
already been said on the subjects. Below is what’s left
and we will start with the common pairings of action
and asset varieties.
Keep in mind that breaches are often more than
one event, and sometimes more than one of the
combinations above are found in the same breach.
I’d rather be phishing
When we look at the two pairings that share mail
servers as an affected asset in Table 4, we can see
a story developing. Adversaries are utilizing social
engineering tactics on users and tricking them into
providing their web-based email credentials. That is
followed by the use of those stolen creds to access
the mail account. There are also breaches where the
method of mail server compromise was not known,
but the account was known to have been used to
send phishing emails to colleagues. So, while the
specific action of phishing is directed at a human (as,
by definition, social attacks are), it often precedes or
follows a mail server compromise. And there is no law
that states that phishing cannot both precede and
follow the access into the mail account (there are laws
against phishing, however). Phishing is also a great way
to deliver malicious payloads.
42
2017 2018
12
14
33
36%
38
21
14
43%
+27
+7
-20
+7
DIFF
Credentials
Bank
Payment
Personal
Breaches
Figure 50. Select data varieties in financial
breaches over time n=144 (2017), n=125 (2018)
Table 4
Top combinations of threat actions and assets, (n= 207)
	 Action	 Asset	 Count	
	 Hacking - Use of stolen creds	 Server - Mail	 43	
	 Social - Phishing	 Server - Mail	 41	
	 Hacking - Use of backdoor or C2	 User Dev - Desktop	 17		
	 Malware - C2	 User Dev - Desktop	 16 	
	 Physical - Skimmer	 Kiosk/Term - ATM	 16 	
	 Misuse - Privilege abuse	 Server - Database	 14		
	 Hacking - Use of stolen creds	 Server - Web application	 10	
	 Social - Phishing	 User Dev - Desktop	 10
	 Error - Misdelivery	 User Dev - Desktop	 9	
	 Malware - Backdoor	 User Dev - Desktop	 9	
End of an era?
Physical attacks against ATMs have seen a decline
from their heyday of the early 2010s. We are hopeful
that the progress made in the implementation of EMV
chips in debit cards, influenced by the liability shift
to ATM owners, is one reason for this decline. ATM
jackpotting is certainly an interesting way to make a
buck, but is not a widespread phenomenon. Figure 50
highlights the drop in Payment card data compromise
from last year’s report.
While payment card breaches are declining, personal
data is showing the largest gain from the 2018
report. Focusing on financial breaches where personal
data was compromised, social attacks (Everything
Else), misdelivery of data and misconfigurations
(Miscellaneous Errors), Web Applications and
Privilege Misuse are behind over 85 percent.
Figure 50. Select data varieties in Financial breaches over time
n=144 (2017), n=125 (2018)
43
Things to consider:
Do your part
2FA everything. Use strong
authentication on your customer-
facing applications, any remote
access, and any cloud-based email.
Contrarians will be quick to point out
examples of second authentication
factors being compromised,
but that does not excuse a lack of
implementation.
Squish the phish
There is little that financial
organizations can do to ensure that
their customers are running up-to-
date malware defenses or make them
“phish-proof,” but spreading a little
security awareness their way can’t hurt.
And speaking of security awareness,
leverage it to keep employees on their
toes when interacting with emails.
Inside job
There were 45 confirmed breaches
associated with misuse of privileges.
The details were light on most of
these but tried and true controls are
still relevant. Monitor and log access
to sensitive financial data (which we
think you are already), and make it
quite clear to staff that it is being
done and just how good you are at
recognizing fraudulent transactions.
In other words, “Misuse doesn’t pay.”
44
The doctor can’t see you now
(that you work for them)
Most people do not enjoy going to the hospital, but
once it becomes unavoidable we all need to believe
fervently that the good women and men who are
providing us care are just this side of perfect. Spoiler
alert: they are not. Healthcare is not only fast paced
and stressful, it is also a heavily-regulated industry.
Those who work in this vertical need to do things
right, do things fast, and remain in compliance with
legislation such as HIPAA and HITECH (in the US).
That in itself is a pretty tall order, but when one
combines that with the fact that the most common
threat actors in this industry are internal to the
organization, it can paint a rather challenging picture.
Healthcare stands out due to the majority of
breaches being associated with internal actors.
Denial of Service attacks are infrequent, but
availability issues arise in the form of ransomware.
Frequency
Top 3 patterns
Threat actors
Actor motives
Data compromised
466 incidents, 304 with
confirmed data disclosure
Miscellaneous Errors,
Privilege Misuse and Web
Applications represent 81% of
incidents within Healthcare
Internal (59%), External (42%),
Partner (4%), and Multiple
parties (3%) (breaches)
Financial (83%), Fun (6%),
Convenience (3%), Grudge (3%),
and Espionage (2%) (breaches)
Medical (72%),
Personal (34%),
Credentials (25%) (breaches)
Healthcare
With internal actors, the main problem is that they
have already been granted access to your systems
in order to do their jobs. One of the top pairings in
Table 5 between actions and assets for Healthcare
was privilege abuse (by internal actors) against
databases. Effectively monitoring and flagging
unusual and/or inappropriate access to data that is
not necessary for valid business use or required
for patient care is a matter of real concern for this
vertical. Across all industries, internal actor breaches
have been more difficult to detect, more often taking
years to detect than do those breaches involving
external actors.
Mailing it in
The Healthcare industry has a multifaceted problem
with mail, in both electronic and printed form. The
industry is not immune to the same illnesses we see
in other verticals such as the very common scenario
of phishing emails sent to dupe users into clicking and
entering their email credentials on a phony site. The
freshly stolen login information is then used to access
the user’s cloud-based mail account, and any patient
data that is chilling in the Inbox, or Sent Items, or other
folder for that matter is considered compromised – and
its disclosure time.
Misdelivery, sending data to the wrong recipient, is
another common threat action variety that plagues
the Healthcare industry. It is the most common error
type that leads to data breaches as shown in Figure 51.
As seen in Table 5 on the next page, documents are
a commonly compromised asset. This could be due
to errors in mailing paperwork to the patient’s home
address or by issuance of discharge papers or other
medical records to the wrong recipient.
Ransomware “breaches”
Most ransomware incidents are not defined as
breaches in this study due to their lack of the
required confirmation of data loss. Unfortunately
for them, Healthcare organizations are required to
disclose ransomware attacks as though they
45
Misconfiguration
Loss
Disposal error
Publishing error
Misdelivery
Breaches
Figure 51. Top error varieties in Healthcare breaches (n=109)
0% 20% 40% 60% 80% 100%
were confirmed breaches due to U.S. regulatory
requirements. This compulsory action will influence the
number of ransomware incidents associated with the
Healthcare sector. Acknowledging the bias, this is the
second straight year that ransomware incidents were
over 70 percent of all malware outbreaks in this vertical.
Things to consider:
Easy access
Know where your major data stores are,
limit necessary access, and track all
access attempts. Start with monitoring
the users who have a lot of access that
might not be necessary to perform their
jobs, and make a goal of finding any
unnecessary lookups.
Snitches don’t get stitches
Work on improving phishing reporting to
more quickly respond to early clickers
and prevent late clickers. Think about
reward-based motivation if you can—you
catch more flies with honey. And you can
catch phish with flies. Coincidence?
Perfectly imperfect
Know which processes deliver, publish
or dispose of personal or medical
information and ensure they include
checks so that one mistake doesn’t
equate to one breach.
Table 5
Top pairs of threat action varieties and asset varieties, (n= 304)
	Action	 Asset	 Count	 	
	 Hacking - Use of stolen creds	 Server - Mail	 51	
	 Misuse - Privilege abuse	 Server - Database	 51	
	 Social - Phishing	 Server - Mail	 48	
	 Error - Misdelivery	 Media - Documents	 30	
	 Physical - Theft	 Media - Documents	 14	
	 Error - Publishing error	 Server - Web application	 13	
	 Error - Disposal error	 Media - Documents	 12	
	 Error - Loss	 Media - Documents	 12	
	 Error - Misdelivery	 User Dev - Desktop	 12	
	 Hacking - Use of stolen creds	 Person - End-user	 7
46
The Information Society
The Information industry is a veritable pantechnicon
(look it up) that is chock-full of organizations that
have to do with the creation, transmission and
storing of information. One might think that with so
wide an array of victims, the attacks would be all
over the place, but, in fact, it is our duty to inform
you that much of what we saw in this category
for the 2019 report mirrors last year’s results. As
was the case in 2018, most of the incidents in this
industry consists of DoS attacks (63%). In fact, it
is perhaps fitting that this industry covers both TV
and motion pictures, since it is in many ways a rerun
of last year’s programming when viewed from an
incident point of view.
Web applications are targeted with availability
attacks as well as leveraged for access to
cloud-based organizational email accounts.
Frequency
Top 3 patterns
Threat actors
Actor motives
Data compromised
1,094 Incidents, 155 with
confirmed data disclosure
Miscellaneous Errors,
Web Applications, and Cyber-
Espionage represent 83% of
breaches within Information
External (56%), Internal (44%),
Partner (2%) (breaches)
Financial (67%), Espionage
(29%) (breaches)
Personal (47%), Credentials
(34%), Secrets (22%) (breaches)
Information
Malfunction
Omission
Misdelivery
Programming error
Publishing error
Misconfiguration
Breaches
Figure 52. Error varieties in Information breaches (n=66)
0% 20% 40% 60% 80% 100%
With regard to confirmed data disclosure, two of
the top three patterns remain the same as last
year (albeit in a different order) and we have one
newcomer. In order of frequency, the patterns are
Miscellaneous Errors (42%), Web App attacks (29%)
and Cyber-Espionage (13%). Let’s take a quick look
at the most common errors below.
47
Faulty towers
No one is perfect, but when you are a system administra-
tor you are often provided with a better stage on which
to showcase that imperfection. Figure 52 illustrates how
errors are put in the spotlight. Our data indicates that
misconfiguration (45%) and publishing errors (24%) are
common miscues that allowed data disclosure to occur.
When looking at the relationship between actions and
assets in Table 6, 36% (24 of 67) of error-related breach-
es involved misconfigurations on databases, often cloud
storage – not good. Obviously, those buckets of data
are meant to store lots of information and if your bucket
has a (figurative) hole in it, then it may run completely
dry before you make it back home from the well and
notice. Often these servers are brought online in haste
and configured to be open to the public, while storing
non-public data. Publishing errors on web applications
offer a similar exposure of data to a much wider than
intended audience. Just for cmd shift and giggles, we
will mention that programming errors were committed
on web servers and a couple of databases.
It’s not only Charlotte’s Web (apps) you can read about
Even if your IT department doesn’t make big mistakes
like the poor unfortunate souls above, there is no need
to worry. You still have more excellent chances to get
your data stolen. Criminals do love a tempting freshly
baked (or half-baked) web application to attack. The illicit
use (and reuse) of stolen creds is a common hacking
action against web applications regardless of industry.
The malware action variety of capture app data is more
commonly associated with e-retailers, the application
data being captured is the user inputting payment
information. While not as common, any internet portals
or membership sites that sell content as opposed to a
physical product would fall into the Information sector.
And payment cards used to purchase content are just as
good to steal as ones used to buy shoes online.
Table 6
Top pairs of threat action varieties and asset varieties, (n= 155)
	Action	 Asset	 Count	
	 Error - Misconfiguration	 Server - Database	 24	
	 Social - Phishing	 Person - Unknown	 22	
	 Hacking - Unknown	 Server - Web application	 19	
	 Malware - C2	 User Dev - Desktop	 16	
	 Social - Phishing	 User Dev - Desktop	 16	
	 Malware - Backdoor	 Person - Unknown	 15	
	 Malware - Backdoor	 User Dev - Desktop	 15	
	 Malware - C2	 Person - Unknown	 15	
	 Error - Publishing error	 Server - Web application	 14	
	 Hacking - Use of stolen creds	 Person - Unknown	 14
48
Things to consider:
Asset assistance
Whether intentional web attacks or erroneous
actions, both databases and web application
servers are oft-compromised assets,
especially for this industry. Many will complain
about”‘checklist security” but a standard
protocol regarding bringing up cloud servers
and publishing sensitive data on websites – if
implemented and followed – would go a long
way to mitigate human error/carelessness.
Scrubbing packets
While breaches were at the forefront of this
section, DDoS protection is an essential control
for Information entities given the percentage
of Denial of Service incidents. Guard against
non-malicious interruptions with continuous
monitoring and capacity planning for traffic
spikes.
It bears repeating
Knowledge is power, and the increase in
state-affiliated attacks is a data point we will
keep an eye on. It could very well be a spike
and not indicative of a trend, but Information
organizations have desirable data and these
motivations would not be likely to disappear in
a year. Understand that these attacks are often
“phishy” in nature and start with a compromised
workstation and escalate from there.
I spy with my little eye, something phished
The third pattern in Information breaches we
highlight is Cyber-Espionage. An eye opening
36 percent of external attackers were of the state-
affiliated variety, statistically even with organized
crime. As we have pointed out many times in the
past, most Cyber-Espionage attacks begin with a
successful phishing campaign and that goes some
way to explain why 84 perecent of social attacks in
this industry featured phishing emails.
Sir Francis Bacon once famously stated “knowledge
is power.” Perhaps a better definition for 2019 would
be “to gain and to control information is power.”
Therefore, we should probably not be shocked
that the organizations that own and distribute that
information are the target of such attacks.
49
Ethan Hunt15
have finally routed their respective
nemeses for good? Are we free to buy the world
a Coke and teach it to sing in perfect harmony?
Probably not. A more likely explanation is that some
of our partners who typically provide data around
cyber-espionage were either unable to participate
this year or simply happened to work other types of
investigations. This may have contributed to a bias
on those results, meaning the real percentage of
cyber-espionage cases was higher in the wild. If the
relative percentage of one type of case goes down,
the result is an apparent upswing in the other.
Lost and Stolen Assets
Crimeware
Everything Else
Miscellaneous Errors
Cyber-Espionage
Privilege Misuse
Web Applications
Breaches
Figure 53. Patterns in Manufacturing breaches (n=87)
0% 20% 40% 60% 80% 100%
Frequency
Top 3 patterns
Threat actors
Actor motives
Data compromised
Manufacturing
352 incidents, 87 with
confirmed data disclosure
Web Applications, Privilege
Misuse, and Cyber-Espionage
represent 71% of breaches
External (75%), Internal (30%),
Multiple parties (6%), Partner
(1%) (breaches)
Financial (68%),
Espionage (27%), Grudge
(3%), Fun (2%) (breaches)
Credentials (49%),
Internal (41%), Secrets (36%)
(breaches)
Uncle Owen, this R2 unit has a financial motivator
For the second year in a row, financially motivated
attacks outnumber cyber-espionage as the main
reason for breaches in Manufacturing, and this year
by a more significant percentage (40% difference).
If this were in most any other vertical, it would not
be worth mentioning as money is the reason for the
vast majority of attacks. However, Manufacturing
has experienced a higher level of espionage-related
breaches than other verticals in the past few years.
So, shall we conclude that James Bond and
Manufacturing has been experiencing an
increase in financially motivated breaches in the
past couple of years, but espionage is still a
strong motivator. Most breaches involve phishing
and the use of stolen credentials.
15
Old-school readers, feel free to substitute Rollin Hand as the pop culture reference here if preferred.
50
Desktop sharing software
Desktop sharing
VPN
Backdoor or C2
Web application
Breaches
Figure 55. Hacking vectors in Manufacturing breaches (n=49)
0% 20% 40% 60% 80% 100%
Speaking to the web application attacks, this industry
shares the same burden of dealing with stolen web-
mail credentials as other industries. Most breaches
with a web application as a vector also featured a mail
server as an affected asset. From an overall breach
perspective, the use of stolen credentials and web
applications were the most common hacking action
and vector – see Figures 54 and 55.
URL redirector abuse
Path traversal
Buffer overflow
SQLi
Other
Brute force
Abuse of functionality
Use of backdoor or C2
Exploit vuln
Use of stolen creds
Breaches
Figure 54. Hacking varieties in Manufacturing breaches (n=43)
0% 20% 40% 60% 80% 100%
51
Secrets and truths
The Cyber-Espionage pattern, while not as prominent
as in past reports, is still an attack type that we
recommend the Manufacturing industry defend
against. The typical utilization of phishing attacks to
convince users to install remote access tools that
establish footholds and begin the journey towards
stealing important competitive information from
victims remains the same.
In keeping with the aforementioned rise in financially
motivated attacks, the primary perpetrator when
known is organized crime. With regard to data variety,
there is a group of four data types that feature
prominently in this industry. Credentials (49%) and
Internal data (41%), stem from the webmail attacks – if
a more specific data type is not known, Internal is
used for compromised organizational emails. Secrets
(36%) drop from previous heights commensurate to
the reduction in espionage as a motive. The fourth
amigo is Personal information (25%), a data type
that includes employee’s W-2 information and other
nuggets that can be used for identity theft.
Things to consider:
Multiple factors work better
than one
It is a good idea to deploy multiple
factor authentication throughout all
systems that support it, and discourage
password reuse. These actions
will definitely help mitigate the impact
of stolen credentials across the
organization.
Recycling also applies for security
Regardless of motivation, a large
number of breaches in this sector
started with phishing or pretexting
attacks. Providing employees with
frequent security training opportunities
can help reduce the likelihood they will
be reeled in by one of those attacks.
Workers must use safety
equipment at all times
Unless inconvenient to do so – due to
the prevalence of malware usage in the
espionage breaches, it is advisable to
deploy and keep up-to-date solutions
that can help detect and stop those
threats.
52
Frequency
Top 3 patterns
Threat actors
Actor motives
Data compromised
Professional, Technical
and Scientific Services
670 incidents, 157 with
confirmed data disclosure
Web Applications, Everything
Else, and Miscellaneous Errors
represent 81% of breaches
within Professional Services
External (77%), Internal (21%),
Partner (5%), Multiple parties
(3%) (breaches)
Financial (88%), Espionage
(14%), Convenience (2%)
(breaches)
Credentials (50%),
Internal (50%), Personal (46%)
(breaches)
Wide range of services, narrower range of threats
Professional Services is a broad category even by
NAICS standards, and the members of its ranks
include law offices, advertising agencies, and
engineering and design firms, to name only a few.
Starting with a focus on the data lost in the 157
Professional Services breaches, Figure 56 gives us
an idea of the types of data most commonly involved
in these cases.
Phishing and credential theft associated with cloud-
based mail accounts have risen as the prominent
attack types.
2014 2018
54
23
19%
54
50
46%
0
+28
+27
DIFF
Internal
or
Secrets
Credentials
Personal
Breaches
Figure 56. Top data varieties in
professional service breaches over time,
n=105 (2014), n=137 (2018)
We see an overall increase in Personal data and
Credentials breached. A lot of this comes from
breaches now compromising multiple data types at
the same time. Often, credentials are the key that
opens the door for other actions. Figure 57 shows
that most of the time, it’s on the way to compromise
Internal and/or Personal data. This is indicative of
gaining access to a user’s inbox via webmail login
using stolen credentials.
Figure 56. Top error varieties in Professional Services breaches
over time, n=105 (2014), n=137 (2018)
53
Integrity
Confidentiality
Availability
Steps
Action Error Malware Social Hacking Misuse Unknown
Figure 59. Confidentiality attack chains for Professional Services incidents (n=90)
Misuse and error are short paths while social and hacking take longer.
4 23 01
Executive staff compromised
Use of stolen creds
Finance staff compromised
Pretexting
Incidents
Figure 58. Select enumerations in fraudulent transaction
incidents (n=41)
0% 20% 40% 60% 80% 100%
Sometimes you just have to ask
Credentials compromising email...sounds a lot like
Business Email Compromise doesn’t it? Figure 58
provides ample evidence that BECs are an issue
for Professional Services. Financial staff were the
most likely to be compromised in incidents involving
fraudulent transactions, but it should be noted that
executives were compromised in 20 percent of the
incidentsand are 6x more likely to be the asset
compromised in Professional Services breaches than
the median industry. You have to hand it to the attackers.
At some point one must have thought “why don’t we
skip all the hard hacking and just, you know, ask for
the money?”
No other variety
Personal
Internal
Breaches
Figure 57. Other data varieties in Professional Services
credential breaches (n=69)
0% 20% 40% 60% 80% 100%
Paths of the unrighteous
To wrap up, Figure 59 illustrates the single
step Misuse and Error breaches, but also
shows us the Social and Hacking breaches
that take slightly longer to develop. All of it
provides excellent immediate teaching mo-
ments for any organization.
54
Things to consider:
One is the loneliest number
We don’t like saying it any more than you like
hearing it, but static credentials are the keys.
Password managers and two-factor authentica-
tion are the spool pins in the lock. Don’t forget to
audit where all your doors are. It doesn’t help to
put XO-9s on most of your entrances if you’ve
got one in the back rocking a screen door.
Social butterflies
You know a great way to capture credentials?
A social attack. At least we know where it’s
coming from. Monitor email for links and
executables (including macro-enabled Office
docs). Give your team a way to report potential
phishing or pretexting.
To err is human
Set your staff up for success. Monitor what
processes access personal data and add in
redundant controls so that a single mistake
doesn’t result in a breach.
55
Frequency
Top 3 patterns
Threat actors
Actor motives
Data compromised
Given the sheer number of incidents in this sector, you
would think that the government incident responders
must either be cape and tights wearing super heroes,
or so stressed they’re barely hanging on by their
fingernails. And while that may yet be the case, keep
in mind that we do have very good visibility into this
industry, in part due to regulatory requirements that
members (at least in the United States) must report
their incidents to one of our data sharing partners (the
US-CERT). Arguably more interesting is the fact that
with similar breach numbers from last year’s report,
the makeup of the breaches has seen some change.
Master of whisperers
While the Cyber-Espionage pattern was also the most
prominent in this industry in last year’s report, the
number of breaches in the Cyber-Espionage pattern is
168% of last year’s amount. Figure 60 shows how the
percentages shifted from last year.
Cyber-Espionage is rampant in the Public sector, with
State-affiliated actors accounting for 79 percent of all
breaches involving external actors. Privilege Misuse and
Error by insiders account for 30 percent of breaches.
23,399 incidents, 330 with
confirmed data disclosure
Cyber-Espionage,
Miscellaneous Errors and
Privilege Misuse represent
72% of breaches
External (75%), Internal (30%),
Partner (1%), Multiple parties
(6%) (breaches)
Espionage (66%), Financial
(29%), Other (2%) (breaches)
Internal (68%), Personal (22%),
Credentials (12%) (breaches)
Public
Administration
The most common pairings of threat actions and
assets in Table 7 tells a story that is as easy to follow
as “See Spot Send Malicious Attachments and Gain a
Foothold.” We have a gang of five threat actions found
in breaches that had a human asset16
and a workstation
as affected assets. We are seeing the familiar phish 
backdoor/C2  use of the newly acquired channel into
the network. Admittedly we do not have as much data
as to what is happening beyond the deception and
initial device compromise. The inclusion of keylogging
malware is a good indicator that additional credential
theft and reuse is a likely next step.
2017 2018
16
16
17
17
25%
18
10
12
11
42%
+1
-6
-5
-6
+17
DIFF
Miscellaneous Errors
Web Applications
Privilege Misuse
Everything Else
Cyber-Espionage
Breaches
Figure 60. Patterns in public breaches
over time n=305 (2017), n=330 (2018)
16
Person – Unknown was not filtered out due to the amount of phishing without a known organizational role associated with the target.
Figure 60. Patterns in Public breaches over time
n=305 (2017), n=330 (2018)
56
Clicked
Reported
0%
2%
5%
8%
10%
Minute Hour Day Week
SimulatedPhishes
Figure 61. Click and reporting rate in
public simulated phishes over time
I click, therefore I am
Since we have established a bit of a problem with
malicious emails, we wanted to dig more into the
security awareness training data provided to us this
year. Figure 61 shows how quickly employees in this
sector are clicking or reporting on phishing emails.
Early on in the training similar percentages of users
are clicking and reporting, but reporting drops off
after the first hour, where clicking is more active.
Not optimal, but since this was sanctioned and not
actually malicious, nothing was done after the initial
reporting other than an “atta boy.” Having documented,
understood, and tested incident response plans to
the real thing will allow the containment process to
begin during that first hour to limit the effectiveness
and impact through quick identification. This should
also limit the opportunity for the users who are not
KonMari-ing their inboxes to interact with the malicious
message days later.
Table 7
Common threat action and asset combinations within Public breaches, (n=330)
	Action	 Asset	 Count	
	 Social - Phishing	 Person - Unknown	 155	
	 Social - Phishing	 User Dev - Desktop	 139	
	 Malware - Backdoor	 Person - Unknown	 130	
	 Malware - Backdoor	 User Dev - Desktop	 129	
	 Hacking - Use of backdoor or C2	 Person - Unknown	 119	
	 Hacking - Use of backdoor or C2	 User Dev - Desktop	 119	
	 Malware - C2	 User Dev - Desktop	 100	
	 Malware - C2	 Person - Unknown	 99	
	 Malware - Spyware/Keylogger	 User Dev - Desktop	 82	
	 Malware - Spyware/Keylogger	 Person - Unknown	 81
57
Weeks
Days
Months
Years
Breaches
Figure 62. Time-to-discovery in Public breaches (n=32)
0% 20% 40% 60% 80% 100%
The wheels of government discover slowly
When there is enough detail to derive breach timeline
metrics, the data shows that breaches in the Public
sector are taking months and years to be discovered.
Public breaches are over 2.5 times more likely to be
undiscovered for years. Espionage-related breaches
typically do take longer to discover due to the lack of
external fraud detection, but we did not have timeline
data for those breaches. Privilege Misuse is the
most common pattern within breaches that went
undiscovered for months or more.
Things to consider:
Understand the human factor
Not just from a phishing target standpoint.
Errors in the forms of misdelivery and
erroneous publishing of data rear their
risky heads again. Insider misuse is also
still a concern, so ensure efforts are
taken to routinely assess user privileges.
Limit the amount of damage an employee
acting inappropriately or maliciously can
do with existing privileges.
Lookin’ out my backdoor
While not as obvious as cartwheeling
giants, validate there are controls
in place to look for suspicious egress
traffic that could be indicative of
backdoor or C2 malware installation.
The malware conundrum
Large government entities with a
massive community of end-points face
a challenge in ensuring the breadth
of up-to-date malware defenses are
implemented. Smaller organizations may
lack the budget for additional malware
defenses other than desktop AV.
Make friends with the desktop security
folks and find out what their specific
challenges are.
58
20142018
0
0
0
1
3
5
6
10
13
63%
1
0
2
8
10
63
3
2
6
6%
+1
0
+2
+7
+7
+58
-3
-7
-7
-57
DIFF
Cyber-
Espionage
Denial of
Service
Lost and
Stolen Assets
Miscellaneous
Errors
Privilege
Misuse
Web
Applications
Payment Card
Skimmers
Crimeware
Everything
Else
Point of Sale
Breaches
Figure 63. Patterns in retail breaches over time
n=145 (2014), n=139 (2018)
Frequency
Top 3 patterns
Threat actors
Actor motives
Data compromised
Retail
234 incidents, 139 with
confirmed data disclosure
Web Applications, Privilege
Misuse, and Miscellaneous
Errors represent 81% of
breaches
External (81%), Internal (19%)
(breaches)
Financial (97%), Fun (2%),
Espionage (2%) (breaches)
Payment (64%),
Credentials (20%),
Personal (16%) (breaches)
Not such a POS anymore
Let’s jump in our DBIR time machine and travel all the
way back to four years ago. It was the second year
that we featured the incident classification patterns
and the top pattern for Retail was POS Intrusion, along
with remote compromise of point of sale environments,
with all of the malware and payment card exfiltration
that comes with it. Coming back to the present year’s
data set in Figure 63, the times they are a-changing.
Card present breaches involving POS compromises
or gas-pump skimmers continue to decline. Attacks
against e-commerce payment applications are
satisfying the financial motives of the threat actors
targeting this industry.
Figure 63. Patterns in Retail breaches over time
n=145 (2014), n=139 (2018)
59
Essentially, Web application attacks have punched the
time clock and relieved POS Intrusion of their duties.
This is not just a retail-specific phenomenon – Figure
64 comes courtesy of our friends at the National
Cyber-Forensics and Training Alliance (NCFTA) and
their tracking of card-present versus card-not-present
fraud independent of victim industry.
Card-present
Card-not-present25%
50%
75%
2016 2017 2018 2019
Figure 64. Comparison of card-present vs.
card-not-present fraud
Table 8
Top action and asset variety combinations within Retail breaches, (n=139)
The above shift certainly supports the reduction
in POS breaches, and to a lesser extent, Payment
Card Skimming. Pay at the pump terminals at gas
stations would fall into the retail industry as well. We
are cautiously optimistic that EMV has diminished
the value proposition of card-present fraud for the
cyber-criminals in our midst. Alas, it will still not
make criminal elements eschew money and move to
self-sustaining communes to lead simpler lives.
One door closes, kick in another one
Attacks against e-commerce web applications continue
their renaissance. This is shown in Figure 64 on the left
as well as Figure 26 back in the Results and Analysis
section. To find out more about what tactics are used
in attacks against payment applications we will go
back to pairings of threat actions and affected assets.
The general modus operandi can be gleaned from
Table 8 below. Attacker compromises a web application
and installs code into the payment application that
will capture customer payment card details as they
complete their purchases. Some breaches had details
that specified a form-grabber which would be
categorized under Spyware/Keylogger as it is another
method of user input capture. Other times limited
information was provided other than a statement
	 Action	 Asset	 Count 	
	 Malware - Capture app data	 Server - Web application	 49	
	 Malware - Spyware/Keylogger	 Server - Web application	 39	
	 Hacking - Exploit vuln	 Server - Web application	 15	
	 Hacking - RFI	 Server - Web application	 11	
	 Malware - Ram scraper	 Server - POS controller	 8	
	 Malware - Ram scraper	 User Dev - POS terminal	 7	
	 Hacking - Use of stolen creds	 Server - Database	 6	
	 Hacking - Use of stolen creds	 Server - Mail	 6	
	 Hacking - Use of stolen creds	 Server - Web application	 6	
	 Misuse - Privilege abuse	 Server - Database	 5
60
similar to “malicious code that harvested payment
card data.” The more general functionality of
capture app data was used in those instances.
In reality there is likely little to no difference between
the two pairings. We are also a little short on
information on how the web application was
compromised. If a specific method like RFI is noted,
we collect it. Often it may be a general notation
that a web vuln was exploited, hence the Exploit Vuln
variety (new to the latest version of VERIS!). Looking
at what we do know and channeling our inner William
of Ockham, this general chain of events is likely: scan
for specific web application vulnerabilities  exploit
and gain access  drop malware  harvest payment
card data  profit. We have seen webshell backdoors
involved in between the initial hack and introduction
of malware in prior breaches. While that action was
not recorded in significant numbers in this data set,
it is an additional breadcrumb to look for in detection
efforts. In brief, vulnerable internet-facing e-commerce
applications provide an avenue for efficient, auto-
mated, and scalable attacks. And there are criminal
groups that specialize in these types of attacks that
feast on low-hanging fruit.
Things to consider:
Integrity is integral
The web application compromises are no
longer attacks against data at rest. Code is
being injected to capture customer data
as they enter it into web forms. Widespread
implementation of file integrity software may
not be a feasible undertaking. Adding this
to your malware defenses on payment sites
should be considered. This is, of course,
in addition to patching OS, and payment
application code.
Brick and Mort(ar)y
Continue to embrace technologies that make it
harder for criminals to turn your POS terminals
into machines of unspeakable doom. EMV, mobile
wallets – any method that utilizes a one-time trans-
action code as opposed to PAN is a good thing.
Not just PCI
Payment cards are not the only data variety that
would be useful to the criminally-minded community.
Rewards programs that can be leveraged for the
“points” or for the personal information of your
customer base are also potential targets.
61
17
We do not assert that your decisions would differ wildly as we do not have sufficient data to support that statement. It is, admittedly, a surmise on our part but internal research remains ongoing.
So, this concludes our 12th installment of this annual report. If the DBIR were a bottle of
decent Scotch whiskey it would cost you around 100 bucks, instead of being free like this
document. Likewise, the decisions you might make after finishing them would probably
differ wildly as well.17
Nevertheless, we hope you gain a certain degree of enjoyment and
enlightenment from both.
On behalf of the team that labored to produce this document, we sincerely thank you,
our readers, for your continued support and encouragement of this effort. We believe it
to be of value to Information Security professionals and to industry at large, and we are
grateful for the opportunity to bring it before you once again. As always, a tremendous
thank you to our contributors who give of their time, effort, insight, and most importantly,
their data. The task of creating this document is in no way trivial and we simply could
not do it without their generosity of resources. We look forward to bringing you our 14th
report (we are taking the high-rise hotel concept of enumeration here) next year, and in
the meantime, may your security budgets be large and your attack surface small. Until
then, feel free to reflect on the more noteworthy publicly disclosed security events in
2018 from the VTRAC before jumping into the Appendices.
Wrap up
62
January
On the second day of the
year, the Verizon Threat
Research Advisory Center
(VTRAC) began to learn that
researchers had discovered
“Meltdown” and “Spectre,”
new information disclosure
vulnerabilities in most
modern microprocessors.
The vulnerabilities lie in
foundational CPU architec-
tures. Patching continued
through 2018. We collected
no reports of successful
Meltdown or Spectre attacks
in 2018. The first week of
the month included the first
report of malware attacks
targeting the 2018 Winter
Olympics in Pyeongchang,
Republic of Korea. Investi-
gative journalists reported
India’s national ID database,
“Aadhaar,” suffered a data
breach affecting more than
1.2 billion Indian citizens.
We began collecting reports
of targeted attacks on Latin
American banks. Attackers
used disk wiping malware,
probably to eliminate
evidence of their actions
and minimize the scale
of the banks’ losses. On
January 26th, we collected
the first report of GandCrab
ransomware.
February
The first “zero-day” in Adobe
Flash kicked off February
after APT37 embedded
an exploit in Excel spread-
sheets. The Punjab National
Bank reported fraudulent
transfers of ₹11,600 crore
(USD 1.77 billion dollars).
The Russian Central Bank
reported “unsanctioned
operations” caused the loss
of ₽339 million (€4.8 million).
“Olympic Destroyer” malware
disrupted the opening cer-
emony of the Pyeongchang
Olympics but did not result
in their cancellation. GitHub
was hit with a new type
of reflection denial of service
attack leveraging mis-
configured memcached
servers. GitHub and other
organizations endured
1.35-terabit-per-second junk
traffic storms.
March
Intelligence for attacks on
the Pyeongchang Olympics
continued after the February
25th closing ceremonies.
Operations Gold Dragon,
HaoBao and Honeybee
began as early as July 2017.
In March, we collected
intelligence on a full
spectrum of APT-grade
threat actors including
APT28, menuPass (APT10),
Patchwork, MuddyWater,
OilRig, Lazarus and Cobalt.
US-CERT published 15 files
with intelligence on Russian
actors attacking critical
infrastructure in the USA.
Malaysia’s Central Bank
foiled an attack that involved
falsified SWIFT wire-transfer
requests. The Drupal
project patched a remote
code execution vulnerability
reminiscent of the 2014
vulnerability that led to
“Drupalgeddon.”
April
Attacks on “smart install”
software in Cisco IOS
switches by Russian threat
actors were probably the
most noteworthy InfoSec
risk development in April.
The VTRAC collected
updated intelligence on the
“Energetic Bear” Russian
actor. A supply-chain attack
on Latitude Technologies
forced four natural-gas
pipeline operators to
temporarily shut down
computer communications
with their customers.
Latitude supplies Electronic
Data Interchange (EDI)
services to the Energy and
Oil verticals. March’s Drupal
vulnerability did indeed
attract cybercriminals. A
variant of the Mirai IoT
botnet began scanning for
vulnerable Drupal servers
and the subsequent
compromises to install
cryptomining software
became known as
Drupalgeddon2. The
cyber-heist of US$150,000
in Ethereum from
MyEtherWallet paled in
significance to the BGP
hijacking of the Internet’s
infrastructure to do it.
Year in review
63
May
Intelligence about the
“Double Kill” zero-day
vulnerability in Internet
Explorer was collected at
the end of April. In May, the
VTRAC collected intelligence
of a malicious PDF docu-
ment with two more zero-day
vulnerabilities, one each in
Adobe PDF Reader and in
Windows. Microsoft and
Adobe patched all three
on May’s Patch Tuesday.
A surge in GandCrab
ransomware infections were
the focus of several of the
best intelligence collections
in May. New intelligence
collections documented
the Cobalt threat actor’s
phishing campaign was
targeting the financial
sector. Multiple sources
reported VPNFilter malware
had infected routers and
network-attached storage
(NAS) appliances. Control
the router—control the traffic
passing through it.
June
Multiple sources released
updated intelligence on
North Korean threat actors
engaged in cyber-conflict
and cybercrime operations.
Adobe patched a new
zero-day vulnerability in
Flash. Like February’s, Flash
zero-day, it was being used
in malicious Excel files but
the targets were in the
Middle East. Two Canadian
Imperial Bank of Commerce
subsidiaries – BMO (Bank
of Montreal) and Simplii
Financial suffered a leak
of about 90,000 customer
records. They learned of the
breach when threat actors
demanded US$750,000 for
the return of the records.
The Lazarus threat actor
stole roughly KR ₩35 billion
(around $31 million) in
cryptocurrency from the
South Korea-based
exchange Bithumb. DanaBot,
a new banking Trojan was
discovered targeting
Commonwealth Bank in
Australia.
July
The first major Magecart
attack in 2018 was
Ticketmaster’s UK branch.
Hackers compromised
Inbenta, a third-party
functionality supplier. From
Inbenta they placed digital
skimmers on several
Ticketmaster websites.
The Ticketmaster attack
was part of a campaign
targeting third-party
providers to perform
widespread compromises of
card data. July’s Magecart
collections included
indicators of compromise of
over 800 victim websites.
A malicious Mobile Device
Management platform was
used in highly targeted
attacks on 13 iPhones and
some Android and Windows
platforms. Russia’s PIR Bank
lost ₽58 million ($920,000)
after the MoneyTaker actor
compromised an outdated,
unsupported Cisco router at
a branch office and used it to
pivot into the bank’s network.
August
The second Boundary
Gateway Protocol (BGP)
hijacking to steal
cryptocurrency in 2018
redirected legitimate traffic
from an Amazon DNS server.
The malicious DNS server
redirected users of
MyEtherWallet to a spoofed
site that harvested their
credentials. Users of the
service lost Ethereum worth
about $152,000. Cosmos
Bank in Pune, India, was the
victim of US$13.4 million of
fraudulent SWIFT and ATM
transfers. The US Dept.
of Justice announced the
arrests of three managers
from the FIN7 (Anunak,
Carbanak, Carbon Spider)
threat actor. Intelligence
indicated a new vulnerability
in Apache Struts, CVE-2018-
11776, was following the
course set by March 2017’s
CVE-2017-9805, the
Jakarta multi-parser Struts
vulnerability. The 2017
vulnerability led to the
Equifax data breach. A
detailed code reuse
examination of malware
linked to North Korea linked
most malware attacks to
the Lazarus Group. APT37
was linked to a small portion
but was assessed to be
more skilled and reserved for
attacks with national
strategic objectives.
64
September
New intelligence revealed
Japanese corporations
were being targeted by the
menuPass (APT10) threat
actor. On September 6th,
British Airways announced
it had suffered a breach
resulting in the theft of cus-
tomer data. Within a week,
we collected intelligence
British Airways had become
another victim of a Magecart
attack. Intelligence indicated
in the preceding 6 months,
7,339 E-commerce sites had
hosted Magecart payment
card skimming scripts includ-
ing online retailer Newegg.
Weaponized IQY (Excel Web
Query) attachments were
discovered attempting to
evade detection to deliver
payloads of FlawedAmmyy
remote access Trojan (RAT).
The FBI and DHS issued
an alert about the Remote
Desktop Protocol (RDP).
The alert listed several
threats that exploit RDP
connections: Crysis
(Dharma), Crypton and
SamSam ransomware
families. DanaBot expanded
its target set to Italy,
Germany and Austria.
October
The VTRAC assessed
claims that Chinese actors
had compromised the
technology supply chain did
not constitute intelligence.
The related report lacked
technical details or
corroboration and was
based on unqualified,
unidentified sources.
US-CERT issued an updated
alert on attacks on MSS
providers by the menuPass
(APT10) threat actor.
Multiple sources reported
North Korean actors
engaged cybercrime attacks
intended to provide revenue
to the sanction-constrained
regime. GreyEnergy is the
latest successor to the
Sandworm/BlackEnergy/
Quedagh/Telebots threat
actor. GreyEnergy was
linked to attacks on the
energy sector and other
strategic targets in Ukraine
and Poland for the past
three years. DanaBot began
targeting financial services
establishments in the USA.
The Magecart threat actors
executed a scaled supply
chain attack on Shopper
Approved, a customer
scoring plugin used by
7000+ e-commerce sites.
Detailed reports in August
and October indicated the
Cobalt threat actor had
reorganized into a group with
journeymen and apprentice
members and a second
group of masters reserved
for more sophisticated
campaigns.
November
Intelligence based on
examination of Magecart
malware indicated there
are at least six independent
threat actors conducting
Magecart attacks. The initial
Magecart successes in late
2016 and high-profile attacks
beginning with Ticketmaster
UK/Inbenta in June led to a
bandwagon effect. Other
threat actors copied and
improved upon the TTP of
early Magecart threat
actor(s). The SamSam
ransomware attack came to
a standstill after two Iranian
hackers were indicted for
US$6 million extortion.
Cisco released an advisory
due to “active exploitation”
of a vulnerability in Cisco
Adaptive Security Appliance
Software (ASA) and Cisco
Firepower Threat Defense
Software that could allow
an unauthenticated, remote
attacker to cause a denial of
service. US-CERT released
Activity Alert AA18-284A,
“Publicly Available Tools
Seen in Cyber Incidents
Worldwide,” on five tools
threat actors had been using
for their “Living off the Land”
tactics. Marriott announced
a 2014-18 breach had
exposed the records of up
to 500 million customers
in its Starwood hotels
reservation system.
December
VTRAC collections in
December began with
“Operation Poison Needles.”
An unidentified actor
exploited the third Adobe
Flash zero-day vulnerability
to attack Polyclinic of the
Presidential Administration
of Russia. “Operation
Sharpshooter” was a global
campaign targeting nuclear,
defense, energy and
financial companies. Oil and
gas services contractor
Saipem suffered an attack
that employed a new variant
of Shamoon disk-wiping
malware. December’s
Patch Tuesday fixed
CVE-2018-8611, the latest
Windows zero-day being
exploited by the FruityArmor
APT threat actor. Partly in
reaction to the 77 percent
plunge in Bitcoin, cyber-
criminals did not abandon
cryptomining altogether,
instead, SamSam and
GandCrab ransomware
were being used to attack
corporations, government
agencies, universities and
other large organizations.
Criminals targeted larger
purses: organizations likely
to pay ransom in lieu of
days of lost business and
productivity recovering from
backups, re-imaging or other
BCP/DR measures. At the
end of 2018 the VTRAC was
running like a Formula 1 car
finishing a mid-race lap:
at full speed, staying ahead
of some, striving to catch
others and constantly
improving our engineering.
65
Appendix A:
Transnational hacker debriefs
Over the past fifteen years, the United States Secret Service has successfully
identified, located, and arrested numerous high-value cybercriminals. These
individuals were responsible for some of the most significant and widely publicized
data breaches of public and private industry networks. Over this period, the Secret
Service’s Cyber Division has cultivated mutually beneficial partnerships with law
enforcement agencies around the globe, which has extended the reach of the
Secret Service’s investigative efforts far beyond its traditional limits. This network
of collaborative partners has enabled the Secret Service to successfully extradite
criminal suspects located overseas and have them face prosecution in the United
States. The Secret Service continues to forge new international partnerships in
furtherance of its mission to pursue and apprehend cybercriminals regardless of
their geography.
As part of its mandate to combat financially motivated cybercrime, the Secret Service
combines its investigative efforts with educational outreach programs. These are
aimed at strengthening the ability of private and public sector entities to protect
themselves against a range of cybercrimes. The Secret Service conducts in-depth
analyses of the activities, tools, and methodologies used by the cybercriminals during
the commission of their crimes to better assess the evolving threats that cybercrimi-
nals pose to financial institutions and other potential targets. The Secret Service then
shares the results of these reviews with its network of public and private partners
through its outreach programs.
The Secret Service’s Cyber Division has learned that the most prescient information
about cybercrime trends often comes from the cybercriminals themselves. The
Secret Service conducts extensive debriefings of arrested cybercriminals and uses
their first-hand knowledge to understand more fully the spectrum of variables they
used to identify and select a particular target for intrusion and exploitation. The
Secret Service has recently completed such debriefings with a handful of highly
skilled cybercriminals who were responsible for some of the most significant network
intrusions in history, and has found that the ways in which these individuals select
their targets and perpetrate their crimes share certain common features.
Insights into their target selection
and tactics, techniques and procedures
– Michael D’Ambrosio, Deputy Assistant Director, United States Secret Service
66
Cybercriminals prey upon human error, IT security complacency, and technical
deficiencies present in computer networks all over the world. Individually, each of
these tactics, techniques and procedures (TTPs) discussed below are not always
initially successful and may seem easily mitigated; it is when multiple TTPs are
utilized in concert that cybercriminals are able to gain and maintain access to a
computer network, no matter their motives. Once they are inside a network their
process is almost always the same: establish continued access, escalate or obtain
administrator privileges, move slowly and quietly to map the entire network, look
for open ports, locate the “crown jewels,” and exfiltrate the data undetected for as
long as possible.
The selection of a target is a continual process. Cybercriminals do their research.
Almost always during these interviews, the hackers referred to gathering valuable
intelligence from the same cybersecurity blogs, online IT security publications, and
vulnerability reports that network administrators should be monitoring. They know
that once a vulnerability is revealed, they still have a limited amount of time to try to
exploit that vulnerability at a potential victim organization. Every time a vulnerability
is disclosed or a system update or patch is released, a hacker sees an opportunity.
They research the disclosure or update notes to learn if they can exploit the vulner-
ability and where, searching for their best opportunity to monetize the vulnerability.
Hackers also communicate vulnerability information and exploit techniques on
hacking forums. Once a target is selected, the hacker conducts thorough research
into the victim organization and their network(s), often using free and commercially
available Internet scanning tools that reveal extremely useful information about the
victim company’s network.
Webserver and/or webpage hacking has been a highly successful primary attack
vector, as there are various potential avenues for exploitation. These include the
main website of an institution or a less protected linked website, which in turn can
provide access to the main network. The added use of Structured Query Language
(SQL) database injections of malicious code has been a very effective attack vector
because these types of intrusion techniques can be deployed at any access point
of a website. There are additional webserver attack vectors such as overlooked or
forgotten IP addresses, possibly from development or beta-testing and external
webservers or data servers that share the same or common domain. Unmanaged
servers that still utilize Unicode can be exploited via encoding the URL with certain
characters to bypass application filters.
Other traditional and effective attack vectors should not be overlooked. These include
spear phishing for login credentials or malware delivery and “Man in the Middle”
attacks through poorly secured routers or web gateways. Botnets are a relatively
inexpensive tool that have been used to degrade or brute force attack networks in
connection with parallel tactics. A very skilled hacker admitted to the Secret Service
that he ended up paying a collusive employee (insider threat) when all of his other
hacking attempts to access a foreign bank’s network were unsuccessful.
67
Once inside a network, cybercriminals continue to do their research and
reconnaissance. Hackers often examine a webserver’s default error pages because
those pages expose a lot of the target network’s system information. Cybercriminals
take all of network information they can collect and utilize virtual machines (VMs)
to build a mock system to emulate the network of the victim company. This is done
both for testing their methods of exploitation and for better understanding the types
of network defenses present within the system.
The exploits used by cybercriminals inside a target network depend on the installed
network defenses. Undoubtedly, the hacker will try to install a web shell to ensure
access into the system. Another sustainment method is the use of cross-site scripting
(XSS) for session hijacking (cookie stealing) of a valid user through malicious
code injections into a user’s JavaScript, ActiveX, Flash, or other code bank. The use
of malware delivered to the valid user via spear phishing is a key component of
this process.
In addition, hackers utilize directory transversal attacks (directory climbing, back-
tracking, etc.) on web servers to attempt to reach otherwise restricted directories,
such as Secure Socket Layer (SSL) private keys and password files. Hackers can even
execute commands on the server by accessing such directories. After administrator
privileges are obtained, it is common for the prized data to be exfiltrated by tunneling
via a remote access protocol. Cybercriminals will also scan for open ports and
attempt to install software of their choosing on non-standard ports for a variety
of malicious uses. If the targeted network has the potential to provide valuable
data continuously, diligent hackers will continuously clean up their “tracks” within
the exploited network to obfuscate their presence indefinitely. Another prominent
hacker described having persistent access into a company’s networks for 10 years
using multiple “backdoors” (web shells) and continually cleaning up his “work” to go
undetected. In reality, many of the hackers we debriefed often stated that they could
see traces of other hackers in the targeted network which sometimes made it harder
to hide their hacking exploits.
These are just some of the tactics, techniques and procedures the Secret Service
has observed used by criminal groups to exploit victim networks. The threat is real
and the adversary is constantly evolving, driven by diverse and varying motivations.
Their success is more often dependent on how well network administrators can
adapt their defenses to potential vulnerabilities as they are revealed.
The Secret Service will continue to pursue, arrest, and prosecute cybercriminals no
matter where they are and we will continue to provide valuable attack methodology
analysis from our investigations to better improve the cybersecurity efforts of our
partners in law enforcement, academia, and the public and private sectors alike.
68
Appendix B:
Methodology
One of the things readers value most about this report is the level of rigor and
integrity we employ when collecting, analyzing, and presenting data. Knowing our
readership cares about such things and consumes this information with a keen eye
helps keep us honest. Detailing our methods is an important part of that honesty.
Our overall methodology remains intact and largely unchanged from previous years.
All incidents included in this report were individually reviewed and converted
(if necessary) into the VERIS framework to create a common, anonymous aggregate
data set. If you are unfamiliar with the VERIS framework, it is short for Vocabulary
for Event Recording and Incident Sharing, it is free to use, and links to VERIS
resources are at the beginning of this report.
The collection method and conversion techniques differed between contributors. In
general, three basic methods (expounded below) were used to accomplish this:
1.	 Direct recording of paid external forensic investigations and related intelligence
operations conducted by Verizon using the VERIS Webapp.
2.	 Direct recording by partners using VERIS.
3.	 Converting partners existing schema into VERIS.
All contributors received instruction to omit any information that might identify
organizations or individuals involved.
Reviewed spreadsheets and VERIS Webapp JavaScript Object Notation (JSON) are
ingested by an automated workflow that converts the incidents and breaches within
into the VERIS JSON format as necessary, adds missing enumerations, and then
validates the record against business logic and the VERIS schema. The automated
workflow subsets the data and analyzes the results. Based on the results of this
exploratory analysis, the validation logs from the workflow, and discussions with the
partners providing the data, the data is cleaned and re-analyzed. This process runs
nightly for roughly three months as data is collected and analyzed.
Incident eligibility
For a potential entry to be eligible for the incident/breach corpus, a couple of
requirements must be met. The entry must be a confirmed security incident, defined
as a loss of confidentiality, integrity, or availability. In addition to meeting the baseline
definition of “security incident” the entry is assessed for quality. We create a subset
of incidents (more on subsets later) that pass our quality filter. The details of what is
a “quality” incident are:
69
•	The incident must have at least seven enumerations (e.g., threat actor variety,
threat action category, variety of integrity loss, et al.) across 34 fields OR
be a DDoS attack. Exceptions are given to confirmed data breaches with less
than seven enumerations.
•	The incident must have at least one known VERIS threat action category
(hacking, malware, etc.)
In addition to having the level of detail necessary to pass the quality filter, the incident
must be within the timeframe of analysis, (November 1, 2017 to October 31, 2018
for this report). The 2018 caseload is the primary analytical focus of the report, but
the entire range of data is referenced throughout, notably in trending graphs. We
also exclude incidents and breaches affecting individuals that cannot be tied to an
organizational attribute loss. If your friend’s personal laptop was hit with CryptoLocker
it would not be included in this report.
Lastly, for something to be eligible for inclusion into the DBIR, we have to know about
it, which brings us to sample bias.
Acknowledgement of sample bias
We would like to reiterate that we make no claim that the findings of this report are
representative of all data breaches in all organizations at all times. Even though
the combined records from all our contributors more closely reflect reality than any
of them in isolation, it is still a sample. And although we believe many of the findings
presented in this report to be appropriate for generalization (and our confidence
in this grows as we gather more data and compare it to that of others), bias
undoubtedly exists. Unfortunately, we cannot measure exactly how much bias exists
(i.e., in order to give a precise margin of error). We have no way of knowing what
proportion of all data breaches are represented because we have no way of knowing
the total number of data breaches across all organizations in 2018. Many breaches
go unreported (though our sample does contain many of those). Many more are as
yet unknown by the victim (and thereby unknown to us).
While we believe many of the findings presented in this report to be appropriate,
generalization, bias, and methodological flaws undoubtedly exist. However, with 73
contributing organizations this year, we’re aggregating across the different collection
methods, priorities, and goals of our partners. We hope this aggregation will help
minimize the influence of any individual shortcomings in each of the samples, and the
whole of this research will be greater than the sum of its parts.
Statistical analysis
We strive for statistical correctness in the DBIR. In this year’s data sample, the confidence
interval is at least +/- 2% for breaches and +/- 0.5%18
for incidents. Smaller samples of
the data (such as breaches within the Espionage pattern) will be even wider as the size
is smaller. We have tried to treat every statement within the DBIR as a hypothesis19
based
on exploratory analysis and ensure that each statement is accurate at a given confidence
level (normally 95%). We’ve tried to express this confidence in the conditional probability
bar charts explained in the “tidbits” that precede the Table of Contents.
18
Bayes method, 95% confidence level.
19
If you wonder why we treat them as hypotheses rather than findings, to confirm or deny our hypothesis would requires a second, unique data set we had not inspected ahead of time.
70
Our data is non-exclusively multinomial meaning a single feature, such as “Action,”
can have multiple values (i.e., “social,” “malware,” and “hacking”). This means that
percentages do not necessarily add up to 100 percent. For example, if there are 5
botnet breaches, the sample size is 5. However, since each botnet used phishing,
installed keyloggers, and used stolen credentials, there would be 5 social actions, 5
hacking actions, and 5 malware actions, adding up to 300 percent. This is normal,
expected, and handled correctly in our analysis and tooling.
Another important point is that, when looking at the findings, “unknown” is equivalent
to “unmeasured.” Which is to say that if a record (or collection of records) contain ele-
ments that have been marked as “unknown” (whether it is something as basic as the
number of records involved in the incident, or as complex as what specific capabilities
a piece of malware contained) it means that we cannot make statements about that
particular element as it stands in the record—we cannot measure where we have too
little information. Because they are “unmeasured,” they are not counted in sample
sizes. The enumeration “Other” is, however, counted as it means the value was known
but not part of VERIS. Finally, “Not Applicable” (normally “NA”) may be counted or not
counted depending on the hypothesis.
Data Subsets
We already mentioned the subset of incidents that passed our quality requirements,
but as part of our analysis there are other instances where we define subsets of
data. These subsets consist of legitimate incidents that would eclipse smaller trends
if left in. These are removed and analyzed separately (as called out in the relevant
sections). This year we have two subsets of legitimate incidents that are not analyzed
as part of the overall corpus:
1.	We separately analyzed a subset of web servers that were identified as secondary
targets (such as taking over a website to spread malware).
2.	 We separately analyze botnet-related incidents.
Both subsets were separately analyzed last year as well.
Finally, we create some subsets to help further our analysis. In particular, a single
subset is used for all analysis within the DBIR unless otherwise stated. It includes only
quality incidents as described above and the aforementioned two subsets.
Non-incident data
Since 2015, the DBIR includes data that requires the analysis that did not fit into our
usual categories of “incident” or “breach.” Examples of non-incident data include
malware, patching, phishing, DDoS, and other types of data. The sample sizes for
non-incident data tend to be much larger than the incident data, but from fewer
sources. We make every effort to normalize the data, (for example reporting on the
median organization rather than the average of all data). We also attempt to combine
multiple contibutors with similar data to conduct the analysis wherever possible. Once
analysis is complete, we try to discuss our findings with the relevant contributor or
contributors so as to validate it against their knowledge of the data.
71
Last year in the “Feeling vulnerable?” appendix, we discussed the services or
weaknesses attackers look for in spray and pray internet scans, and how those aren’t
necessarily the same things they look for in targeted attacks. In this section, we again
examine what services are open to the internet and the adversary activity against
them. At the risk of stating the obvious, what the attacker looks for tells you a great
deal about what is of value to them.
Any port in a storm
Ports that offer at least some value to, and at the same time require the least amount
of investment from the attacker garner a lot of attention. An economist might call
the amount invested by the actor per attack the marginal cost. The very best attacks
from the criminal’s point of view would cost almost nothing per target. We will refer to
these as zero-marginal-cost attacks.
21
2223
25
53
80
123
137
161
389
443
445
500
1900
3389
5060
8000
8080
11211
1
10
20
30
40
50
Port rank in DDoS attacks
Portrankinhoneypotevents
Figure 65. Comparison of ports in DDoS and honeypot attacks
50 110203040
Appendix C:
Watching the watchers
72
Figure 65 illustrates the ports that are in the top 50 for both honeypot activity
and DDoS attacks (with “1” in the upper right being the most common and the rest
decreasing from that point). We can consider how often attackers look for a given port
as an indicator for how valuable they are to the attacker. Ports below the red line, such
as cLDAP (389), DNS (53), and NTP (123) are more valuable due to their DDoS ampli-
fication potential. The ports above the red line are more valuable for their non-DDoS
malevolence including SSH (22), telnet (23), HTTP (8080), NetBIOS (445), and others.
Portémon Go
Probably the most effective way to judge perceived value for the attacker for a given
port in zero-marginal-cost attacks is to examine their ranking in honeypot scans vs
their general population ranking on the Internet. There are a myriad of organizations
that scan the internet regularly, and there are a few of those who are gracious
enough to contribute to the DBIR. As a result, we can share this data in Figure 66.
Various
(8888)
cLDAP
(389)
Building
Managment
(47808)
memcached
(11211)
MS SQL
Server (1433)
Netis Routers
(53413)
Various trojans
(6969)
NetBIOS
(445)
Dell Open
Management (1311)
telnet
(23)
0x 5x 10x 15x
Ratio of honeypot events rank
to internet scans rank
Port
Figure 66. Ports scanned for more
often than they exist
Figure 66. Ports scanned for more often than they exist
73
Figure 66 lists the top 10 ports by ratio of honeypot activity to internet prevelance.20
Some of these, for example, Telnet, NetBIOS, and SQL Server – legacy services with
known weaknesses that are old enough to vote – may not be as common as dirt, but
they still exist and when an attacker finds them you can almost hear the intro to Pink
Floyd’s “Money” floating in the ether. If your organization has any of these services
exposed to the internet, it’s probably a good idea to go and take care of that now.
We’ll wait here. Take your time. This report changes once a year, but those ports are
being hammered daily.
Dime a dozen
The above section begs the question, “If those ports are what attackers frequently
search for but rarely find, which open ports are plentiful but rarely sought?” We are
glad you asked. For the most part they are unassigned or ephemeral ports. Of more
interest are the ports that appear in vulnerability scans, but do not show up in honey-
pots. Figure 67 gives us some insight into that area. The main takeaway is that there
are a lot of ports far down on the list from a honeypot perspective (the big cluster in
the lower left of the figure) that get reported often in vulnerability scans. Those are
the vulnerabilities that may be useful for attackers but either only for niche attacks or
internal pivoting, or are of absolutely no interest whatsoever to the attacker.
20
For example, if a port was the top ranked port in honeypot scans and the 15th most common on the internet, its ratio would be 15x.
74
Take action
There may only be seven seas, but there are 65,535 ports. While not all are found in
the figures above, a great many are. So now what? We suggest you take a look to
ascertain if you are vulnerable to any zero-marginal-cost attacks (easily identified by
their honeypot to internet scan ratio). If so, you are operating below a critical security
threshold and you need to take action to get above it. Are you running a honeypot
yourself? If not, why is that port open? Finally, take a cue from the Unbroken Chains
section and be smart about what else you mitigate. Understand the paths attackers
are most likely to take in order to exploit those services.
443
3389
445
1433
80
22
0
123
2381
8443
161
500
636
5989
8080
8081
23
25
3269
8089
8880
1311
21
9443
5061
81
53
6701
8082
389
143
3071
587
10000
9043
623
993
5556
995
5000
7002
110
8444
9090
8445
5480
8000
1521
5353
7004
10
100
1,000
10,000
10100
Vulnerability scans port rank (log scale)
Honeypoteventsportrank(logscale)
Figure 67. Comparison of ports in vulnerability scans and honeypot events
75
Appendix D:
Contributing organizations
CYBER+INFRASTRUCTURE
76
Security Awareness Training
PMS: COOL GREY 11 C
CMYK: 0, 0, 0, 86
PMS: 200 C
CMYK: 0, 100, 100, 25
77
A	
Akamai Technologies
Apura Cyber Intelligence
AttackIQ
Avant Research Group, LLC
B	
BeyondTrust
BinaryEdge
BitSight
Bit-x-bit
C	
Center for Internet Security
CERT Insider Threat Center
CERT European Union
Checkpoint Software
	 Technologies Ltd
Chubb
Cisco Security Services
Computer Incident Response
	 Center Luxembourg (CIRCL)
CrowdStrike
Cybercrime Central Unit of
	 the Guardia Civil (Spain)
CyberSecurity Malaysia,
	 an agency under the
	 Ministry of Science,
	 Technology and Innovation
	(MOSTI)
Cylance
D	
Dell
DFDR Forensics
Digital Edge
Digital Shadows
Dragos, Inc
E	
	
Edgescan
Emergence Insurance
F	
Federal Bureau of
	 Investigations Internet
	 Crime Complaint Center
	 (FBI IC3)
Fortinet
G	
Gillware Digital Forensics
Government of Telangana,
	 ITEC Dept., Secretariat
GRA Quantum
GreyNoise Intelligence
I	 	
	
Interset
Irish Reporting and
	 Information Security
	 Services (IRISS-CERT)
J	
JPCERT/CC
K	
Kaspersky Lab
KnowBe4
L	
Lares Consulting
LIFARS
M	
Malicious Streams
McAfee
Mishcon de Reya
Moss Adams (formerly
	 ASTECH consulting)
MWR InfoSecurity
N	
National Cyber-Forensics
	 and Training Alliance
	(NCFTA)
NetDiligence
NETSCOUT
P	
Paladion
Palo Alto Networks
Proofpoint
Q	
Qualys
R	
Rapid7
Recorded Future
S	
S21sec
Shodan
Social-Engineer, Inc.
SwissCom
T	
	
Tripwire
U	
	
US Secret Service
US Computer Emergency
	 Readiness Team (US-CERT)
V	
VERIS Community Database
Verizon Cyber Risk Programs
Verizon Digital Media Services
Verizon DOS Defense
Verizon Managed Security
	Services
Verizon Network Operations
	 and Engineering
Verizon Professional Services
Verizon Threat Research
	 Advisory Center
Vestige Ltd
W	
Wandera
West Monroe Partners
Winston  Strawn LLP
Z	
Zscaler
© 2019 Verizon. All rights reserved. The Verizon name and logo and all other names, logos and slogans identifying Verizon’s products and services are trademarks and
service marks or registered trademarks and service marks of Verizon Trademark Services LLC or its affiliates in the United States and/or other countries. All other trademarks
and service marks are the property of their respective owners. 05/19
2019 Data Breach
Investigations Report

2019 Data Breach Investigations Report (DBIR)

  • 1.
    2019 Data Breach Investigations Report businessready 4e 6f 20 63 6f 76 65 72 20 63 68 61 6c 6c 65 6e 67 65 20 74 68 69 73 20 79 65 61 72
  • 2.
    2 Server (All breaches,n=1,881) Server (Just large organization breaches, n=335) Breaches Figure 1. Top asset variety in breaches 0% 20% 40% 60% 80% 100% Before we formally introduce you to the 2019 Data Breach Investigations Report (DBIR), let us get some clarifications out of the way first to reduce potential ambiguity around terms, labels, and figures that you will find throughout this study. VERIS resources The terms “threat actions,” “threat actors,” “varieties,” and “vectors” will be referenced a lot. These are part of the Vocabulary for Event Recording and Incident Sharing (VERIS), a framework designed to allow for a consistent, unequivocal collection of security incident details. Here are some select definitions followed by links with more information on the framework and on the enumerations. Threat actor: Who is behind the event? This could be the external “bad guy” that launches a phishing campaign, or an employee who leaves sensitive documents in their seat back pocket. Threat action: What tactics (actions) were used to affect an asset? VERIS uses seven primary categories of threat actions: Malware, Hacking, Social, Misuse, Physical, Error, and Environmental. Examples at a high level are hacking a server, installing malware, and influencing human behavior. Variety: More specific enumerations of higher level categories - e.g., classifying the external “bad guy” as an organized criminal group, or recording a hacking action as SQL injection or brute force. Learn more here: • github.com/vz-risk/dbir/tree/gh-pages/2019 – DBIR figures and figure data. • veriscommunity.net features information on the framework with examples and enumeration listings. • github.com/vz-risk/veris features the full VERIS schema. • github.com/vz-risk/vcdb provides access to our database on publicly disclosed breaches, the VERIS Community Database. • http://veriscommunity.net/veris_webapp_min.html allows you to record your own incidents and breaches. Don’t fret, it saves any data locally and you only share what you want. Incident vs. breaches We talk a lot about incidents and breaches and we use the following definitions: Incident: A security event that compromises the integrity, confidentiality or availability of an information asset. Breach: An incident that results in the confirmed disclosure—not just potential exposure—of data to an unauthorized party. Industry labels We align with the North American Industry Classification System (NAICS) standard to categorize the victim organizations in our corpus. The standard uses 2 to 6 digit codes to classify businesses and organizations. Our analysis is typically done at the 2-digit level and we will specify NAICS codes along with an industry label. For example, a chart with a label of Financial (52) is not indicative of 52 as a value. 52 is the NAICS code for the Finance and Insurance sector. The overall label of “Financial” is used for brevity within the figures. Detailed information on the codes and classification system is available here: https://www.census.gov/cgi-bin/sssd/naics/naicsrch?chart=2017 This year we’re putting it in the bar charts. The black dot is the value, but the slope gives you an idea of where the real value could be between. In this sample figure we’ve added a few red bars to highlight it, but in 19 bars out of 20 (95%),1 the real number will be between the two red lines on the bar chart. Notice that as the sample size (n) goes down, the bars get farther apart. If the lower bound of the range on the top bar overlaps with the higher bound of the bar beneath it, they are treated as statistically similar and thus statements that x is more than y will not be proclaimed. Questions? Comments? Brilliant ideas? We want to hear them. Drop us a line at dbir@verizon.com, find us on LinkedIn, tweet @VZEnterprise with the #dbir. Got a data question? Tweet @VZDBIR! A couple of tidbits Figure 1. Top asset variety in breaches 1 https://en.wikipedia.org/wiki/Confidence_interval New chart, who dis? You may notice that the bar chart shown may not be as, well, bar- ish as what you may be used to. Last year we talked a bit in the Methodology section about confidence. When we say a number is X, it’s really X +/- a small amount.
  • 3.
    3 Table of contents Introduction 4 Summaryof findings 5 Results and analysis 6 Unbroken chains 20 Incident classification patterns and subsets 24 Data breaches: extended version 27 Victim demographics and industry analysis 30 Accommodation and Food Services 35 Educational Services 38 Financial and Insurance 41 Healthcare 44 Information 46 Manufacturing 49 Professional, Technical and Scientific Services 52 Public Administration 55 Retail 58 Wrap up 61 Year in review 62 Appendix A: Transnational hacker debriefs 65 Appendix B: Methodology 68 Appendix C: Watching the watchers 71 Appendix D: Contributing organizations 75
  • 4.
    4 Introduction 2 If you didn’texpect a Stan Lee reference in this report, then you are certainly a first-time reader. Welcome to the party pal! Welcome! Pull up a chair with the 2019 Verizon Data Breach Investigations Report (DBIR). The statements you will read in the pages that follow are data-driven, either by the incident corpus that is the foundation of this publication, or by non-incident data sets contributed by several security vendors. This report is built upon analysis of 41,686 security incidents, of which 2,013 were confirmed data breaches. We will take a look at how results are changing (or not) over the years as well as digging into the overall threat landscape and the actors, actions, and assets that are present in breaches. Windows into the most common pairs of threat actions and affected assets also are provided. This affords the reader with yet another means to analyze breaches and to find commonalities above and beyond the incident classification patterns that you may already be acquainted with. Fear not, however. The nine incident classification patterns are still around, and we continue to focus on how they correlate to industry. In addition to the nine primary patterns, we have created a subset of data to pull out financially-motivated social engineering (FMSE) attacks that do not have a goal of malware installation. Instead, they are more focused on credential theft and duping people into transferring money into adversary- controlled accounts. In addition to comparing industry threat profiles to each other, individual industry sections are once again front and center. Joining forces with the ever-growing incident/breach corpus, several areas of research using non-incident data sets such as malware blocks, results of phishing training, and vulnerability scanning are also utilized. Leveraging, and sometimes combining, disparate data sources (like honeypots and internet scan research) allows for additional data-driven context. It is our charge to present information on the common tactics used by attackers against organizations in your industry. The purpose of this study is not to rub salt in the wounds of information security, but to contribute to the “light” that raises awareness and provides the ability to learn from the past. Use it as another arrow in your quiver to win hearts, minds, and security budget. We often hear that this is “required reading” and strive to deliver actionable information in a manner that does not cause drowsiness, fatigue, or any other adverse side effects. We continue to be encouraged and energized by the coordinated data sharing by our 73 data sources, 66 of which are organizations external to Verizon. This community of data contributors represents an international group of public and private entities willing to support this annual publication. We again thank them for their support, time, and, of course, DATA. We all have wounds, none of us knows everything, let’s learn from each other. Excelsior!2 “The wound is the place where the light enters you.” — Rumi
  • 5.
    5 Summary of findings 43% ofbreaches involved small business victims 10% were breaches of the Financial industry 15% were breaches involving Healthcare organizations 16% were breaches of Public sector entities Breaches Figure 2. Who are the victims? 0% 20% 40% 60% 80% 100% Physical actions were present in 4% of breaches 15% were Misuse by authorized users Errors were causal events in 21% of breaches 28% involved Malware 33% included Social attacks 52% of breaches featured Hacking Breaches Figure 3. What tactics are utilized? 0% 20% 40% 60% 80% 100% Actors identified as nation-state or state- affiliated were involved in 23% of breaches Organized criminal groups were behind 39% of breaches Breaches Figure 4. Who's behind the breaches? 5% featured Multiple parties 2% involved Partners 34% involved Internal actors 69% perpetrated by outsiders 0% 20% 40% 60% 80% 100% 56% of breaches took months or longer to discover 29% of breaches involved use of stolen credentials 32% of breaches involved phishing 25% of breaches were motivated by the gain of strategic advantage (espionage) 71% of breaches were financially motivated Breaches Figure 5. What are other commonalities? 0% 20% 40% 60% 80% 100%
  • 6.
    6 The results foundin this and subsequent sections within the report are based on a data set collected from a variety of sources such as publicly-disclosed security incidents, cases provided by the Verizon Threat Research Advisory Center (VTRAC) investigators, and by our external collaborators. The year-to-year data set(s) will have new sources of incident and breach data as we strive to locate and engage with organizations that are willing to share information to improve the diversity and coverage of real-world events. This is a convenience sample, and changes in contributors, both additions and those who were not able to participate this year, will influence the data set. Moreover, potential changes in their areas of focus can stir the pot o’ breaches when we trend over time. All of this means we are not always researching and analyzing the same fish in the same barrel. Still other potential factors that may affect these results are changes in how we subset data and large-scale events that can sometimes influence metrics for a given year. These are all taken into consideration, and acknowledged where necessary, within the text to provide appropriate context to the reader. With those cards on the table, a year-to-year view of the actors (and their motives),3 followed by changes in threat actions and affected assets over time is once again provided. A deeper dive into the overall results for this year’s data set with an old-school focus on threat action categories follows. Within the threat action results, relevant non-incident data is included to add more awareness regarding the tactics that are in the adversaries’ arsenal. Defining the threats Threat actor is the terminology used to describe who was pulling the strings of the breach (or if an error, tripping on them). Actors are broken out into three high-level categories of External, Internal, and Partner. External actors have long been the primary culprits behind confirmed data breaches and this year the trend continues. There are some subsets of data that are removed from the general corpus, notably over 50,000 botnet related breaches. These would have been attributed to external groups and, had they been included, would have further increased the gap between the External and Internal threat. Financial Other Espionage 0% 25% 50% 75% Breaches Figure 7. Threat actor motives in breaches over time 2011 20172013 2015 External Internal Partner 0% 20% 40% 60% 80% Breaches Figure 6. Threat actors in breaches over time 2011 20172013 2015 Results and analysis 3 And we show the whole deck in Appendix B: Methodology.
  • 7.
    7 State-affiliated Activist System Admin Cashier Organized crime 0% 20% 40% 60% 80% 20112013 2015 2017 Breaches Figure 8. Select threat actors in breaches over time Financial gain is still the most common motive behind data breaches where a motive is known or applicable (errors are not categorized with any motive). This continued positioning of personal or financial gain at the top is not unexpected. In addition to the botnet breaches that were filtered out, there are other scalable breach types that allow for opportunistic criminals to attack and compromise numerous victims.4 Breaches with a strategic advantage as the end goal are well-represented, with one-quarter of the breaches associated with espionage. The ebb and flow of the financial and espionage motives are indicative of changes in the data contributions and the multi-victim sprees. This year there was a continued reduction in card-present breaches involving point of sale environments and card skimming operations. Similar percentage changes in organized criminal groups and state-affiliated operations are shown in Figure 8 above. Another notable finding (since we are already walking down memory lane) is the bump in Activists, who were somewhat of a one-hit wonder in the 2012 DBIR with regard to confirmed data breaches. We also don’t see much of Cashier (which also encompasses food servers and bank tellers) anymore. System administrators are creeping up and while the rogue admin planting logic bombs and other mayhem makes for a good story, the presence of insiders is most often in the form of errors. These are either by misconfiguring servers to allow for unwanted access or publishing data to a server that should not have been accessible by all site viewers. Please, close those buckets! 4 In Appendix C: “Watching the Watchers”, we refer to these as zero-marginal cost attacks.
  • 8.
    8 20132018 0 10 16 17 17 30 56% 0 4 14 21 35 29 53% 0 -6 -2 +5 +18 -1 -3 DIFF Environmental Physical Misuse Error Social Malware Hacking Breaches Figure 9. Threatactions in data breaches over time n=2,501 (2013), n=1638 (2018) 20132018 0 7 17 19 28 65% 1 1 9 39 30 63% +1 -5 -8 +20 +2 -2 DIFF Network Kiosk/Term Media Person User Dev Server Breaches Figure 10. Asset categories in data breaches over time n=2,294 (2013), n=1,513 (2018) Figures 9 and 10 show changes in threat actions and affected assets from 2013 to 2018.5,6 No, we don’t have some odd affinity for seven-year time frames (as far as you know). Prior years were heavily influenced by payment card breaches featuring automated attacks on POS devices with default credentials, so 2013 was a better representative starting point. The rise in social engineering is evident in both charts, with the action category Social and the related human asset both increasing. Threat action varieties When we delve a bit deeper and examine threat actions at the variety level, the proverbial question of “What are the bad guys doing?” starts to become clearer. Figure 11 shows Denial of Service attacks are again at the top of action varieties associated with security incidents, but it is still very rare for DoS to feature in a confirmed data breach. Similarly, Loss, which is short for Lost or misplaced assets, incidents are not labeled as a data breach if the asset lost is a laptop or phone, as there is no feasible way to determine if data was accessed. We allow ourselves to infer data disclosure if the asset involved was printed documents. Switching over to breaches in Figure 12, phishing and the hacking action variety of use of stolen credentials are prominent fixtures. The next group of three involves the installation and subsequent use of back- door or Command and Control (C2) malware. These tactics have historically been common facets of data breaches and based on our data, there is still much success to be had there. 5 Credit where it’s due. These dumbbell charts are based on the design at http://www.pewglobal.org/2016/02/22/social-networking-very-popular-among-adult-internet-users-in-emerging-and-developing-nations/ and code at https://rud.is/b/2016/04/17/ggplot2-exercising-with-ggalt-dumbbells/ 6 Note these are incident years, not DBIR years. All of the 2018 will be represented in this year’s data, but a 2012 breach not discovered until 2013 would be part of the 2014 DBIR. Figure 9. Threat actions in data breaches over time n=2,501 (2013), n=1,638 (2018) Figure 10. Asset categories in data breaches over time n=2,294 (2013), n=1,513 (2018)
  • 9.
    9 Adware Adminware Data mishandling Pretexting Spyware/Keylogger Use ofbackdoor or C2 Backdoor Privilege abuse Ransomware Use of stolen creds Phishing Misdelivery C2 Loss DoS Incidents Figure 11. Top threat action varieties in incidents, (n=17,310) 0% 20% 40% 60% 80% 100% Misconfiguration Exploit vuln Pretexting Publishing error Adminware Data mishandling Capture app data Misdelivery Spyware/Keylogger Privilege abuse Use of backdoor or C2 C2 Backdoor Use of stolen creds Phishing Breaches Figure 12. Top threat action varieties in breaches (n=1,774) 0% 20% 40% 60% 80% 100%
  • 10.
    10 Physical access 3rd partydesktop Command shell Partner VPN Other Desktop sharing software Desktop sharing Backdoor or C2 Web application Breaches Figure 14. Top hacking action vectors in breaches (n=862) 0% 20% 40% 60% 80% 100% Other SQLi RFI Abuse of functionality Buffer overflow Brute force Exploit vuln Use of backdoor or C2 Use of stolen creds Breaches Figure 13. Top hacking action varieties in breaches (n=755) 0% 20% 40% 60% 80% 100% Hacking A quick glance at the figures below uncovers two prominent hacking variety and vector combinations. The more obvious scenario is using a backdoor or C2 via the backdoor or C2 channel, and the less obvious, but more interesting, use of stolen credentials. Utilizing valid credentials to pop web applications is not exactly avant garde. The reason it becomes noteworthy is that 60% of the time, the compromised web application vector was the front-end to cloud based email servers. Even though stolen credentials are not directly associated with patch currency, it is still a necessary and noble undertaking. At most, six percent of breaches in our data set this year involved exploiting vulnerabilities. Remember that time your network was scanned for vulnerabilities and there were zero findings? You slept soundly that night only to be jolted from your drowsy utopia by your alarm radio blaring “I Got You Babe.” Vulnerability scanning always yields findings (even benign informational ones) and it is up to the administrators to determine which are accepted, and which are addressed.
  • 11.
    11 Capture stored data Downloader Spam Captureapp data Adware Adminware Spyware/keylogger Backdoor Ransomware C2 Incidents Figure 16. Top malware action varieties in incidents (n=2,103) 0% 20% 40% 60% 80% 100% AUC: 32.4% COT: 43.8% 0% 25% 50% 75% 100% 7 30 60 90 Days taken to patch Findingsfixed Figure 15. Time to patch Figure 15 shows the patching behavior of hundreds of organizations from multiple vulnerability scanning contributors. Based on scan history, we determine that organizations will typically have a big push to remediate findings after they are initially discovered and after that there is a steady increase in percentage of findings fixed until it levels out. Not unlike the amount of romance and mutual regard that occurs while dating vs. once married. You get the idea. The area under the curve (AUC) is how protected you are while you are actively patching. Quick remediation will result in a higher AUC. The percentage completed-on-time (COT) is the amount of vulnerabilities patched at a pre-determined cut-off time; we used 90 days. Your COT metric could be different, and it would make sense to have different COTs for Internet-facing devices or browser vulnerabilities, and certainly for vulnerabilities with active exploitation in the wild. It is important to acknowledge that there will always be findings. The key is to prioritize the important ones and have a plan for the remaining actionable vulnerabilities; and to be able to defend acceptance of unaddressed findings. Malware Malware can be leveraged in numerous ways to establish or advance attacks. Command and Control (C2) and backdoors are found in both security incidents and breaches. Ransomware is still a major issue for organizations and is not forced to rely on data theft in order to be lucrative.
  • 12.
    12 Ransomware Ram scraper Password dumper Capturestored data Downloader Adminware Capture app data Spyware/keylogger C2 Backdoor Breaches Figure 17. Top malware action varieties in breaches (n=500) 0% 20% 40% 60% 80% 100% Web download Other Network propagation Email link Remote injection Download by malware Web drive-by Email unknown Direct install Email attachment Incidents Figure 18. Top malware action vectors in incidents (n=795) 0% 20% 40% 60% 80% 100% We were at a hipster coffee shop and it was packed with people talking about cryptomining malware as the next big thing. The numbers in this year’s data set do not support the hype, however, as this malware functionality does not even appear in the top 10 varieties. In previous versions of VERIS, cryptominers were lumped in with click-fraud, but they received their own stand-alone enumeration this year. Combining both the new and legacy enumerations for this year, the total was 39—more than zero, but still far fewer than the almost 500 ransomware cases this year.
  • 13.
    13 Figure 18 displaysthat when the method of malware installation was known, email was the most common point of entry. This finding is supported in Figure 19, which presents data received from millions of malware detonations, and illustrates that the median company received over 90% of their detected malware by email. Direct install is indicative of a device that is already compromised and the malware is installed after access is established. It is possible for malware to be introduced via email, and once the foothold is gained, additional malware is downloaded, encoded to bypass detection and installed directly. Like most enumerations, these are not mutually exclusive. Social While hacking and malicious code may be the words that resonate most with people when the term “data breach” is used, there are other threat action catego- ries that have been around much longer and are still ubiquitous. Social engineering, along with Misuse, Error, and Physical, do not rely on the existence of “cyberstuff” and are definitely worth discussing. We will talk about these “OGs” now, beginning with the manipulation of human behavior. There is some cause for hope in regard to phishing, as click rates from the combined results of multiple security awareness vendors are going down. As you can see in Figure 21, click rates are at 3%. 94% 0% 45% 26% 22% Delivery Method File Type email web other Office doc Windows app other 0% 25% 50% 75% 100% Figure 19. Malware types and delivery methods 23% Scam Other Influence Forgery Extortion Bribery Pretexting Phishing Breaches Figure 20. Top social action varieties in breaches (n=670) 0% 20% 40% 60% 80% 100%
  • 14.
    14 2.99% 0% 5% 10% 15% 20% 25% 2012 2014 20162018 Clicked Figure 21. Click rates over time in sanctioned phishing exercises With regard to the event chain for these attacks, if the device on which the communication was read and/or interacted with does not have malicious code installed as part of the phish, it may not be recorded as an affected asset. For example, if a user is tricked into visiting a phony site and he/she then enters credentials, the human asset is recorded as well as the asset that the credentials are used to access. To that end, those moments when the users thoughts are adrift provide an excellent opportunity for criminals to phish via SMS or emails to mobile devices. This is supported by the 18% of clicks from the sanctioned phishing data that were attributed to mobile. Below is a window into mobile devices and how the way humans use them can contribute to successful phishing attacks provided by researcher Arun Vishwanath, Chief Technologist, Avant Research Group, LLC. 7 Vishwanath, A. (2016). Mobile device affordance: Explicating how smartphones influence the outcome of phishing attacks. Computers in Human Behavior, 63, 198-207. 8 Vishwanath, A. (2017). Getting phished on social media. Decision Support Systems, 103, 70-81. 9 Vishwanath, A., Harrison, B., Ng, Y. J. (2018). Suspicion, cognition, and automaticity model of phishing susceptibility. Communication Research, 45(8), 1146-1166. Research points to users being significantly more susceptible to social attacks they receive on mobile devices. This is the case for email-based spear phishing, spoofing attacks that attempt to mimic legitimate webpages, as well as attacks via social media.7, 8, 9 The reasons for this stem from the design of mobile and how users interact with these devices. In hardware terms, mobile devices have relatively limited screen sizes that restrict what can be accessed and viewed clearly. Most smartphones also limit the ability to view multiple pages side-by-side, and navi- gating pages and apps necessitates toggling between them—all of which make it tedious for users to check the veracity of emails and requests while on mobile. Mobile OS and apps also restrict the availability of information often necessary for verifying whether an email or webpage is fraudulent. For instance, many mobile browsers limit users’ ability to assess the quality of a website’s SSL certificate. Likewise, many mobile email apps also limit what aspects of the email header are visible and whether the email-source information is even accessible. Mobile software also enhances the prominence of GUI elements that foster action—accept, reply, send, like, and such­—which make it easier for users to respond to a request. Thus, on the one hand, the hardware and software on mobile devices restrict the quality of information that is available, while on the other they make it easier for users to make snap decisions. The final nail is driven in by how people use mobile devices. Users often interact with their mobile devices while walking, talking, driving, and doing all manner of other activities that interfere with their ability to pay careful attention to incoming information. While already cognitively constrained, on screen notifications that allow users to respond to incoming requests, often without even having to navigate back to the application from which the request emanates, further enhance the likelihood of reactively responding to requests. Thus, the confluence of design and how users interact with mobile devices make it easier for users to make snap, often uninformed decisions—which significantly increases their susceptibility to social attacks on mobile devices. Figure 21. Click rates over time in sanctioned phishing exercises
  • 15.
    15 Misuse Misuse is themalicious or inappropriate use of existing privileges. Often it cannot be further defined beyond that point in this document due to a lack of granularity provided; this fact is reflected in the more generic label of Privilege abuse as the top variety in Figure 22. The motives are predominantly financial in nature, but employees taking sensitive data on the way out to provide themselves with an illegal advantage in their next endeavor are also common. Illicit content Net misuse Unapproved software Unapproved hardware Possession abuse Email misuse Knowledge abuse Unapproved workaround Data mishandling Privilege abuse Breaches Figure 22. Top misuse varieties in breaches (n=292) 0% 20% 40% 60% 80% 100% Secondary Fear Ideology Convenience Other Grudge Fun Espionage Financial Breaches Figure 23. Actor motives in misuse breaches (n=245) 0% 20% 40% 60% 80% 100%
  • 16.
    16 Person - Finance UserDev - POS terminal Server - POS controller User Dev - Laptop Person - End-user Media - Documents Server - Database Server - Web application User Dev - Desktop Server - Mail Breaches Figure 25. Top asset varieties in breaches (n=1,699) 0% 20% 40% 60% 80% 100% 2010 2018 4 2 14 0 31 0 16 32% 0 4 5 5 7 21 21 37% -4 +2 -9 +5 -24 +21 +5 +5 DIFF Gaffe Omission Disposal error Programming error Loss Misconfiguration Publishing error Misdelivery Breaches Figure 24. Top error varieties in breaches over time n=100 (2010), n=347 (2018) Error As we see in Figure 24, the top two error varieties are consistent with prior publications, with Misconfiguration increasing at the expense of Loss and Disposal Errors. Sending data to the incorrect recipients (either via email or by mailed documents) is still an issue. Similarly, exposing data on a public website (publishing error) or misconfiguring an asset to allow for unwanted guests also remain prevalent. Affected assets Workstations, web applications, and surprisingly, mail servers are in the top group of assets affected in data breaches. There is a great deal to be learned about how threat actions associate with assets within the event chains of breaches. We get down to business in Table 1 to pull out some of the more interesting stories the 2019 DBIR data has to tell us. Figure 24. Top error varieties in breaches over time n=100 (2010), n=347 (2018)
  • 17.
    17 The table abovedoes exclude assets where a particular variety was not known. In the majority of phishing breaches, we are not privy to the exact role of the influenced user and thus, Person - Unknown would have been present. We can deduce that phishing of Those Who Cannot Be Named leads to malware installed on desktops or tricking users into providing their credentials. Most often, those compromised credentials were to cloud-based mail servers. There was an uptick in actors seeking these credentials to compromise a user’s email account. It turns out there are several ways to leverage this newly found access. Actors can launch large phishing campaigns from the account, or if the account owner has a certain degree of clout, send more targeted and elaborate emails to employees who are authorized to pay bogus invoices. There were also numerous cases where an organization’s email accounts were compromised and the adversary inserted themselves into conversations that centered around payments. At this point, the actors are appropriately positioned to add forwarding rules in order to shut out the real account owner from the conversation. Then they simply inform the other recipients that they need to wire money to a different account on this occasion because…reasons. Table 1 Top action and asset variety combinations within breaches, (n= 2,013) Action Asset Count Hacking - Use of stolen creds Server - Mail 340 Social - Phishing Server - Mail 270 Social - Phishing User Dev - Desktop 251 Malware - Backdoor User Dev - Desktop 229 Malware - C2 User Dev - Desktop 210 Hacking - Use of backdoor or C2 User Dev - Desktop 208 Malware - Spyware/Keylogger User Dev - Desktop 103 Malware - Adminware User Dev - Desktop 91 Misuse - Privilege abuse Server - Database 90 Malware - Capture app data Server - Web application 83
  • 18.
    18 Other Classified System Bank Secrets Payment Medical Personal Credentials Internal Breaches Figure 27. Topdata varieties compromised in breaches (n=1,285) 0% 20% 40% 60% 80% 100% Compromised data Figure 27 details the varieties of data that were disclosed as a result of the data breaches that occurred this year. Personal information is once again prevalent. Credentials and Internal are statistically even, and are often both found in the same breach. The previously mentioned credential theft leading to the access of corporate email is a very common example. Another trend in this year’s data set is a marked shift away from going after payment cards via ATM/gas pump skimming or Point of Sale systems and towards e-commerce applications. The 83 breaches with the association of web application and the action of type capture application data is one indicator of this change. Figure 26 below illustrates how breaches with compromised payment cards are becoming increasingly about web servers – additional details can be found in the Retail industry section. Not Webapp Server Webapp Server25% 50% 75% 2015 2016 2017 2018 Figure 26. Webapp Server vs. Not Webapp Server assets in payment data breaches over time
  • 19.
    19 Breach timeline As wehave mentioned in previous reports, when breaches are successful, the time to compromise is typically quite short. Obviously, we have no way of knowing how many resources were expended in activities such as intelligence gathering and other preparations.10 However, the time from the attacker’s first action in an event chain to the initial compromise of an asset is typically measured in minutes. Conversely, the time to discovery is more likely to be months. Discovery time is very dependent on the type of attack in question. With payment card compromises, for instance, discovery is usually based upon the fraudulent use of the stolen data (typically weeks or months), while a stolen laptop will usually be discovered much more quickly because it is relatively obvious when someone has broken the glass out of your car door and taken your computer. Finally, it goes without saying that not being compromised in the first place is the most desirable scenario in which to find oneself. Therefore, a focus on understanding what data types you possess that are likely to be targeted, along with the correct application of controls to make that data more difficult (even with an initial device compromise) to access and exfiltrate is vital. Unfortunately, we do not have a lot of data around time to exfiltration, but improvements within your own organization in relation to both that metric along with time to discovery can result in the prevention of a high-impact confirmed data breach. Containment, (n=127) Discovery, (n=390) Exfiltration, (n=87) Compromise, (n=140) Seconds Minutes Hours Days Weeks Months Years 0% 20% 40% 60% 0% 20% 40% 60% 0% 20% 40% 60% 0% 20% 40% 60% Breaches Figure 28. Breach timelines 10 Though we are starting to look before and after the breach in the Data Breaches, Extended Version section
  • 20.
    20 This calls forthe old Billy Baroo. Last year we pointed out how a golfer navigating a golf course is a lot like an adversary attacking your network.11 The course creator builds sand traps and water hazards along the way to make life difficult. Additional steps, such as the length of grass in the rough and even the pin placement on the green can raise the stroke average for a given hole. In our world, you’ve put defenses and mitigations in place to deter, detect, and defend. And just like on the golf course, the attackers reach into their bag, pull out their iron, in the form of a threat action, and do everything they can to land on the attribute they want in the soft grass of the fairway. The first thing to know is that unlike a golfer who graciously paces all the way back to the tees to take his or her first shot, your attackers won’t be anywhere near as courteous. In Figure 29 we see that attack paths are much more likely to be short than long. And why not, if you’re not following the rules (and which attackers do?) why hit from the tees unless you absolutely have to? Just place your ball right there on the green and tap it in for a birdie or a double eagle, as the case may be. And while your normal genteel golfer will abide (to a greater or lesser degree) by the course rules on the off chance that there is a Marshall watching and start on hole 1, threat actors will invari- ably take the shotgun start approach. They will begin their round on the hole they are shooting for, whether it’s confidentiality, integrity, or availability. Figure 30 provides a look at the three holes on our InfoSec golf course. It displays the number of events and threat actions in the attack chains, by last attri- bute affected. There is a lot to take in, and we do want to point a few things out. Unbroken chains 11 We are not saying hackers have early 90’s John Daly mullets. We don’t have data to support that. We just imagine that they do, and that this is why they all wear hoodies in clip art. “My golf security is so delicate, so tenuously wired together with silent inward prayers, exhortations and unstable visualizations, that the sheer pressure of an additional pair of eyes crumbles the whole rickety structure into rubble.” —John Updike, with the sympathy of some CISOs. While it is our belief that this section can be of interest and benefit to our readers, there are a couple of caveats that should be made clear from the beginning. First of all, we have only recently updated the VERIS schema to allow for collection of event chain data. Secondly, not all incident and breach records offer enough details to attempt to map out the path traveled by the threat actor. We collect an action, actor, asset, and attribute at each step. However, each may be “Unknown” or omitted completely if it did not occur in that particular step of the attack. To create a single path from these factors, we begin by placing the actor at the first step at the beginning of the path. It’s followed by the action and then attribute present in the step. For the remaining steps it proceeds from action to attribute to action of the next step, simply skipping over any omitted. 0 100 200 300 0 5 10 15 Number of steps Breaches Figure 29. Number of steps per incident (n=1,285) Short attack paths are much more common than long attack paths.
  • 21.
    21 First, starting withConfidentiality, take a look at just how many short paths result from Misuse and Error, and to a lesser extent from Physical actions. On the other hand, we can see Hacking actions bounding back and forth between attributes for several steps. In Integrity we see an especially long chain beginning with Hacking and going to and fro between that and Malware as it compromises the Confidentiality and Integrity of the target. Obviously, there’s a lot going on in Figure 30. An easier way of looking at it is what actions start (Figure 31), continue (Figure 32), and end (Figure 33) incidents. Integrity Confidentiality Availability Integrity Confidentiality Availability Integrity Confidentiality Availability IntegrityConfidentialityAvailability 14 12 10 8 6 4 2 Steps Action Error Malware Physical Unknown Hacking Misuse Social Figure 30. Attack chain by final attribute compromised¹² (n=941) 0 Integrity Confidentiality Availability Integrity Confidentiality Availability Integrity Confidentiality Availability IntegrityConfidentialityAvailability 14 12 10 8 6 4 2 Steps Action Error Malware Physical Unknown Hacking Misuse Social Figure 30. Attack chain by final attribute compromised¹² (n=941) 0 Integrity Confidentiality Availability Integrity Confidentiality Availability Integrity Confidentiality Availability IntegrityConfidentialityAvailability 14 12 10 8 6 4 2 Steps Action Error Malware Physical Unknown Hacking Misuse Social Figure 30. Attack chain by final attribute compromised¹² (n=941) 0 12 There’s a lot going on in this figure. Take your time and explore it. For example, notice the differences between short and long attacks.
  • 22.
    22 We see thatthe while Hacking is a little farther ahead, the first action in an incident could be almost anything. The most interesting part is that Malware is at the end of the chart, even behind Physical, which requires the attacker to be, well, physically present during the attack. Malware is usually not the driver you use to get off the tee; remember that most is delivered via social or hacking actions. Moving on to Figure 32, Malware makes its grand entrance. It may not be the opening shot, but it is the trusty 7-iron (or 3 wood, pick your analogy according to your skills), that is your go-to club for those middle action shots. Interestingly, there are almost no Misuse and Physical middle actions and no Error in our data set. That’s primarily because these are short attack paths and to be in the middle you have to have at least three events in the chain. And finally, we get a chance to see where attacks end in Figure 33. The most significant part is how Social is now at the bottom. While social attacks are significant for starting and continuing attacks as seen in Figures 31, they’re rarely the three-foot putt followed by the tip of the visor to the sunburned gallery. Malware Physical Misuse Social Error Hacking 0% 20% 40% 60% 80% 100% Incidents Figure 31. Actions in first step of incidents (n=909). An additional 32 incidents, (3.40% of all paths), started with an unknown action. Physical Misuse Social Hacking Malware Incidents Figure 32. Actions in middle steps of incidents (n=302) 0% 20% 40% 60% 80% 100% Social Physical Misuse Error Malware Hacking Incidents Figure 33. Actions in last step of incidents (n=942) 0% 20% 40% 60% 80% 100%
  • 23.
    23 0% 25% 50% 75% 0 5 1015 Number of steps Attacksuccess Figure 34. Attack success by chain length in simulated incidents (n=87) At this point, you may be wondering if your sand traps are sandy enough. Figure 34 comes from breach simulation data. It shows that in testing, defenders fail to stop short paths substantially more often than long paths. So, just in case you were looking on your systems and thinking “it’s the other guys that let the attackers start on the putting green,” short attacks work. Attack Paths and Mitigations Our friends at the Center for Internet Security contributed some thoughts on mitigating attack paths: Much of security has been founded on cat- alogues of controls, vague vendor promises, laborious legislation, and tomes of things to do to keep your organization safe. Within this sea of options, we also have to justify our budgets, staff, and meet the business needs of the organization. Leveraging an attack path model is not only an important step towards formalizing our understanding of attacks, but also a means to understanding our defense. Previously, when looking at attack summary data we were presented with a snapshot of an attacker’s process which requires us to infer the preceding and proceeding events. Wheth- er we realize it or not, such interpretations impact how we plan our defenses. Defending against malware takes a different approach if the malware is dropped via social engineering, a drive-by download, or brought in by an insider via a USB device. In addition, while being faced with what seems like an endless list of potential attacks, limiting ourselves to snapshots also hinders our ability to find commonalities between these attacks. Such commonalities may be key dependencies in an attacker’s process which represent opportunities for us to disrupt. The more we can understand the sequence of events happening in an attack, the more we as a community can make it harder for adversaries to reuse the same process.
  • 24.
    24 Beginning with the2014 report, we have utilized nine basic patterns to categorize security incidents and data breaches that share several similar characteristics. This was done in an effort to communicate that the majority of incidents/breaches, even targeted, sophisticated attacks, generally share enough commonalities to categorize them, and study how often each pattern is found in a particular industry’s data set. When we first identified the patterns six years ago we reported that 92 percent of the incidents in our corpus going back 10 years could be categorized into one of the nine patterns. Fast-forwarding to today with over 375,000 incidents and over 17,000 data breaches, the numbers reveal that 98.5% of security incidents and 88% of data breaches continue to find a home within one of the original nine patterns. So, it would appear that, as with humans, the “I can change” mantra is false here as well. Incident classification patterns and subsets Payment Card Skimmers Point of Sale Cyber-Espionage Everything Else Miscellaneous Errors Web Applications Lost and Stolen Assets Crimeware Denial of Service Privilege Misuse Incidents Figure 35. Incidents per pattern (n=41,686) 0% 20% 40% 60% 80% 100% Denial of Service Payment Card Skimmers Point of Sale Lost and Stolen Assets Crimeware Everything Else Cyber-Espionage Privilege Misuse Miscellaneous Errors Web Applications Breaches Figure 36. Breaches per pattern (n=2,013) 0% 20% 40% 60% 80% 100%
  • 25.
    25 The patterns willbe referenced more in the industry sections, but to get acquainted or rekindle a relationship, they are defined below: Crimeware: All instances involving malware that did not fit into a more specific pattern. The majority of incidents that comprise this pattern are opportunistic in nature and are financially motivated. Notable findings: Command and control (C2) is the most common functionality (47%) in incidents, followed by Ransomware (28%). Cyber-Espionage: Incidents in this pattern include unauthorized network or system access linked to state-affiliated actors and/or exhibiting the motive of espionage. Notable findings: Threat actors attributed to state- affiliated groups or nation-states combine to make up 96% of breaches, with former employees, competitors, and organized criminal groups representing the rest. Phishing was present in 78% of Cyber-Espionage incidents and the installation and use of backdoors and/or C2 malware was found in over 87% of incidents. Breaches involving internal actors are categorized in the Insider and Privilege Misuse pattern. Denial of Service: Any attack intended to compromise the availability of networks and systems. This includes both network and application attacks designed to overwhelm systems, resulting in performance degradation or interruption of service. Notable findings: This pattern is based on the specific hacking action variety of DoS. The victims in our data set are large organizations over 99 percent of the time. Insider and Privilege Misuse: All incidents tagged with the action category of Misuse—any unapproved or malicious use of organizational resources—fall within this pattern. Notable findings: This is mainly insider misuse, but former and collusive employees as well as partners are present in the data set. Miscellaneous Errors: Incidents in which unintentional actions directly compromised a security attribute of an asset. Notable findings: Misdelivery of sensitive data, publishing data to unintended audiences, and misconfigured servers account for 85% of this pattern. Payment Card Skimmers: All incidents in which a skimming device was physically implanted (tampering) on an asset that reads magnetic stripe data from a payment card. Notable findings: Physical tampering of ATMs and gas pumps has decreased from last year. This may be attributable to EMV and disruption of card-present fraud capabilities. Point of Sale Intrusions: Remote attacks against the environments where card-present retail transactions are conducted. POS terminals and POS controllers are the targeted assets. Physical tampering of PIN entry device (PED) pads or swapping out devices is covered in the Payment Card Skimmers section. Notable findings: The Accommodation industry is still the most common victim within this pattern, although breaches were less common this year. Physical Theft and Loss: Any incident where an information asset went missing, whether through misplacement or malice. Notable findings: The top two assets found in Physical Theft and Loss breaches are paper documents, and laptops. When recorded, the most common location of theft was at the victim work area, or from employee-owned vehicles. Web Application Attacks: Any incident in which a web application was the vector of attack. This includes exploits of code-level vulnerabilities in the application as well as thwarting authentication mechanisms. Notable findings: Over one-half of breaches in this pattern are associated with unauthorized access of cloud-based email servers.
  • 26.
    26 Patterns within patterns Thereare two subsets of incidents that will be called out when looking at industry breakouts. The increase in mail server (and email account) compromise and the significant dollar losses from social attacks leading to fraudulent payments provided an opportunity to create a Financially-Motivated Social Engineering (FMSE) subset that Includes incidents and breaches that would fall into Web Application Attacks or Everything Else. These incidents are included in the main corpus, but we will look at them independently as well. The incidents that comprise the botnet subset, are not part of the main data set, due to the sheer volume. These incidents could fall into Crimeware if modeled from the perspective of the malware recipient, or Web applications if the botnet steals credentials from one victim and is used against another organizations’ application. Our data is from the latter, organizations whose systems are logged on via stolen user credentials. Financially-Motivated Social Engineering Subset: Financially motivated incidents that resulted in either a data breach or fraudulent transaction that featured a Social action but did not involve malware installation or employee misuse. Financial pretexting and phishing attacks (e.g., Business Email Compromise, W-2 phishing) are included in this subset. Notable findings: 370 incidents, 248 of which are confirmed data breaches, populate this subset. The incidents are split almost evenly between parent patterns of Everything Else and Web applications. The breaches are closer to a 3:1 Web Application to Everything Else ratio. Everything Else: Any incident or breach that was not categorized into one of the nine aforementioned patterns. Notable findings: Of the 241 breaches that fell into the Everything Else pattern, 28% are part of the Financially-Motivated Social Engineering attacks subset discussed later in this section. Analysis shows 6x fewer Human Resources personnel being impacted in breaches this year. This finding, as correlated with the W-2 scams, almost disappearing from our dataset. While this may be due to improved awareness within organizations, our data doesn’t offer any definitive answers as to what has caused the drop. Botnet Subset: Comprised of over 50,000 instances of customers as victims of banking Trojans or other credential-stealing malware. These are generally low on details and analyzed separately to avoid eclipsing the rest of the main analysis data set. Notable findings: 84% of the victims were in Finance and Insurance (52), 10% in Information (51), and 5% in Professional, Scientific, and Technical Services (54). 180 countries and territories are represented in these breaches. Botnets are truly a low-effort attack that knows no boundaries and brings attackers either direct revenue through financial account compromise or infrastructure to work from. Secondary Subset: Comprised of 6,527 incidents of web applications used for secondary attacks such as DDoS sources or malware hosting. These are legitimate incidents, but low on details and analyzed separately from the main analysis data set. Notable findings: Many times, these are light on specifics, but we do know that 39% of the time they involved a malware action, with 70% of those being DDoS, and 30% exploiting a vulnerability and downloading additional malware. Attackers need infrastructure too and just like with the botnet subset, when an attacker takes over your web application, your infrastructure just got converted to multi-tenant.
  • 27.
    27 13 Save some largeorganizations that have gone after dark markets or bullet-proof hosting There’s definitely a feeling in InfoSec that the attackers are outpacing us. They’ve got all the creds, the vulns, and the shells, not to mention the possibility of huge monetary incentives. We, on the other hand, have a four-year project just to replace the servers on end-of-life operating systems. However, when contemplating this unfair advantage it’s sometimes easy for us to overlook the bigger picture. While it is true that attacks typically happen quickly (hours or less) when they are well aimed, and it also is true that when our organizations are successfully breached it often takes us months or more to learn of it, there is still room for optimism. In the paths section we examined the route that attackers take to get from point A to point B. In this section we take a look at those events that take place prior to the attack, and those required after the attack has ended in order for the attacker to realize their profit. Like all good stories, attackers need somewhere to begin, and whether this starting point is with a list of vulnerable servers, phished emails, or stolen creden- tials, if the proverbial lever is long enough they will breach your perimeter. Therefore, it is wise to do all that you can to reduce the number of starting points that they are provided. After all, vulns can usually be patched and creds can be better protected with multi-factor authentication. Having said that, we do realize that even the best security departments can only do so much. Sixty-two percent of breaches not involving an Error, Misuse, or Physical action (in other words, wounds that weren’t self-inflicted) involved the use of stolen creds, brute force, or phishing. And all that malware doesn’t write itself. Admittedly, there’s not a lot you can do about the development, preparation, targeting, distribution, and other shenanigans that take place on the part of the bad guy before the breach.13 However, what goes down after the breach is another story altogether. Just ask the axis Let’s look at what’s being stolen. In Figure 37 we illustrate the analysis of the amount lost to attackers in two types of breaches: business email compromises and computer data breaches. This loss impact data comes courtesy of the Federal Bureau of Investigation Internet Crime Complaint Center (FBI IC3) who have offered some helpful hints in the breakout at the end of this section. When looking at the visualized distribution, the first thing to notice is the spike at zero. Not all incidents and breaches result in a loss. The second piece of good news is that the median loss for a business email compromise is approximately the same as the average cost of a used car. The bad news is that the dollar axis isn’t linear. There are about as many breaches resulting in the loss of between zero and the median as there are between the median and $100 million. We are no longer talking about used-car money at this point, unless you happen to be Jay Leno. As mentioned above, there’s a great deal that has to occur even after the breach takes place to make it worth the criminal’s while. For example, business email compromises normally involve the fraudulent transfer of funds into an attacker-owned bank account. Business Email Compromise Median = $24,439 (n = 18,606) Computer Data Breach Median = $7,611 (n = 1,711) $0 $100 $100K $100M Dollars Figure 37. Amount stolen by breach type Data breaches: extended version “Give me a place to stand and a lever long enough and I will move the world.” —Archimedes
  • 28.
    28 Figure 38. Termclusters in criminal forum and marketplace posts
  • 29.
    29 On this front,we have more glad tidings to impart. When the IC3 Recovery Asset Team acts upon BECs, and works with the destination bank, half of all US-based business email compromises had 99% of the money recovered or frozen; and only 9% had nothing recovered. Let that sink in. BECs do not pay out as well as it initially appears, and just because the attacker won the first round doesn’t mean you shouldn’t keep fighting. On the other hand, BECs are still advantageous for the criminal element because they provide a quick way to cash out. Many other types of data breaches require a little more work on the adversaries’ part to convert stolen data into accessible wealth. A common solution is to sell what you stole, whether PII, email addresses, creds, credit card numbers, or access to resources you have compromised. Figure 38 provides information about the numerous things for sale in the darker corners of the Internet (which surprisingly enough, resemble a 1990s video game message board). In the center we see a large blue cluster. This is comprised primarily of credit card related posts—the buying and selling of credit cards, to make money, to take money, and to cash out gains. It also includes smaller nodes related to the attacks involved in actually stealing the cards. There’s an even smaller cluster in the upper right which is related to credential theft. These may grant access to more lucrative things such as bank accounts, but many times are for consumer services including video games, streaming video, etc., that attackers use directly. The alternative to posting this data for sale on the dark web is using the data to steal identities and committing direct fraud themselves. Herein lies the appeal of stealing tax and health-related information. Filing fraudulent tax returns or insurance claims is a relatively straightforward way to put cash in one’s pocket. The problem is that tax returns and insur- ance claims don’t pay out in unmarked bills or wire transfers to South America. This requires another step in the post-breach to-do list: money laundering. Normally money laundering is an expensive and risky task. If, for example, the money has to go through three separate set of hands on its way to its final destination, each person needs to take their respective cut. If the third person in the succession says they did not receive it, but the first person insists they sent it, who does the actor believe? “There is no honor among thieves,” etc. This is in large part why attackers often favor cryptocurrency, as is it can be laundered and transferred for relatively low cost and presents negligible risk. However, a distinct drawback is that this type of currency is a bit limited with regard to what one can purchase with it. Thus, at some point it has to be exchanged. For these and other reasons, research into increasing both the risk and cost associated with cryptocurrency laundering and/or exchange for illicit purposes has a good deal of potential as a means of increasing breach overhead and thereby decreasing the relative profit associated with such crimes. About the IC3 The Federal Bureau of Investigation Internet Crime Complaint Center (IC3) provides the public with a trustworthy and convenient report- ing mechanism to submit information concerning suspected internet-facilitated criminal activity. The IC3 defines the Business Email Compromise (BEC) as a sophisticated scam targeting both business and individuals per- forming wire transfer payments. The Recovery Asset Team (RAT) is an IC3 initiative to assist in the identification and freezing of fraudulent funds related to BEC incidents. Regardless of dollar loss, victims are encouraged and often directed by law enforce- ment to file a complaint online at www.ic3.gov. The IC3 RAT may be able to assist in the recovery efforts.
  • 30.
    30 Victim demographics and industryanalysis Incidents: Total Small Large Unknown Breaches: Total Small Large Unknown Accommodation (72) 87 38 9 40 61 34 7 20 Administrative (56) 90 13 23 54 17 6 6 5 Agriculture (11) 4 2 0 2 2 2 0 0 Construction (23) 31 11 13 7 11 7 3 1 Education (61) 382 24 11 347 99 14 8 77 Entertainment (71) 6,299 6 6 6,287 10 2 3 5 Finance (52) 927 50 64 813 207 26 19 162 Healthcare (62) 466 45 40 381 304 29 25 250 Information (51) 1,094 30 37 1,027 155 20 18 117 Management (55) 4 1 3 0 2 1 1 0 Manufacturing (31-33) 352 27 220 105 87 10 22 55 Mining (21) 28 3 6 19 15 2 5 8 Other Services (81) 78 14 5 59 54 6 5 43 Professional (54) 670 54 17 599 157 34 10 113 Public (92) 23,399 30 22,930 439 330 17 83 230 Real Estate (53) 22 9 5 8 14 6 3 5 Retail (44-45) 234 58 31 145 139 46 19 74 Trade (42) 34 5 16 13 16 4 8 4 Transportation (48-49) 112 6 23 83 36 3 9 24 Utilities (22) 23 3 7 13 8 2 0 6 Unknown 7,350 0 3,558 3,792 289 0 109 180 Total 41,686 429 27,024 14,233 2,013 271 363 1,379 Table 2 Number of security incidents by victim industry and organization size The data set for this report totals over 100,000 incidents, 101,168 to be exact. After we removed the subsets that were detailed in the prior section, and applied minimum complexity filters, the data set used for core analysis is established. Table 2 is the repre- sentation of that data set broken out by industry and organization size, when known. Our annual statement on what not to do with this breakout will now follow. Do not utilize this to judge one industry over another – so a security staffer from a construction organization waving this in the face of their peer from the financial sector and trash-talking is a big no-no.
  • 31.
    31 ActionAssetPattern 684 206 75 69 23 22 14 4 1 575 100 76 52 36 32 29 21 9 408 79 60 59 30 14 13 9 226 37 31 30 24 19 9 6 110 104 76 71 62 39 3 3 40 2 17 14 7 5 4 1 1 13,021 4,758 2,820 1,515 992 143 93 61 163 58 40 36 23 16 14 5 92 54 21 16 14 12 10 10 7 2 796 244 72 38 14 5 699 100 96 88 38 32 524 100 91 37 13 8 279 50 43 40 19 6 124 110 100 91 85 47 61 45 18 5 5 1 13,021 4,922 4,317 1,279 201 20 233 88 56 36 16 4 162 90 16 16 15 15 874 41 38 2 1 1 722 90 69 24 16 1 559 104 58 20 4 324 45 45 10 2 225 98 93 71 3 1 68 40 18 1 3,009 1,244 777 201 3 259 62 58 2 1 1 184 30 15 9 8 1 Incidents Accommodation (72) Education (61) Finance(52) Healthcare (62) Information (51) Manufacturing (31-33) Professional (54) Public(92) Retail (44-45) PaymentCard Skimmers Point of Sale Lost and Stolen Assets Miscellaneous Errors Cyber-Espionage Denial of Service Everything Else Privilege Misuse Web Applications Crimeware Physical Error Social Misuse Hacking Malware Kiosk/Term Media Network Person Server User Dev 0% 25% 50% 75% 100% Figure 39. Industry comparison 65 45 20 17 7 3 1 1 70 45 34 22 18 12 7 2 73 28 26 10 8 8 5 1 35 24 20 9 5 3 3 97 85 65 28 27 2 2 1 38 14 3 3 2 1 1 1 140 58 40 37 33 16 8 36 14 13 12 8 5 2 88 14 11 9 8 4 3 3 2 75 67 33 32 7 2 95 69 45 36 33 18 100 69 31 29 10 3 42 38 37 16 9 1 110 85 78 78 17 46 7 42 14 2 2 1 205 173 153 66 40 9 58 42 26 14 13 2 102 70 14 14 10 6 133 32 19 2 1 1 117 70 38 17 13 1 111 73 29 14 2 60 40 32 6 1 165 80 79 29 1 55 33 14 1 173 165 131 31 1 64 44 26 2 1 118 16 10 7 4 1 Breaches Accommodation (72) Education (61) Finance(52) Healthcare (62) Information (51) Manufacturing (31-33) Professional (54) Public(92) Retail (44-45) Figure 39. Industry Comparison (left: all security incidents, right: only breaches)
  • 32.
    32 Retail (44-45) Accommodation (72) Information(51) Public (92) Education (61) Manufacturing (31-33) Finance (52) Healthcare (62) Professional (54) Incidents Figure 40. FMSE incidents by industry (n=370) 0% 20% 40% 60% 80% 100% Our community of contributors, disclosure requirements, and the population sizes for the industries all play a major part in the numbers above. The actual threat landscapes for organizations are better depicted in Figure 39. This shows what types of attack patterns are more common to your industry, along with breakouts for threat action categories and affected assets. We will explore deeper into the breach jungle, machete in hand, in the individual industry sections. As we break down industries we see, for example, in Figure 40 how FMSE incidents disproportionately affect Professional Services, Healthcare and Finance, with more point of sale-centric industries appear towards the bottom of the list. However, it’s clear that FMSE incidents affect all industries and so all organizations need to be trained and prepared to prevent them. Phishing Figure 41 ranks the click rates per industry for sanctioned security awareness training exercises. This data was provided by several vendors in this space, and merged together for analysis. While we realize we were relatively strict earlier about curtailing trash talk on the above Table, feel free to use this for some good-natured banter on an as-needed basis. Just be sure to keep it at an appropriate level. “Not looking so hot anymore for someone who works outside, Construction” is approximately the correct amount of snark (trust us, we are experts). On a positive note, all industries are clocking in with percentages that are less than the overall percentage in this study 2 years ago. So, this calls for much rejoicing. 3.12% 1.32% 2.33% 2.04% 3.23% 4.93% 2.13% 4.48% Retail (44-45) Finance (52) Healthcare (62) Information (51) Manufacturing (31-33) Professional (54) Public (92) Education (61) 0% 2% 4% 6% Figure 41. Click rate in phishing tests by industry Before you flip/scroll over to your industry section, we have aligned several non-incident data sources to industry that are worth your while to peruse first.
  • 33.
    33 0.69Gbps 1.47Gbps 1.27Gbps 0.65Gbps 0.93Gbps 0.7Gbps 1.1Gbps 0.11Mpps 0.5Mpps 0.36Mpps 0.16Mpps 0.45Mpps 0.11Mpps 0.29Mpps BPS PPS Education (61) n=219 Finance(52) n=565 Information (51) n=660 Manufacturing (31-33) n=161 Professional (54) n=401 Public (92) n=792 Retail (44-45) n=52 10K1K100 Count Density Figure 42. DDoS attack bandwidth and packet counts by industry 100K 1M 10M 100M10K1K100 100K 1M 10M 100M 1B 10B 100B Denial of Service Over time DDoS attacks have been getting much more tightly clumped with regard to size (similar to Manufacturing in Figure 42). However, as other industries illustrate, that is not always the case. Some industries, Information for instance, experience attacks across a much wider range. Another important takeaway is that the median DDoS doesn’t change much from industry to industry. The difference between the biggest and smallest industry median is 800Mbps and 400Kpps. What’s your vector, Victor? Figure 43 takes a look at the median percentage of malware vectors and file types per industry; in other words, it helps you know where to look for the malware that’s coming in to your organization and what it will most likely look like. First of all, the majority of initial malware is delivered by email. Secondary infections are downloaded by the initial malware, or directly installed and, as such, are more difficult for network tools to spot. Secondly, though it varies a bit by industry, Office documents and Windows applications are the most common vehicles for the malware along with “Other” (archives, PDFs, DLLs, links, and Flash/iOS/Apple/Linux/Android apps).
  • 34.
    34 Delivery Method FileType Accommodation (72) Education (61) Finance (52) Healthcare (62) Information (51) Manufacturing (31-33) Professional (54) Public (92) Retail and Wholesale 0% 25% 50% 75% 100% Figure 43. Malware types and delivery methods by industry email web other Office doc Windows app other 95.2% 95.6% 96.9% 98.0% 97.7% 91.1% 96.8% 61.4% 94.8% 17.1% 0.0% 0.0% 0.0% 0.0% 0.0% 0.0% 0.0% 0.0% 0.0% 15.1% 14.4% 9.0% 10.5% 21.0% 10.3% 86.1% 16.7% 41.5% 64.4% 51.2% 37.6% 49.7% 67.1% 74.5% 26.6% 56.2% 28.2% 21.2% 16.1% 18.4% 25.7% 20.7% 17.4% 12.6% 34.2% 19.0% 24.9% 25.0% 33.3% 25.3% 10.0% 12.5% 27.2% 15.8%
  • 35.
    35 Frequency Top 3 patterns Threatactors Actor motives Data compromised 87 incidents, 61 with confirmed data disclosure Point of Sale intrusions, Web applications and Crimeware patterns represent 93% of all data breaches within Accommodation External (95%), Internal (5%) (breaches) Financial (100%) (breaches) Payment (77%), Credentials (25%), Internal (19%) (breaches) How can we be of service? The Accommodation industry prides itself on hospitality, and over the years it has been far too hospitable to criminals. Financially motivated actors are bringing home the bacon by compromising the Point of Sale (POS) environments and collecting customers’ payment card data. Table 3 lists the 10 most common combinations of threat action varieties and assets. These are pairings that are found in the same breach, but not necessarily the same event or step in the breach. As stated above, some of these combinations are indicative of a specific action taken against a specific asset (e.g., RAM Scraping malware infecting a Accommodation and Food Services The breach totals in our data set have decreased from last year, primarily due to a lack of POS vendor incidents that have led to numerous organizations being compromised with stolen partner credentials. POS Terminal). Others show that some actions are conducted earlier or later in event chains that feature a particular asset – you don’t phish a laptop, but you may phish a human and install malware on his/her laptop in the next step. In brief, the game has not changed for this industry. POS Controllers are compromised and malware specifically designed to capture payment card data in memory is installed and extended to connected POS Terminals. While these POS intrusions are often a small business issue, large hotel and restaurant chains can learn from this data and if they use a franchise business model, disseminate this knowledge to their franchisees. The RAM scrapers may be the specialty of the house, but malware does not spontaneously appear on systems. When the infection vector is known, it is typically a direct installation after the actors use stolen, guessable, or default credentials to gain access into the POS environment. A cause for optimism? While attacks against POS environments make up the vast majority of data breaches against Accommodation and Food Service organizations, the number has decreased from 307 in last year’s report to 40 in this report. Sounds pretty dope so far, but we do not use number of breaches as a solid indicator of “better” or “worse” as there are not only changes in our contributors, but also changes in the types of events our contributors may focus on year over year. Even with such a drastic change, it isn’t unprecedented. Figure 44 shows the volatility of breach counts of this ilk. POS breaches are often conducted by organized criminal groups looking to breach numerous targets and there have been sprees of hundreds of victims associated with the same hacking group. Back in 2011, default credentials were used with great success evidenced by over 400 breaches, and recent sprees have been associated with POS vendors suffering breaches leading to subsequent breaches of their customer base.
  • 36.
    36 0 100 200 300 400 2010 2012 20142016 2018 Breaches Figure 44. POS intrusions in Accommodation breaches over time The absence of a large spree in this year’s data set is reflected in the drop, but (and it seems like there is always a “but”) after our window for data closed and during this writing there has already been a publicly disclosed POS vendor breach affecting multiple food service victims.14 So, let this be the first ever sneak peek into the 2020 DBIR – POS attacks are not quite an endangered species. 14 https://ncbpdataevent.com/ And speaking of delivering bad news Accommodation data breach victims are informed of their plight the majority of the time via Common Point of Purchase alerts as shown in Figure 45. In fact, 100 percent of POS intrusions in this industry were discovered via external methods. This is a clear indicator that while there is work to be done on preventative controls around POS compromise, there is equal room for improvement in detecting compromise. Being a realist and understanding that many of these victims are “mom and pop” operations asking for sophisticated file integrity software or DLP is not a feasible plan of action for many of these organizations. Working with POS vendors to ensure that someone knows when the environment is accessed via existing remote access methods is a start. A pragmatic process to inform the business owners that legitimate work is being done by the partner would certainly be another simple step up from the current state of affairs. Table 3 Top threat action and asset pairings within Accommodation breaches (n= 61) Action Asset Count Malware - RAM scraper Server - POS controller 32 Malware - RAM scraper User Dev - POS terminal 27 Hacking - Use of stolen creds Server - Mail 8 Social - Phishing Server - Mail 8 Hacking - Use of stolen creds Server - POS controller 7 Hacking - Use of stolen creds User Dev - POS terminal 7 Malware - Backdoor Server - POS controller 6 Malware - Backdoor User Dev - POS terminal 6 Hacking - Brute force Server - POS controller 5 Hacking - Brute force User Dev - POS terminal 3
  • 37.
    37 IT review Break indiscovered Log review Law enforcement Customer Fraud detection Breaches Figure 45. Discovery methods in Accommodation breaches (n=42) 0% 20% 40% 60% 80% 100% Cover your assets The data shows year-over-year that there is a malware problem affecting POS controllers and terminals. Implement anti-malware defenses across these environments and validate (and re–vali- date) the breadth of implementation and currency of controls. Focus on detective controls as well, the external correlation of fraudulent usage of payment cards should not be the sole means of finding out that malware has been introduced into your POS environment. Restrict remote access to POS servers and balance the business needs of intercon- nectivity between POS systems among your locations with defending against the potential spread of malware from the initial location compromised. Sleep with one eye open Since you can’t build a perfectly secure system, security operations helps monitor for those weird logins in the middle of the night. If you can justify it in your budget, a security operations team is a must. Even if you can’t afford an in-house team, contracting it as a service or requiring it to be a part of your POS or IT contracts will cover you and allow you to benefit from economies of scale. Chips and Dip When a chip-enabled card is dipped in a properly configured EMV-enabled POS terminal, the static, reusable magnetic strip information (PAN) is not exposed or stored. This is a good thing and along with contactless payment methods, disrupts the old way of stealing things for the bad guys. The attacks against EMV technology are more theoretical and/or not conducive to real-world use. We know that cyber-criminals are a crafty bunch and nothing is bulletproof, but continue to embrace and implement new technologies that raise the bar to protect against payment card fraud. Things to consider: No vacancy The numbers from annual breach totals are influenced by smaller food service businesses caught up in what we have described as POS smash-and-grabs. Whether leveraging default credentials or stolen credentials, organized criminal groups often go after numerous little fish – but not always. Several interna- tional hotel chains and restaurants have also been hit. While the initial intrusion method may not have been as easy as scanning the Internet and issuing a de- fault password, there are some lessons to be learned. Static authentication is circumvented using valid credentials and what follows is installation of RAM scraping malware and adminware such as psexec or PowerShell to facilitate the spread of malware across multiple terminals in multiple locations.
  • 38.
    38 It’s in thesyllabus Anticipating the top pattern for Education each year is a bit like playing the “which shell is it under?” game. You know it’s (most likely) under one of three shells, but when you finally point to one, the data proves you wrong with a deft statistical sleight of hand. There were three patterns in a statistical dead heat and like the Netherlands’ women speed skaters in the 3000m, it was a dominant podium sweep. Miscellaneous Errors (35%) had a strong showing, because (spoiler alert) people still have their moments. Most of these errors are of the typical misdelivery and publishing error types that we have all come to know and love. Crimeware Lost and Stolen Assets Cyber-Espionage Privilege Misuse Everything Else Web Applications Miscellaneous Errors Breaches Figure 46. Patterns within Education breaches (n=99) 0% 20% 40% 60% 80% 100% Web Application Attacks accounted for roughly one quarter of breaches in the Education vertical. This is mostly due to the frequent compromise of cloud-based mail services via phishing links to phony login pages. So, if you use such a service 24/7/...365 you might want to consider tightening up your password security and implement a second authentication factor and then turning off IMAP. Education continues to be plagued by errors, social engineering and inadequately secured email credentials. With regard to incidents, DoS attacks account for over half of all incidents in Education. Frequency Top 3 patterns Threat actors Actor motives Data compromised 382 incidents, 99 with confirmed data disclosure Miscellaneous Errors, Web Application Attacks, and Everything Else represent 80% of breaches External (57%), Internal (45%), Multiple parties (2%) (breaches) Financial (80%), Espionage (11%), Fun (4%), Grudge (2%), Ideology (2%) (breaches) Personal (55%), Credentials (53%), and Internal (35%) (breaches) Educational Services
  • 39.
    39 2016 2018 0 2 9 43 45% 2 2 5 12 79% +2 0 -4 -31 +33 DIFF Ideology Grudge Fun Espionage Financial Breaches Figure 49.External motives in Education breaches over time n=44 (2016), n=42 (2018) (Secondary motives excluded) MitM Exploit vuln Brute force Use of backdoor or C2 Use of stolen creds Breaches Figure 47. Hacking varieties in Education breaches (n=37) 0% 20% 40% 60% 80% 100% Partner Other Desktop sharing Backdoor or C2 Web application Breaches Figure 48. Hacking vectors in Education breaches (n=33) 0% 20% 40% 60% 80% 100% Everything Else, as previously stated, is more or less the pattern equivalent of a “lost and found” bin. It contains numerous incident types we frequently encounter but that do not provide enough granularity for us to place in one of the other patterns. For exam- ple, there are compromised mail servers, but it was undetermined if stolen web credentials were the point of entry. About half or more of these breaches could be attributed to social engineering attacks via phishing. When known, the motivation is primarily financial, and is carried out mostly by organized criminal groups. There was a smattering of state-affiliated or cyber- espionage cases in this year’s data set, a reduction from the 2017 report as shown in Figure 49. This finding should not convince our readers that attacks seeking research findings and other espionage-related goals have gone the way of Home Economics in this vertical, but is instead more related to the number and type of incidents provided by our partners. Figure 49. External motives in Education breaches over time n=44 (2016), n=42 (2018) (Secondary motives excluded)
  • 40.
    40 Things to consider: Cleanout your lockers Many of the breaches that are repre- sented in this industry are a result of poor security hygiene and a lack of attention to detail. Clean up human error to the best extent possible – then establish a baseline level of security around internet-facing assets like web servers. And in 2019, 2FA on those servers is baseline security. Varsity or JV? Universities that partner with private Silicon Valley companies, run policy institutes or research centers are probably more likely to be a target of cyber-espionage than secondary school districts. Understand what data you have and the type of adversary who historically seeks it. Your institution of learning may not be researching bleeding-edge tech, but you have PII on students and faculty at the very least. Security conformity There are threats that (no matter how individualized one may feel) everyone still has to contend with. Phishing and general email security, Ransomware, and DoS are all potential issues that should be threat modeled and addressed. These topics may not seem new, but we still have not learned our lesson.
  • 41.
    41 Frequency Top 3 patterns Threatactors Actor motives Data compromised Financial and Insurance 927 incidents, 207 with confirmed data disclosure Web Applications, Privilege Misuse, and Miscellaneous Errors represent 72% of breaches External (72%), Internal (36%), Multiple parties (10%), Partner (2%) (breaches) Financial (88%), Espionage (10%) (breaches) Personal (43%), Credentials (38%), Internal (38%) (breaches) Filters are not just for social media photos We use filters in data analysis to focus on particular industries or threat actors and to pull out interesting topics to discuss. We also exclude certain subsets of data in order to reduce skew and avoid overlooking other trends and findings. This is not to say that we ignore or deny their existence, but rather we analyze them Denial of Service and use of stolen credentials on banking applications remain common. Compromised email accounts become evident once those attacked are filtered. ATM Skimming continues to decline. independently in other sections of this study. In this industry, we acknowledge, but filter, customer credential theft via banking Trojan botnets. Their numbers in this year’s data set show that they are not inconsequential matters, over 40,000 breaches associated with botnets were separately analyzed for the financial sector. We discuss both of these scenarios in more depth in the Results and Analysis section, but there is not much to say that has not already been said on the subjects. Below is what’s left and we will start with the common pairings of action and asset varieties. Keep in mind that breaches are often more than one event, and sometimes more than one of the combinations above are found in the same breach. I’d rather be phishing When we look at the two pairings that share mail servers as an affected asset in Table 4, we can see a story developing. Adversaries are utilizing social engineering tactics on users and tricking them into providing their web-based email credentials. That is followed by the use of those stolen creds to access the mail account. There are also breaches where the method of mail server compromise was not known, but the account was known to have been used to send phishing emails to colleagues. So, while the specific action of phishing is directed at a human (as, by definition, social attacks are), it often precedes or follows a mail server compromise. And there is no law that states that phishing cannot both precede and follow the access into the mail account (there are laws against phishing, however). Phishing is also a great way to deliver malicious payloads.
  • 42.
    42 2017 2018 12 14 33 36% 38 21 14 43% +27 +7 -20 +7 DIFF Credentials Bank Payment Personal Breaches Figure 50.Select data varieties in financial breaches over time n=144 (2017), n=125 (2018) Table 4 Top combinations of threat actions and assets, (n= 207) Action Asset Count Hacking - Use of stolen creds Server - Mail 43 Social - Phishing Server - Mail 41 Hacking - Use of backdoor or C2 User Dev - Desktop 17 Malware - C2 User Dev - Desktop 16 Physical - Skimmer Kiosk/Term - ATM 16 Misuse - Privilege abuse Server - Database 14 Hacking - Use of stolen creds Server - Web application 10 Social - Phishing User Dev - Desktop 10 Error - Misdelivery User Dev - Desktop 9 Malware - Backdoor User Dev - Desktop 9 End of an era? Physical attacks against ATMs have seen a decline from their heyday of the early 2010s. We are hopeful that the progress made in the implementation of EMV chips in debit cards, influenced by the liability shift to ATM owners, is one reason for this decline. ATM jackpotting is certainly an interesting way to make a buck, but is not a widespread phenomenon. Figure 50 highlights the drop in Payment card data compromise from last year’s report. While payment card breaches are declining, personal data is showing the largest gain from the 2018 report. Focusing on financial breaches where personal data was compromised, social attacks (Everything Else), misdelivery of data and misconfigurations (Miscellaneous Errors), Web Applications and Privilege Misuse are behind over 85 percent. Figure 50. Select data varieties in Financial breaches over time n=144 (2017), n=125 (2018)
  • 43.
    43 Things to consider: Doyour part 2FA everything. Use strong authentication on your customer- facing applications, any remote access, and any cloud-based email. Contrarians will be quick to point out examples of second authentication factors being compromised, but that does not excuse a lack of implementation. Squish the phish There is little that financial organizations can do to ensure that their customers are running up-to- date malware defenses or make them “phish-proof,” but spreading a little security awareness their way can’t hurt. And speaking of security awareness, leverage it to keep employees on their toes when interacting with emails. Inside job There were 45 confirmed breaches associated with misuse of privileges. The details were light on most of these but tried and true controls are still relevant. Monitor and log access to sensitive financial data (which we think you are already), and make it quite clear to staff that it is being done and just how good you are at recognizing fraudulent transactions. In other words, “Misuse doesn’t pay.”
  • 44.
    44 The doctor can’tsee you now (that you work for them) Most people do not enjoy going to the hospital, but once it becomes unavoidable we all need to believe fervently that the good women and men who are providing us care are just this side of perfect. Spoiler alert: they are not. Healthcare is not only fast paced and stressful, it is also a heavily-regulated industry. Those who work in this vertical need to do things right, do things fast, and remain in compliance with legislation such as HIPAA and HITECH (in the US). That in itself is a pretty tall order, but when one combines that with the fact that the most common threat actors in this industry are internal to the organization, it can paint a rather challenging picture. Healthcare stands out due to the majority of breaches being associated with internal actors. Denial of Service attacks are infrequent, but availability issues arise in the form of ransomware. Frequency Top 3 patterns Threat actors Actor motives Data compromised 466 incidents, 304 with confirmed data disclosure Miscellaneous Errors, Privilege Misuse and Web Applications represent 81% of incidents within Healthcare Internal (59%), External (42%), Partner (4%), and Multiple parties (3%) (breaches) Financial (83%), Fun (6%), Convenience (3%), Grudge (3%), and Espionage (2%) (breaches) Medical (72%), Personal (34%), Credentials (25%) (breaches) Healthcare With internal actors, the main problem is that they have already been granted access to your systems in order to do their jobs. One of the top pairings in Table 5 between actions and assets for Healthcare was privilege abuse (by internal actors) against databases. Effectively monitoring and flagging unusual and/or inappropriate access to data that is not necessary for valid business use or required for patient care is a matter of real concern for this vertical. Across all industries, internal actor breaches have been more difficult to detect, more often taking years to detect than do those breaches involving external actors. Mailing it in The Healthcare industry has a multifaceted problem with mail, in both electronic and printed form. The industry is not immune to the same illnesses we see in other verticals such as the very common scenario of phishing emails sent to dupe users into clicking and entering their email credentials on a phony site. The freshly stolen login information is then used to access the user’s cloud-based mail account, and any patient data that is chilling in the Inbox, or Sent Items, or other folder for that matter is considered compromised – and its disclosure time. Misdelivery, sending data to the wrong recipient, is another common threat action variety that plagues the Healthcare industry. It is the most common error type that leads to data breaches as shown in Figure 51. As seen in Table 5 on the next page, documents are a commonly compromised asset. This could be due to errors in mailing paperwork to the patient’s home address or by issuance of discharge papers or other medical records to the wrong recipient. Ransomware “breaches” Most ransomware incidents are not defined as breaches in this study due to their lack of the required confirmation of data loss. Unfortunately for them, Healthcare organizations are required to disclose ransomware attacks as though they
  • 45.
    45 Misconfiguration Loss Disposal error Publishing error Misdelivery Breaches Figure51. Top error varieties in Healthcare breaches (n=109) 0% 20% 40% 60% 80% 100% were confirmed breaches due to U.S. regulatory requirements. This compulsory action will influence the number of ransomware incidents associated with the Healthcare sector. Acknowledging the bias, this is the second straight year that ransomware incidents were over 70 percent of all malware outbreaks in this vertical. Things to consider: Easy access Know where your major data stores are, limit necessary access, and track all access attempts. Start with monitoring the users who have a lot of access that might not be necessary to perform their jobs, and make a goal of finding any unnecessary lookups. Snitches don’t get stitches Work on improving phishing reporting to more quickly respond to early clickers and prevent late clickers. Think about reward-based motivation if you can—you catch more flies with honey. And you can catch phish with flies. Coincidence? Perfectly imperfect Know which processes deliver, publish or dispose of personal or medical information and ensure they include checks so that one mistake doesn’t equate to one breach. Table 5 Top pairs of threat action varieties and asset varieties, (n= 304) Action Asset Count Hacking - Use of stolen creds Server - Mail 51 Misuse - Privilege abuse Server - Database 51 Social - Phishing Server - Mail 48 Error - Misdelivery Media - Documents 30 Physical - Theft Media - Documents 14 Error - Publishing error Server - Web application 13 Error - Disposal error Media - Documents 12 Error - Loss Media - Documents 12 Error - Misdelivery User Dev - Desktop 12 Hacking - Use of stolen creds Person - End-user 7
  • 46.
    46 The Information Society TheInformation industry is a veritable pantechnicon (look it up) that is chock-full of organizations that have to do with the creation, transmission and storing of information. One might think that with so wide an array of victims, the attacks would be all over the place, but, in fact, it is our duty to inform you that much of what we saw in this category for the 2019 report mirrors last year’s results. As was the case in 2018, most of the incidents in this industry consists of DoS attacks (63%). In fact, it is perhaps fitting that this industry covers both TV and motion pictures, since it is in many ways a rerun of last year’s programming when viewed from an incident point of view. Web applications are targeted with availability attacks as well as leveraged for access to cloud-based organizational email accounts. Frequency Top 3 patterns Threat actors Actor motives Data compromised 1,094 Incidents, 155 with confirmed data disclosure Miscellaneous Errors, Web Applications, and Cyber- Espionage represent 83% of breaches within Information External (56%), Internal (44%), Partner (2%) (breaches) Financial (67%), Espionage (29%) (breaches) Personal (47%), Credentials (34%), Secrets (22%) (breaches) Information Malfunction Omission Misdelivery Programming error Publishing error Misconfiguration Breaches Figure 52. Error varieties in Information breaches (n=66) 0% 20% 40% 60% 80% 100% With regard to confirmed data disclosure, two of the top three patterns remain the same as last year (albeit in a different order) and we have one newcomer. In order of frequency, the patterns are Miscellaneous Errors (42%), Web App attacks (29%) and Cyber-Espionage (13%). Let’s take a quick look at the most common errors below.
  • 47.
    47 Faulty towers No oneis perfect, but when you are a system administra- tor you are often provided with a better stage on which to showcase that imperfection. Figure 52 illustrates how errors are put in the spotlight. Our data indicates that misconfiguration (45%) and publishing errors (24%) are common miscues that allowed data disclosure to occur. When looking at the relationship between actions and assets in Table 6, 36% (24 of 67) of error-related breach- es involved misconfigurations on databases, often cloud storage – not good. Obviously, those buckets of data are meant to store lots of information and if your bucket has a (figurative) hole in it, then it may run completely dry before you make it back home from the well and notice. Often these servers are brought online in haste and configured to be open to the public, while storing non-public data. Publishing errors on web applications offer a similar exposure of data to a much wider than intended audience. Just for cmd shift and giggles, we will mention that programming errors were committed on web servers and a couple of databases. It’s not only Charlotte’s Web (apps) you can read about Even if your IT department doesn’t make big mistakes like the poor unfortunate souls above, there is no need to worry. You still have more excellent chances to get your data stolen. Criminals do love a tempting freshly baked (or half-baked) web application to attack. The illicit use (and reuse) of stolen creds is a common hacking action against web applications regardless of industry. The malware action variety of capture app data is more commonly associated with e-retailers, the application data being captured is the user inputting payment information. While not as common, any internet portals or membership sites that sell content as opposed to a physical product would fall into the Information sector. And payment cards used to purchase content are just as good to steal as ones used to buy shoes online. Table 6 Top pairs of threat action varieties and asset varieties, (n= 155) Action Asset Count Error - Misconfiguration Server - Database 24 Social - Phishing Person - Unknown 22 Hacking - Unknown Server - Web application 19 Malware - C2 User Dev - Desktop 16 Social - Phishing User Dev - Desktop 16 Malware - Backdoor Person - Unknown 15 Malware - Backdoor User Dev - Desktop 15 Malware - C2 Person - Unknown 15 Error - Publishing error Server - Web application 14 Hacking - Use of stolen creds Person - Unknown 14
  • 48.
    48 Things to consider: Assetassistance Whether intentional web attacks or erroneous actions, both databases and web application servers are oft-compromised assets, especially for this industry. Many will complain about”‘checklist security” but a standard protocol regarding bringing up cloud servers and publishing sensitive data on websites – if implemented and followed – would go a long way to mitigate human error/carelessness. Scrubbing packets While breaches were at the forefront of this section, DDoS protection is an essential control for Information entities given the percentage of Denial of Service incidents. Guard against non-malicious interruptions with continuous monitoring and capacity planning for traffic spikes. It bears repeating Knowledge is power, and the increase in state-affiliated attacks is a data point we will keep an eye on. It could very well be a spike and not indicative of a trend, but Information organizations have desirable data and these motivations would not be likely to disappear in a year. Understand that these attacks are often “phishy” in nature and start with a compromised workstation and escalate from there. I spy with my little eye, something phished The third pattern in Information breaches we highlight is Cyber-Espionage. An eye opening 36 percent of external attackers were of the state- affiliated variety, statistically even with organized crime. As we have pointed out many times in the past, most Cyber-Espionage attacks begin with a successful phishing campaign and that goes some way to explain why 84 perecent of social attacks in this industry featured phishing emails. Sir Francis Bacon once famously stated “knowledge is power.” Perhaps a better definition for 2019 would be “to gain and to control information is power.” Therefore, we should probably not be shocked that the organizations that own and distribute that information are the target of such attacks.
  • 49.
    49 Ethan Hunt15 have finallyrouted their respective nemeses for good? Are we free to buy the world a Coke and teach it to sing in perfect harmony? Probably not. A more likely explanation is that some of our partners who typically provide data around cyber-espionage were either unable to participate this year or simply happened to work other types of investigations. This may have contributed to a bias on those results, meaning the real percentage of cyber-espionage cases was higher in the wild. If the relative percentage of one type of case goes down, the result is an apparent upswing in the other. Lost and Stolen Assets Crimeware Everything Else Miscellaneous Errors Cyber-Espionage Privilege Misuse Web Applications Breaches Figure 53. Patterns in Manufacturing breaches (n=87) 0% 20% 40% 60% 80% 100% Frequency Top 3 patterns Threat actors Actor motives Data compromised Manufacturing 352 incidents, 87 with confirmed data disclosure Web Applications, Privilege Misuse, and Cyber-Espionage represent 71% of breaches External (75%), Internal (30%), Multiple parties (6%), Partner (1%) (breaches) Financial (68%), Espionage (27%), Grudge (3%), Fun (2%) (breaches) Credentials (49%), Internal (41%), Secrets (36%) (breaches) Uncle Owen, this R2 unit has a financial motivator For the second year in a row, financially motivated attacks outnumber cyber-espionage as the main reason for breaches in Manufacturing, and this year by a more significant percentage (40% difference). If this were in most any other vertical, it would not be worth mentioning as money is the reason for the vast majority of attacks. However, Manufacturing has experienced a higher level of espionage-related breaches than other verticals in the past few years. So, shall we conclude that James Bond and Manufacturing has been experiencing an increase in financially motivated breaches in the past couple of years, but espionage is still a strong motivator. Most breaches involve phishing and the use of stolen credentials. 15 Old-school readers, feel free to substitute Rollin Hand as the pop culture reference here if preferred.
  • 50.
    50 Desktop sharing software Desktopsharing VPN Backdoor or C2 Web application Breaches Figure 55. Hacking vectors in Manufacturing breaches (n=49) 0% 20% 40% 60% 80% 100% Speaking to the web application attacks, this industry shares the same burden of dealing with stolen web- mail credentials as other industries. Most breaches with a web application as a vector also featured a mail server as an affected asset. From an overall breach perspective, the use of stolen credentials and web applications were the most common hacking action and vector – see Figures 54 and 55. URL redirector abuse Path traversal Buffer overflow SQLi Other Brute force Abuse of functionality Use of backdoor or C2 Exploit vuln Use of stolen creds Breaches Figure 54. Hacking varieties in Manufacturing breaches (n=43) 0% 20% 40% 60% 80% 100%
  • 51.
    51 Secrets and truths TheCyber-Espionage pattern, while not as prominent as in past reports, is still an attack type that we recommend the Manufacturing industry defend against. The typical utilization of phishing attacks to convince users to install remote access tools that establish footholds and begin the journey towards stealing important competitive information from victims remains the same. In keeping with the aforementioned rise in financially motivated attacks, the primary perpetrator when known is organized crime. With regard to data variety, there is a group of four data types that feature prominently in this industry. Credentials (49%) and Internal data (41%), stem from the webmail attacks – if a more specific data type is not known, Internal is used for compromised organizational emails. Secrets (36%) drop from previous heights commensurate to the reduction in espionage as a motive. The fourth amigo is Personal information (25%), a data type that includes employee’s W-2 information and other nuggets that can be used for identity theft. Things to consider: Multiple factors work better than one It is a good idea to deploy multiple factor authentication throughout all systems that support it, and discourage password reuse. These actions will definitely help mitigate the impact of stolen credentials across the organization. Recycling also applies for security Regardless of motivation, a large number of breaches in this sector started with phishing or pretexting attacks. Providing employees with frequent security training opportunities can help reduce the likelihood they will be reeled in by one of those attacks. Workers must use safety equipment at all times Unless inconvenient to do so – due to the prevalence of malware usage in the espionage breaches, it is advisable to deploy and keep up-to-date solutions that can help detect and stop those threats.
  • 52.
    52 Frequency Top 3 patterns Threatactors Actor motives Data compromised Professional, Technical and Scientific Services 670 incidents, 157 with confirmed data disclosure Web Applications, Everything Else, and Miscellaneous Errors represent 81% of breaches within Professional Services External (77%), Internal (21%), Partner (5%), Multiple parties (3%) (breaches) Financial (88%), Espionage (14%), Convenience (2%) (breaches) Credentials (50%), Internal (50%), Personal (46%) (breaches) Wide range of services, narrower range of threats Professional Services is a broad category even by NAICS standards, and the members of its ranks include law offices, advertising agencies, and engineering and design firms, to name only a few. Starting with a focus on the data lost in the 157 Professional Services breaches, Figure 56 gives us an idea of the types of data most commonly involved in these cases. Phishing and credential theft associated with cloud- based mail accounts have risen as the prominent attack types. 2014 2018 54 23 19% 54 50 46% 0 +28 +27 DIFF Internal or Secrets Credentials Personal Breaches Figure 56. Top data varieties in professional service breaches over time, n=105 (2014), n=137 (2018) We see an overall increase in Personal data and Credentials breached. A lot of this comes from breaches now compromising multiple data types at the same time. Often, credentials are the key that opens the door for other actions. Figure 57 shows that most of the time, it’s on the way to compromise Internal and/or Personal data. This is indicative of gaining access to a user’s inbox via webmail login using stolen credentials. Figure 56. Top error varieties in Professional Services breaches over time, n=105 (2014), n=137 (2018)
  • 53.
    53 Integrity Confidentiality Availability Steps Action Error MalwareSocial Hacking Misuse Unknown Figure 59. Confidentiality attack chains for Professional Services incidents (n=90) Misuse and error are short paths while social and hacking take longer. 4 23 01 Executive staff compromised Use of stolen creds Finance staff compromised Pretexting Incidents Figure 58. Select enumerations in fraudulent transaction incidents (n=41) 0% 20% 40% 60% 80% 100% Sometimes you just have to ask Credentials compromising email...sounds a lot like Business Email Compromise doesn’t it? Figure 58 provides ample evidence that BECs are an issue for Professional Services. Financial staff were the most likely to be compromised in incidents involving fraudulent transactions, but it should be noted that executives were compromised in 20 percent of the incidentsand are 6x more likely to be the asset compromised in Professional Services breaches than the median industry. You have to hand it to the attackers. At some point one must have thought “why don’t we skip all the hard hacking and just, you know, ask for the money?” No other variety Personal Internal Breaches Figure 57. Other data varieties in Professional Services credential breaches (n=69) 0% 20% 40% 60% 80% 100% Paths of the unrighteous To wrap up, Figure 59 illustrates the single step Misuse and Error breaches, but also shows us the Social and Hacking breaches that take slightly longer to develop. All of it provides excellent immediate teaching mo- ments for any organization.
  • 54.
    54 Things to consider: Oneis the loneliest number We don’t like saying it any more than you like hearing it, but static credentials are the keys. Password managers and two-factor authentica- tion are the spool pins in the lock. Don’t forget to audit where all your doors are. It doesn’t help to put XO-9s on most of your entrances if you’ve got one in the back rocking a screen door. Social butterflies You know a great way to capture credentials? A social attack. At least we know where it’s coming from. Monitor email for links and executables (including macro-enabled Office docs). Give your team a way to report potential phishing or pretexting. To err is human Set your staff up for success. Monitor what processes access personal data and add in redundant controls so that a single mistake doesn’t result in a breach.
  • 55.
    55 Frequency Top 3 patterns Threatactors Actor motives Data compromised Given the sheer number of incidents in this sector, you would think that the government incident responders must either be cape and tights wearing super heroes, or so stressed they’re barely hanging on by their fingernails. And while that may yet be the case, keep in mind that we do have very good visibility into this industry, in part due to regulatory requirements that members (at least in the United States) must report their incidents to one of our data sharing partners (the US-CERT). Arguably more interesting is the fact that with similar breach numbers from last year’s report, the makeup of the breaches has seen some change. Master of whisperers While the Cyber-Espionage pattern was also the most prominent in this industry in last year’s report, the number of breaches in the Cyber-Espionage pattern is 168% of last year’s amount. Figure 60 shows how the percentages shifted from last year. Cyber-Espionage is rampant in the Public sector, with State-affiliated actors accounting for 79 percent of all breaches involving external actors. Privilege Misuse and Error by insiders account for 30 percent of breaches. 23,399 incidents, 330 with confirmed data disclosure Cyber-Espionage, Miscellaneous Errors and Privilege Misuse represent 72% of breaches External (75%), Internal (30%), Partner (1%), Multiple parties (6%) (breaches) Espionage (66%), Financial (29%), Other (2%) (breaches) Internal (68%), Personal (22%), Credentials (12%) (breaches) Public Administration The most common pairings of threat actions and assets in Table 7 tells a story that is as easy to follow as “See Spot Send Malicious Attachments and Gain a Foothold.” We have a gang of five threat actions found in breaches that had a human asset16 and a workstation as affected assets. We are seeing the familiar phish backdoor/C2 use of the newly acquired channel into the network. Admittedly we do not have as much data as to what is happening beyond the deception and initial device compromise. The inclusion of keylogging malware is a good indicator that additional credential theft and reuse is a likely next step. 2017 2018 16 16 17 17 25% 18 10 12 11 42% +1 -6 -5 -6 +17 DIFF Miscellaneous Errors Web Applications Privilege Misuse Everything Else Cyber-Espionage Breaches Figure 60. Patterns in public breaches over time n=305 (2017), n=330 (2018) 16 Person – Unknown was not filtered out due to the amount of phishing without a known organizational role associated with the target. Figure 60. Patterns in Public breaches over time n=305 (2017), n=330 (2018)
  • 56.
    56 Clicked Reported 0% 2% 5% 8% 10% Minute Hour DayWeek SimulatedPhishes Figure 61. Click and reporting rate in public simulated phishes over time I click, therefore I am Since we have established a bit of a problem with malicious emails, we wanted to dig more into the security awareness training data provided to us this year. Figure 61 shows how quickly employees in this sector are clicking or reporting on phishing emails. Early on in the training similar percentages of users are clicking and reporting, but reporting drops off after the first hour, where clicking is more active. Not optimal, but since this was sanctioned and not actually malicious, nothing was done after the initial reporting other than an “atta boy.” Having documented, understood, and tested incident response plans to the real thing will allow the containment process to begin during that first hour to limit the effectiveness and impact through quick identification. This should also limit the opportunity for the users who are not KonMari-ing their inboxes to interact with the malicious message days later. Table 7 Common threat action and asset combinations within Public breaches, (n=330) Action Asset Count Social - Phishing Person - Unknown 155 Social - Phishing User Dev - Desktop 139 Malware - Backdoor Person - Unknown 130 Malware - Backdoor User Dev - Desktop 129 Hacking - Use of backdoor or C2 Person - Unknown 119 Hacking - Use of backdoor or C2 User Dev - Desktop 119 Malware - C2 User Dev - Desktop 100 Malware - C2 Person - Unknown 99 Malware - Spyware/Keylogger User Dev - Desktop 82 Malware - Spyware/Keylogger Person - Unknown 81
  • 57.
    57 Weeks Days Months Years Breaches Figure 62. Time-to-discoveryin Public breaches (n=32) 0% 20% 40% 60% 80% 100% The wheels of government discover slowly When there is enough detail to derive breach timeline metrics, the data shows that breaches in the Public sector are taking months and years to be discovered. Public breaches are over 2.5 times more likely to be undiscovered for years. Espionage-related breaches typically do take longer to discover due to the lack of external fraud detection, but we did not have timeline data for those breaches. Privilege Misuse is the most common pattern within breaches that went undiscovered for months or more. Things to consider: Understand the human factor Not just from a phishing target standpoint. Errors in the forms of misdelivery and erroneous publishing of data rear their risky heads again. Insider misuse is also still a concern, so ensure efforts are taken to routinely assess user privileges. Limit the amount of damage an employee acting inappropriately or maliciously can do with existing privileges. Lookin’ out my backdoor While not as obvious as cartwheeling giants, validate there are controls in place to look for suspicious egress traffic that could be indicative of backdoor or C2 malware installation. The malware conundrum Large government entities with a massive community of end-points face a challenge in ensuring the breadth of up-to-date malware defenses are implemented. Smaller organizations may lack the budget for additional malware defenses other than desktop AV. Make friends with the desktop security folks and find out what their specific challenges are.
  • 58.
    58 20142018 0 0 0 1 3 5 6 10 13 63% 1 0 2 8 10 63 3 2 6 6% +1 0 +2 +7 +7 +58 -3 -7 -7 -57 DIFF Cyber- Espionage Denial of Service Lost and StolenAssets Miscellaneous Errors Privilege Misuse Web Applications Payment Card Skimmers Crimeware Everything Else Point of Sale Breaches Figure 63. Patterns in retail breaches over time n=145 (2014), n=139 (2018) Frequency Top 3 patterns Threat actors Actor motives Data compromised Retail 234 incidents, 139 with confirmed data disclosure Web Applications, Privilege Misuse, and Miscellaneous Errors represent 81% of breaches External (81%), Internal (19%) (breaches) Financial (97%), Fun (2%), Espionage (2%) (breaches) Payment (64%), Credentials (20%), Personal (16%) (breaches) Not such a POS anymore Let’s jump in our DBIR time machine and travel all the way back to four years ago. It was the second year that we featured the incident classification patterns and the top pattern for Retail was POS Intrusion, along with remote compromise of point of sale environments, with all of the malware and payment card exfiltration that comes with it. Coming back to the present year’s data set in Figure 63, the times they are a-changing. Card present breaches involving POS compromises or gas-pump skimmers continue to decline. Attacks against e-commerce payment applications are satisfying the financial motives of the threat actors targeting this industry. Figure 63. Patterns in Retail breaches over time n=145 (2014), n=139 (2018)
  • 59.
    59 Essentially, Web applicationattacks have punched the time clock and relieved POS Intrusion of their duties. This is not just a retail-specific phenomenon – Figure 64 comes courtesy of our friends at the National Cyber-Forensics and Training Alliance (NCFTA) and their tracking of card-present versus card-not-present fraud independent of victim industry. Card-present Card-not-present25% 50% 75% 2016 2017 2018 2019 Figure 64. Comparison of card-present vs. card-not-present fraud Table 8 Top action and asset variety combinations within Retail breaches, (n=139) The above shift certainly supports the reduction in POS breaches, and to a lesser extent, Payment Card Skimming. Pay at the pump terminals at gas stations would fall into the retail industry as well. We are cautiously optimistic that EMV has diminished the value proposition of card-present fraud for the cyber-criminals in our midst. Alas, it will still not make criminal elements eschew money and move to self-sustaining communes to lead simpler lives. One door closes, kick in another one Attacks against e-commerce web applications continue their renaissance. This is shown in Figure 64 on the left as well as Figure 26 back in the Results and Analysis section. To find out more about what tactics are used in attacks against payment applications we will go back to pairings of threat actions and affected assets. The general modus operandi can be gleaned from Table 8 below. Attacker compromises a web application and installs code into the payment application that will capture customer payment card details as they complete their purchases. Some breaches had details that specified a form-grabber which would be categorized under Spyware/Keylogger as it is another method of user input capture. Other times limited information was provided other than a statement Action Asset Count Malware - Capture app data Server - Web application 49 Malware - Spyware/Keylogger Server - Web application 39 Hacking - Exploit vuln Server - Web application 15 Hacking - RFI Server - Web application 11 Malware - Ram scraper Server - POS controller 8 Malware - Ram scraper User Dev - POS terminal 7 Hacking - Use of stolen creds Server - Database 6 Hacking - Use of stolen creds Server - Mail 6 Hacking - Use of stolen creds Server - Web application 6 Misuse - Privilege abuse Server - Database 5
  • 60.
    60 similar to “maliciouscode that harvested payment card data.” The more general functionality of capture app data was used in those instances. In reality there is likely little to no difference between the two pairings. We are also a little short on information on how the web application was compromised. If a specific method like RFI is noted, we collect it. Often it may be a general notation that a web vuln was exploited, hence the Exploit Vuln variety (new to the latest version of VERIS!). Looking at what we do know and channeling our inner William of Ockham, this general chain of events is likely: scan for specific web application vulnerabilities exploit and gain access drop malware harvest payment card data profit. We have seen webshell backdoors involved in between the initial hack and introduction of malware in prior breaches. While that action was not recorded in significant numbers in this data set, it is an additional breadcrumb to look for in detection efforts. In brief, vulnerable internet-facing e-commerce applications provide an avenue for efficient, auto- mated, and scalable attacks. And there are criminal groups that specialize in these types of attacks that feast on low-hanging fruit. Things to consider: Integrity is integral The web application compromises are no longer attacks against data at rest. Code is being injected to capture customer data as they enter it into web forms. Widespread implementation of file integrity software may not be a feasible undertaking. Adding this to your malware defenses on payment sites should be considered. This is, of course, in addition to patching OS, and payment application code. Brick and Mort(ar)y Continue to embrace technologies that make it harder for criminals to turn your POS terminals into machines of unspeakable doom. EMV, mobile wallets – any method that utilizes a one-time trans- action code as opposed to PAN is a good thing. Not just PCI Payment cards are not the only data variety that would be useful to the criminally-minded community. Rewards programs that can be leveraged for the “points” or for the personal information of your customer base are also potential targets.
  • 61.
    61 17 We do notassert that your decisions would differ wildly as we do not have sufficient data to support that statement. It is, admittedly, a surmise on our part but internal research remains ongoing. So, this concludes our 12th installment of this annual report. If the DBIR were a bottle of decent Scotch whiskey it would cost you around 100 bucks, instead of being free like this document. Likewise, the decisions you might make after finishing them would probably differ wildly as well.17 Nevertheless, we hope you gain a certain degree of enjoyment and enlightenment from both. On behalf of the team that labored to produce this document, we sincerely thank you, our readers, for your continued support and encouragement of this effort. We believe it to be of value to Information Security professionals and to industry at large, and we are grateful for the opportunity to bring it before you once again. As always, a tremendous thank you to our contributors who give of their time, effort, insight, and most importantly, their data. The task of creating this document is in no way trivial and we simply could not do it without their generosity of resources. We look forward to bringing you our 14th report (we are taking the high-rise hotel concept of enumeration here) next year, and in the meantime, may your security budgets be large and your attack surface small. Until then, feel free to reflect on the more noteworthy publicly disclosed security events in 2018 from the VTRAC before jumping into the Appendices. Wrap up
  • 62.
    62 January On the secondday of the year, the Verizon Threat Research Advisory Center (VTRAC) began to learn that researchers had discovered “Meltdown” and “Spectre,” new information disclosure vulnerabilities in most modern microprocessors. The vulnerabilities lie in foundational CPU architec- tures. Patching continued through 2018. We collected no reports of successful Meltdown or Spectre attacks in 2018. The first week of the month included the first report of malware attacks targeting the 2018 Winter Olympics in Pyeongchang, Republic of Korea. Investi- gative journalists reported India’s national ID database, “Aadhaar,” suffered a data breach affecting more than 1.2 billion Indian citizens. We began collecting reports of targeted attacks on Latin American banks. Attackers used disk wiping malware, probably to eliminate evidence of their actions and minimize the scale of the banks’ losses. On January 26th, we collected the first report of GandCrab ransomware. February The first “zero-day” in Adobe Flash kicked off February after APT37 embedded an exploit in Excel spread- sheets. The Punjab National Bank reported fraudulent transfers of ₹11,600 crore (USD 1.77 billion dollars). The Russian Central Bank reported “unsanctioned operations” caused the loss of ₽339 million (€4.8 million). “Olympic Destroyer” malware disrupted the opening cer- emony of the Pyeongchang Olympics but did not result in their cancellation. GitHub was hit with a new type of reflection denial of service attack leveraging mis- configured memcached servers. GitHub and other organizations endured 1.35-terabit-per-second junk traffic storms. March Intelligence for attacks on the Pyeongchang Olympics continued after the February 25th closing ceremonies. Operations Gold Dragon, HaoBao and Honeybee began as early as July 2017. In March, we collected intelligence on a full spectrum of APT-grade threat actors including APT28, menuPass (APT10), Patchwork, MuddyWater, OilRig, Lazarus and Cobalt. US-CERT published 15 files with intelligence on Russian actors attacking critical infrastructure in the USA. Malaysia’s Central Bank foiled an attack that involved falsified SWIFT wire-transfer requests. The Drupal project patched a remote code execution vulnerability reminiscent of the 2014 vulnerability that led to “Drupalgeddon.” April Attacks on “smart install” software in Cisco IOS switches by Russian threat actors were probably the most noteworthy InfoSec risk development in April. The VTRAC collected updated intelligence on the “Energetic Bear” Russian actor. A supply-chain attack on Latitude Technologies forced four natural-gas pipeline operators to temporarily shut down computer communications with their customers. Latitude supplies Electronic Data Interchange (EDI) services to the Energy and Oil verticals. March’s Drupal vulnerability did indeed attract cybercriminals. A variant of the Mirai IoT botnet began scanning for vulnerable Drupal servers and the subsequent compromises to install cryptomining software became known as Drupalgeddon2. The cyber-heist of US$150,000 in Ethereum from MyEtherWallet paled in significance to the BGP hijacking of the Internet’s infrastructure to do it. Year in review
  • 63.
    63 May Intelligence about the “DoubleKill” zero-day vulnerability in Internet Explorer was collected at the end of April. In May, the VTRAC collected intelligence of a malicious PDF docu- ment with two more zero-day vulnerabilities, one each in Adobe PDF Reader and in Windows. Microsoft and Adobe patched all three on May’s Patch Tuesday. A surge in GandCrab ransomware infections were the focus of several of the best intelligence collections in May. New intelligence collections documented the Cobalt threat actor’s phishing campaign was targeting the financial sector. Multiple sources reported VPNFilter malware had infected routers and network-attached storage (NAS) appliances. Control the router—control the traffic passing through it. June Multiple sources released updated intelligence on North Korean threat actors engaged in cyber-conflict and cybercrime operations. Adobe patched a new zero-day vulnerability in Flash. Like February’s, Flash zero-day, it was being used in malicious Excel files but the targets were in the Middle East. Two Canadian Imperial Bank of Commerce subsidiaries – BMO (Bank of Montreal) and Simplii Financial suffered a leak of about 90,000 customer records. They learned of the breach when threat actors demanded US$750,000 for the return of the records. The Lazarus threat actor stole roughly KR ₩35 billion (around $31 million) in cryptocurrency from the South Korea-based exchange Bithumb. DanaBot, a new banking Trojan was discovered targeting Commonwealth Bank in Australia. July The first major Magecart attack in 2018 was Ticketmaster’s UK branch. Hackers compromised Inbenta, a third-party functionality supplier. From Inbenta they placed digital skimmers on several Ticketmaster websites. The Ticketmaster attack was part of a campaign targeting third-party providers to perform widespread compromises of card data. July’s Magecart collections included indicators of compromise of over 800 victim websites. A malicious Mobile Device Management platform was used in highly targeted attacks on 13 iPhones and some Android and Windows platforms. Russia’s PIR Bank lost ₽58 million ($920,000) after the MoneyTaker actor compromised an outdated, unsupported Cisco router at a branch office and used it to pivot into the bank’s network. August The second Boundary Gateway Protocol (BGP) hijacking to steal cryptocurrency in 2018 redirected legitimate traffic from an Amazon DNS server. The malicious DNS server redirected users of MyEtherWallet to a spoofed site that harvested their credentials. Users of the service lost Ethereum worth about $152,000. Cosmos Bank in Pune, India, was the victim of US$13.4 million of fraudulent SWIFT and ATM transfers. The US Dept. of Justice announced the arrests of three managers from the FIN7 (Anunak, Carbanak, Carbon Spider) threat actor. Intelligence indicated a new vulnerability in Apache Struts, CVE-2018- 11776, was following the course set by March 2017’s CVE-2017-9805, the Jakarta multi-parser Struts vulnerability. The 2017 vulnerability led to the Equifax data breach. A detailed code reuse examination of malware linked to North Korea linked most malware attacks to the Lazarus Group. APT37 was linked to a small portion but was assessed to be more skilled and reserved for attacks with national strategic objectives.
  • 64.
    64 September New intelligence revealed Japanesecorporations were being targeted by the menuPass (APT10) threat actor. On September 6th, British Airways announced it had suffered a breach resulting in the theft of cus- tomer data. Within a week, we collected intelligence British Airways had become another victim of a Magecart attack. Intelligence indicated in the preceding 6 months, 7,339 E-commerce sites had hosted Magecart payment card skimming scripts includ- ing online retailer Newegg. Weaponized IQY (Excel Web Query) attachments were discovered attempting to evade detection to deliver payloads of FlawedAmmyy remote access Trojan (RAT). The FBI and DHS issued an alert about the Remote Desktop Protocol (RDP). The alert listed several threats that exploit RDP connections: Crysis (Dharma), Crypton and SamSam ransomware families. DanaBot expanded its target set to Italy, Germany and Austria. October The VTRAC assessed claims that Chinese actors had compromised the technology supply chain did not constitute intelligence. The related report lacked technical details or corroboration and was based on unqualified, unidentified sources. US-CERT issued an updated alert on attacks on MSS providers by the menuPass (APT10) threat actor. Multiple sources reported North Korean actors engaged cybercrime attacks intended to provide revenue to the sanction-constrained regime. GreyEnergy is the latest successor to the Sandworm/BlackEnergy/ Quedagh/Telebots threat actor. GreyEnergy was linked to attacks on the energy sector and other strategic targets in Ukraine and Poland for the past three years. DanaBot began targeting financial services establishments in the USA. The Magecart threat actors executed a scaled supply chain attack on Shopper Approved, a customer scoring plugin used by 7000+ e-commerce sites. Detailed reports in August and October indicated the Cobalt threat actor had reorganized into a group with journeymen and apprentice members and a second group of masters reserved for more sophisticated campaigns. November Intelligence based on examination of Magecart malware indicated there are at least six independent threat actors conducting Magecart attacks. The initial Magecart successes in late 2016 and high-profile attacks beginning with Ticketmaster UK/Inbenta in June led to a bandwagon effect. Other threat actors copied and improved upon the TTP of early Magecart threat actor(s). The SamSam ransomware attack came to a standstill after two Iranian hackers were indicted for US$6 million extortion. Cisco released an advisory due to “active exploitation” of a vulnerability in Cisco Adaptive Security Appliance Software (ASA) and Cisco Firepower Threat Defense Software that could allow an unauthenticated, remote attacker to cause a denial of service. US-CERT released Activity Alert AA18-284A, “Publicly Available Tools Seen in Cyber Incidents Worldwide,” on five tools threat actors had been using for their “Living off the Land” tactics. Marriott announced a 2014-18 breach had exposed the records of up to 500 million customers in its Starwood hotels reservation system. December VTRAC collections in December began with “Operation Poison Needles.” An unidentified actor exploited the third Adobe Flash zero-day vulnerability to attack Polyclinic of the Presidential Administration of Russia. “Operation Sharpshooter” was a global campaign targeting nuclear, defense, energy and financial companies. Oil and gas services contractor Saipem suffered an attack that employed a new variant of Shamoon disk-wiping malware. December’s Patch Tuesday fixed CVE-2018-8611, the latest Windows zero-day being exploited by the FruityArmor APT threat actor. Partly in reaction to the 77 percent plunge in Bitcoin, cyber- criminals did not abandon cryptomining altogether, instead, SamSam and GandCrab ransomware were being used to attack corporations, government agencies, universities and other large organizations. Criminals targeted larger purses: organizations likely to pay ransom in lieu of days of lost business and productivity recovering from backups, re-imaging or other BCP/DR measures. At the end of 2018 the VTRAC was running like a Formula 1 car finishing a mid-race lap: at full speed, staying ahead of some, striving to catch others and constantly improving our engineering.
  • 65.
    65 Appendix A: Transnational hackerdebriefs Over the past fifteen years, the United States Secret Service has successfully identified, located, and arrested numerous high-value cybercriminals. These individuals were responsible for some of the most significant and widely publicized data breaches of public and private industry networks. Over this period, the Secret Service’s Cyber Division has cultivated mutually beneficial partnerships with law enforcement agencies around the globe, which has extended the reach of the Secret Service’s investigative efforts far beyond its traditional limits. This network of collaborative partners has enabled the Secret Service to successfully extradite criminal suspects located overseas and have them face prosecution in the United States. The Secret Service continues to forge new international partnerships in furtherance of its mission to pursue and apprehend cybercriminals regardless of their geography. As part of its mandate to combat financially motivated cybercrime, the Secret Service combines its investigative efforts with educational outreach programs. These are aimed at strengthening the ability of private and public sector entities to protect themselves against a range of cybercrimes. The Secret Service conducts in-depth analyses of the activities, tools, and methodologies used by the cybercriminals during the commission of their crimes to better assess the evolving threats that cybercrimi- nals pose to financial institutions and other potential targets. The Secret Service then shares the results of these reviews with its network of public and private partners through its outreach programs. The Secret Service’s Cyber Division has learned that the most prescient information about cybercrime trends often comes from the cybercriminals themselves. The Secret Service conducts extensive debriefings of arrested cybercriminals and uses their first-hand knowledge to understand more fully the spectrum of variables they used to identify and select a particular target for intrusion and exploitation. The Secret Service has recently completed such debriefings with a handful of highly skilled cybercriminals who were responsible for some of the most significant network intrusions in history, and has found that the ways in which these individuals select their targets and perpetrate their crimes share certain common features. Insights into their target selection and tactics, techniques and procedures – Michael D’Ambrosio, Deputy Assistant Director, United States Secret Service
  • 66.
    66 Cybercriminals prey uponhuman error, IT security complacency, and technical deficiencies present in computer networks all over the world. Individually, each of these tactics, techniques and procedures (TTPs) discussed below are not always initially successful and may seem easily mitigated; it is when multiple TTPs are utilized in concert that cybercriminals are able to gain and maintain access to a computer network, no matter their motives. Once they are inside a network their process is almost always the same: establish continued access, escalate or obtain administrator privileges, move slowly and quietly to map the entire network, look for open ports, locate the “crown jewels,” and exfiltrate the data undetected for as long as possible. The selection of a target is a continual process. Cybercriminals do their research. Almost always during these interviews, the hackers referred to gathering valuable intelligence from the same cybersecurity blogs, online IT security publications, and vulnerability reports that network administrators should be monitoring. They know that once a vulnerability is revealed, they still have a limited amount of time to try to exploit that vulnerability at a potential victim organization. Every time a vulnerability is disclosed or a system update or patch is released, a hacker sees an opportunity. They research the disclosure or update notes to learn if they can exploit the vulner- ability and where, searching for their best opportunity to monetize the vulnerability. Hackers also communicate vulnerability information and exploit techniques on hacking forums. Once a target is selected, the hacker conducts thorough research into the victim organization and their network(s), often using free and commercially available Internet scanning tools that reveal extremely useful information about the victim company’s network. Webserver and/or webpage hacking has been a highly successful primary attack vector, as there are various potential avenues for exploitation. These include the main website of an institution or a less protected linked website, which in turn can provide access to the main network. The added use of Structured Query Language (SQL) database injections of malicious code has been a very effective attack vector because these types of intrusion techniques can be deployed at any access point of a website. There are additional webserver attack vectors such as overlooked or forgotten IP addresses, possibly from development or beta-testing and external webservers or data servers that share the same or common domain. Unmanaged servers that still utilize Unicode can be exploited via encoding the URL with certain characters to bypass application filters. Other traditional and effective attack vectors should not be overlooked. These include spear phishing for login credentials or malware delivery and “Man in the Middle” attacks through poorly secured routers or web gateways. Botnets are a relatively inexpensive tool that have been used to degrade or brute force attack networks in connection with parallel tactics. A very skilled hacker admitted to the Secret Service that he ended up paying a collusive employee (insider threat) when all of his other hacking attempts to access a foreign bank’s network were unsuccessful.
  • 67.
    67 Once inside anetwork, cybercriminals continue to do their research and reconnaissance. Hackers often examine a webserver’s default error pages because those pages expose a lot of the target network’s system information. Cybercriminals take all of network information they can collect and utilize virtual machines (VMs) to build a mock system to emulate the network of the victim company. This is done both for testing their methods of exploitation and for better understanding the types of network defenses present within the system. The exploits used by cybercriminals inside a target network depend on the installed network defenses. Undoubtedly, the hacker will try to install a web shell to ensure access into the system. Another sustainment method is the use of cross-site scripting (XSS) for session hijacking (cookie stealing) of a valid user through malicious code injections into a user’s JavaScript, ActiveX, Flash, or other code bank. The use of malware delivered to the valid user via spear phishing is a key component of this process. In addition, hackers utilize directory transversal attacks (directory climbing, back- tracking, etc.) on web servers to attempt to reach otherwise restricted directories, such as Secure Socket Layer (SSL) private keys and password files. Hackers can even execute commands on the server by accessing such directories. After administrator privileges are obtained, it is common for the prized data to be exfiltrated by tunneling via a remote access protocol. Cybercriminals will also scan for open ports and attempt to install software of their choosing on non-standard ports for a variety of malicious uses. If the targeted network has the potential to provide valuable data continuously, diligent hackers will continuously clean up their “tracks” within the exploited network to obfuscate their presence indefinitely. Another prominent hacker described having persistent access into a company’s networks for 10 years using multiple “backdoors” (web shells) and continually cleaning up his “work” to go undetected. In reality, many of the hackers we debriefed often stated that they could see traces of other hackers in the targeted network which sometimes made it harder to hide their hacking exploits. These are just some of the tactics, techniques and procedures the Secret Service has observed used by criminal groups to exploit victim networks. The threat is real and the adversary is constantly evolving, driven by diverse and varying motivations. Their success is more often dependent on how well network administrators can adapt their defenses to potential vulnerabilities as they are revealed. The Secret Service will continue to pursue, arrest, and prosecute cybercriminals no matter where they are and we will continue to provide valuable attack methodology analysis from our investigations to better improve the cybersecurity efforts of our partners in law enforcement, academia, and the public and private sectors alike.
  • 68.
    68 Appendix B: Methodology One ofthe things readers value most about this report is the level of rigor and integrity we employ when collecting, analyzing, and presenting data. Knowing our readership cares about such things and consumes this information with a keen eye helps keep us honest. Detailing our methods is an important part of that honesty. Our overall methodology remains intact and largely unchanged from previous years. All incidents included in this report were individually reviewed and converted (if necessary) into the VERIS framework to create a common, anonymous aggregate data set. If you are unfamiliar with the VERIS framework, it is short for Vocabulary for Event Recording and Incident Sharing, it is free to use, and links to VERIS resources are at the beginning of this report. The collection method and conversion techniques differed between contributors. In general, three basic methods (expounded below) were used to accomplish this: 1. Direct recording of paid external forensic investigations and related intelligence operations conducted by Verizon using the VERIS Webapp. 2. Direct recording by partners using VERIS. 3. Converting partners existing schema into VERIS. All contributors received instruction to omit any information that might identify organizations or individuals involved. Reviewed spreadsheets and VERIS Webapp JavaScript Object Notation (JSON) are ingested by an automated workflow that converts the incidents and breaches within into the VERIS JSON format as necessary, adds missing enumerations, and then validates the record against business logic and the VERIS schema. The automated workflow subsets the data and analyzes the results. Based on the results of this exploratory analysis, the validation logs from the workflow, and discussions with the partners providing the data, the data is cleaned and re-analyzed. This process runs nightly for roughly three months as data is collected and analyzed. Incident eligibility For a potential entry to be eligible for the incident/breach corpus, a couple of requirements must be met. The entry must be a confirmed security incident, defined as a loss of confidentiality, integrity, or availability. In addition to meeting the baseline definition of “security incident” the entry is assessed for quality. We create a subset of incidents (more on subsets later) that pass our quality filter. The details of what is a “quality” incident are:
  • 69.
    69 • The incident musthave at least seven enumerations (e.g., threat actor variety, threat action category, variety of integrity loss, et al.) across 34 fields OR be a DDoS attack. Exceptions are given to confirmed data breaches with less than seven enumerations. • The incident must have at least one known VERIS threat action category (hacking, malware, etc.) In addition to having the level of detail necessary to pass the quality filter, the incident must be within the timeframe of analysis, (November 1, 2017 to October 31, 2018 for this report). The 2018 caseload is the primary analytical focus of the report, but the entire range of data is referenced throughout, notably in trending graphs. We also exclude incidents and breaches affecting individuals that cannot be tied to an organizational attribute loss. If your friend’s personal laptop was hit with CryptoLocker it would not be included in this report. Lastly, for something to be eligible for inclusion into the DBIR, we have to know about it, which brings us to sample bias. Acknowledgement of sample bias We would like to reiterate that we make no claim that the findings of this report are representative of all data breaches in all organizations at all times. Even though the combined records from all our contributors more closely reflect reality than any of them in isolation, it is still a sample. And although we believe many of the findings presented in this report to be appropriate for generalization (and our confidence in this grows as we gather more data and compare it to that of others), bias undoubtedly exists. Unfortunately, we cannot measure exactly how much bias exists (i.e., in order to give a precise margin of error). We have no way of knowing what proportion of all data breaches are represented because we have no way of knowing the total number of data breaches across all organizations in 2018. Many breaches go unreported (though our sample does contain many of those). Many more are as yet unknown by the victim (and thereby unknown to us). While we believe many of the findings presented in this report to be appropriate, generalization, bias, and methodological flaws undoubtedly exist. However, with 73 contributing organizations this year, we’re aggregating across the different collection methods, priorities, and goals of our partners. We hope this aggregation will help minimize the influence of any individual shortcomings in each of the samples, and the whole of this research will be greater than the sum of its parts. Statistical analysis We strive for statistical correctness in the DBIR. In this year’s data sample, the confidence interval is at least +/- 2% for breaches and +/- 0.5%18 for incidents. Smaller samples of the data (such as breaches within the Espionage pattern) will be even wider as the size is smaller. We have tried to treat every statement within the DBIR as a hypothesis19 based on exploratory analysis and ensure that each statement is accurate at a given confidence level (normally 95%). We’ve tried to express this confidence in the conditional probability bar charts explained in the “tidbits” that precede the Table of Contents. 18 Bayes method, 95% confidence level. 19 If you wonder why we treat them as hypotheses rather than findings, to confirm or deny our hypothesis would requires a second, unique data set we had not inspected ahead of time.
  • 70.
    70 Our data isnon-exclusively multinomial meaning a single feature, such as “Action,” can have multiple values (i.e., “social,” “malware,” and “hacking”). This means that percentages do not necessarily add up to 100 percent. For example, if there are 5 botnet breaches, the sample size is 5. However, since each botnet used phishing, installed keyloggers, and used stolen credentials, there would be 5 social actions, 5 hacking actions, and 5 malware actions, adding up to 300 percent. This is normal, expected, and handled correctly in our analysis and tooling. Another important point is that, when looking at the findings, “unknown” is equivalent to “unmeasured.” Which is to say that if a record (or collection of records) contain ele- ments that have been marked as “unknown” (whether it is something as basic as the number of records involved in the incident, or as complex as what specific capabilities a piece of malware contained) it means that we cannot make statements about that particular element as it stands in the record—we cannot measure where we have too little information. Because they are “unmeasured,” they are not counted in sample sizes. The enumeration “Other” is, however, counted as it means the value was known but not part of VERIS. Finally, “Not Applicable” (normally “NA”) may be counted or not counted depending on the hypothesis. Data Subsets We already mentioned the subset of incidents that passed our quality requirements, but as part of our analysis there are other instances where we define subsets of data. These subsets consist of legitimate incidents that would eclipse smaller trends if left in. These are removed and analyzed separately (as called out in the relevant sections). This year we have two subsets of legitimate incidents that are not analyzed as part of the overall corpus: 1. We separately analyzed a subset of web servers that were identified as secondary targets (such as taking over a website to spread malware). 2. We separately analyze botnet-related incidents. Both subsets were separately analyzed last year as well. Finally, we create some subsets to help further our analysis. In particular, a single subset is used for all analysis within the DBIR unless otherwise stated. It includes only quality incidents as described above and the aforementioned two subsets. Non-incident data Since 2015, the DBIR includes data that requires the analysis that did not fit into our usual categories of “incident” or “breach.” Examples of non-incident data include malware, patching, phishing, DDoS, and other types of data. The sample sizes for non-incident data tend to be much larger than the incident data, but from fewer sources. We make every effort to normalize the data, (for example reporting on the median organization rather than the average of all data). We also attempt to combine multiple contibutors with similar data to conduct the analysis wherever possible. Once analysis is complete, we try to discuss our findings with the relevant contributor or contributors so as to validate it against their knowledge of the data.
  • 71.
    71 Last year inthe “Feeling vulnerable?” appendix, we discussed the services or weaknesses attackers look for in spray and pray internet scans, and how those aren’t necessarily the same things they look for in targeted attacks. In this section, we again examine what services are open to the internet and the adversary activity against them. At the risk of stating the obvious, what the attacker looks for tells you a great deal about what is of value to them. Any port in a storm Ports that offer at least some value to, and at the same time require the least amount of investment from the attacker garner a lot of attention. An economist might call the amount invested by the actor per attack the marginal cost. The very best attacks from the criminal’s point of view would cost almost nothing per target. We will refer to these as zero-marginal-cost attacks. 21 2223 25 53 80 123 137 161 389 443 445 500 1900 3389 5060 8000 8080 11211 1 10 20 30 40 50 Port rank in DDoS attacks Portrankinhoneypotevents Figure 65. Comparison of ports in DDoS and honeypot attacks 50 110203040 Appendix C: Watching the watchers
  • 72.
    72 Figure 65 illustratesthe ports that are in the top 50 for both honeypot activity and DDoS attacks (with “1” in the upper right being the most common and the rest decreasing from that point). We can consider how often attackers look for a given port as an indicator for how valuable they are to the attacker. Ports below the red line, such as cLDAP (389), DNS (53), and NTP (123) are more valuable due to their DDoS ampli- fication potential. The ports above the red line are more valuable for their non-DDoS malevolence including SSH (22), telnet (23), HTTP (8080), NetBIOS (445), and others. Portémon Go Probably the most effective way to judge perceived value for the attacker for a given port in zero-marginal-cost attacks is to examine their ranking in honeypot scans vs their general population ranking on the Internet. There are a myriad of organizations that scan the internet regularly, and there are a few of those who are gracious enough to contribute to the DBIR. As a result, we can share this data in Figure 66. Various (8888) cLDAP (389) Building Managment (47808) memcached (11211) MS SQL Server (1433) Netis Routers (53413) Various trojans (6969) NetBIOS (445) Dell Open Management (1311) telnet (23) 0x 5x 10x 15x Ratio of honeypot events rank to internet scans rank Port Figure 66. Ports scanned for more often than they exist Figure 66. Ports scanned for more often than they exist
  • 73.
    73 Figure 66 liststhe top 10 ports by ratio of honeypot activity to internet prevelance.20 Some of these, for example, Telnet, NetBIOS, and SQL Server – legacy services with known weaknesses that are old enough to vote – may not be as common as dirt, but they still exist and when an attacker finds them you can almost hear the intro to Pink Floyd’s “Money” floating in the ether. If your organization has any of these services exposed to the internet, it’s probably a good idea to go and take care of that now. We’ll wait here. Take your time. This report changes once a year, but those ports are being hammered daily. Dime a dozen The above section begs the question, “If those ports are what attackers frequently search for but rarely find, which open ports are plentiful but rarely sought?” We are glad you asked. For the most part they are unassigned or ephemeral ports. Of more interest are the ports that appear in vulnerability scans, but do not show up in honey- pots. Figure 67 gives us some insight into that area. The main takeaway is that there are a lot of ports far down on the list from a honeypot perspective (the big cluster in the lower left of the figure) that get reported often in vulnerability scans. Those are the vulnerabilities that may be useful for attackers but either only for niche attacks or internal pivoting, or are of absolutely no interest whatsoever to the attacker. 20 For example, if a port was the top ranked port in honeypot scans and the 15th most common on the internet, its ratio would be 15x.
  • 74.
    74 Take action There mayonly be seven seas, but there are 65,535 ports. While not all are found in the figures above, a great many are. So now what? We suggest you take a look to ascertain if you are vulnerable to any zero-marginal-cost attacks (easily identified by their honeypot to internet scan ratio). If so, you are operating below a critical security threshold and you need to take action to get above it. Are you running a honeypot yourself? If not, why is that port open? Finally, take a cue from the Unbroken Chains section and be smart about what else you mitigate. Understand the paths attackers are most likely to take in order to exploit those services. 443 3389 445 1433 80 22 0 123 2381 8443 161 500 636 5989 8080 8081 23 25 3269 8089 8880 1311 21 9443 5061 81 53 6701 8082 389 143 3071 587 10000 9043 623 993 5556 995 5000 7002 110 8444 9090 8445 5480 8000 1521 5353 7004 10 100 1,000 10,000 10100 Vulnerability scans port rank (log scale) Honeypoteventsportrank(logscale) Figure 67. Comparison of ports in vulnerability scans and honeypot events Figure 67. Comparison of ports in vulnerability scans and honeypot events
  • 75.
  • 76.
    76 Security Awareness Training PMS:COOL GREY 11 C CMYK: 0, 0, 0, 86 PMS: 200 C CMYK: 0, 100, 100, 25
  • 77.
    77 A Akamai Technologies Apura CyberIntelligence AttackIQ Avant Research Group, LLC B BeyondTrust BinaryEdge BitSight Bit-x-bit C Center for Internet Security CERT Insider Threat Center CERT European Union Checkpoint Software Technologies Ltd Chubb Cisco Security Services Computer Incident Response Center Luxembourg (CIRCL) CrowdStrike Cybercrime Central Unit of the Guardia Civil (Spain) CyberSecurity Malaysia, an agency under the Ministry of Science, Technology and Innovation (MOSTI) Cylance D Dell DFDR Forensics Digital Edge Digital Shadows Dragos, Inc E Edgescan Emergence Insurance F Federal Bureau of Investigations Internet Crime Complaint Center (FBI IC3) Fortinet G Gillware Digital Forensics Government of Telangana, ITEC Dept., Secretariat GRA Quantum GreyNoise Intelligence I Interset Irish Reporting and Information Security Services (IRISS-CERT) J JPCERT/CC K Kaspersky Lab KnowBe4 L Lares Consulting LIFARS M Malicious Streams McAfee Mishcon de Reya Moss Adams (formerly ASTECH consulting) MWR InfoSecurity N National Cyber-Forensics and Training Alliance (NCFTA) NetDiligence NETSCOUT P Paladion Palo Alto Networks Proofpoint Q Qualys R Rapid7 Recorded Future S S21sec Shodan Social-Engineer, Inc. SwissCom T Tripwire U US Secret Service US Computer Emergency Readiness Team (US-CERT) V VERIS Community Database Verizon Cyber Risk Programs Verizon Digital Media Services Verizon DOS Defense Verizon Managed Security Services Verizon Network Operations and Engineering Verizon Professional Services Verizon Threat Research Advisory Center Vestige Ltd W Wandera West Monroe Partners Winston Strawn LLP Z Zscaler
  • 78.
    © 2019 Verizon.All rights reserved. The Verizon name and logo and all other names, logos and slogans identifying Verizon’s products and services are trademarks and service marks or registered trademarks and service marks of Verizon Trademark Services LLC or its affiliates in the United States and/or other countries. All other trademarks and service marks are the property of their respective owners. 05/19 2019 Data Breach Investigations Report