SlideShare a Scribd company logo
1 of 85
Download to read offline
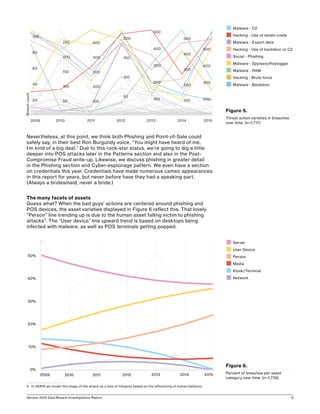
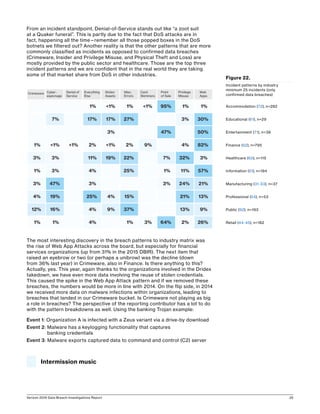
2016 Data
Breach
Investigations
Report
89% of breaches had a
financial or espionage motive.
Verizon 2016 Data Breach Investigations Report i
2016 DBIR Contributors
(See Appendix B for a detailed list.)
Verizon 2016 Data Breach Investigations Report ii
Verizon 2016 Data Breach Investigations Report iii
Table of Contents
2016 DBIR—Introduction............................................................................................................. 1
Victim demographics....................................................................................................................3
Breach trends................................................................................................................................ 6
Points of focus.............................................................................................................................12
Vulnerabilities...............................................................................................................................13
Phishing.......................................................................................................................................... 17
Credentials...................................................................................................................................20
Incident classification patterns.............................................................................................. 22
Web App Attacks.............................................................................................................. 27
Point-of-Sale Intrusions..................................................................................................31
Insider and Privilege Misuse.........................................................................................35
Miscellaneous Errors......................................................................................................40
Physical Theft and Loss.................................................................................................43
Crimeware..........................................................................................................................45
Payment Card Skimmers................................................................................................49
Cyber-espionage.............................................................................................................. 52
Denial-of-Service Attacks.............................................................................................56
Everything Else.................................................................................................................60
Wrap up......................................................................................................................................... 62
Varieties of impact.....................................................................................................................64
Appendix A: Post-compromise fraud ..................................................................................66
Appendix B: Contributing organizations..............................................................................71
Appendix C: The Taupe Book................................................................................................. 72
Appendix D: Attack graphs.......................................................................................................74
Appendix E: Methodology and VERIS resources.............................................................. 76
Appendix F: Year in review...................................................................................................... 78
Verizon 2016 Data Breach Investigations Report 1
Well here we are again, and it is time to take the annual journey into our
collection of real-world data breaches and information security incidents from
the prior year. We have published this report nine times1
and we truly appreciate
you spending your valuable time with us, whether you have been with us since
our humble, pie-chart-centric beginnings or if this is your first read.
We would be remiss if we did not begin by acknowledging the organizations
that contributed data (and time) to this publication. Simply stated, we thank you
for helping to make this possible. For a full list of contributors, mosey over to
Appendix B.
The incident data is the workhorse of this report and is used to build out all
the information within the Breach Trends and Incident Classification Patterns
sections. We use non-incident security data to paint a fuller picture in the
patterns as well as in stand-alone research. Any opportunity to take several
organizations’ data and combine them for a research topic was pursued. The
Gestalt principles in action!
The nine incident classification patterns we identified back in the 2014 report
still reign supreme. And while there are no drastic shifts that have established
a show-stopping talking point when looking at the patterns as a whole, we have
searched for interesting tidbits in the actions that comprise them.
This year’s dataset is made up of over 100,000 incidents, of which 3,141 were
confirmed data breaches. Of these, 64,199 incidents and 2,260 breaches
comprise the finalized dataset that was used in the analysis and figures
throughout the report. We address the reasons for culling the dataset in
Victim Demographics and provide additional details when we discuss motives
in Breach Trends. Of course, we would never suggest that every last security
event of 2015 is in this report. We acknowledge sample bias, and provide
information about our methodology as well as links to resources that we
encourage you to look into to help collect and analyze incident data within your
own organization, in Appendix E.
We will also acknowledge what isn’t in this report. For those looking for
proclamations about this being the year that mobile attacks bring us to
our knees or that the Internet of Things (IoT) is coming to kill us all, you will
be disappointed. We still do not have significant real-world data on these
1	 Nine times? Nine times.
2016 DBIR—Introduction
“It’s like déjà vu, all over again.”
—Yogi Berra
The nine incident
classification
patterns we
identified in 2014
still reign supreme.
Verizon 2016 Data Breach Investigations Report 2
technologies as the vector of attack on organizations.2
If you feel we are in
error, put down the torches and pitchforks and share any breach data that you
have. We are always looking for avenues to shine lights into areas in which we
may not have sufficient illumination. Also, their absence is not a suggestion to
ignore these areas in your risk management decision-making.
The report is designed so you can enjoy it like a prog-rock concept album, from
beginning to end, or feel free to bounce around (the room). Enjoy the Breach
Trends section for all your figure and chart needs. Get some knowledge on a
few of the concepts that stretch across several patterns in our Points of Focus
section and for those who want more factoids, pop over to the appendices and
give our Taupe Book section a look.
2	 Yes, we are aware of the xCode hack, but without confirmed organizations that suffered an attribute
loss it will not be an influencer of this report.
Verizon 2016 Data Breach Investigations Report 3
Before we get into the adversaries behind the incidents and breaches
that both underpin this report and keep information security professionals
busy, let’s acknowledge who is on the receiving end of these attacks.
The 2016 report features incidents affecting organizations in 82
countries and across a myriad of industries.
No locale, industry or organization is bulletproof when it comes to the
compromise of data. Some are notably more represented than others and this
is not an indictment that the public sector is any less secure than any other
industry. As with prior years, the numbers that follow are heavily influenced
by US agency reporting requirements, which open up the fire hose of minor
security incidents. Tables 1 and 2 show the number of incidents and breaches
by victim industry and size. You may have noticed that the totals in Tables 1 and
2 feature fewer incidents and breaches than the previously advertised 100,000
and 3,141. None are typos—there are a couple of filters applied to the original
total. We excluded incidents involving devices repurposed as infrastructure to
be used against another target (more on this in the Secondary Motive sidebar
in Breach Trends). We also had numerous incidents that failed the “You must be
this detailed to enjoy this ride” test.3
3	 Complexity and completeness scoring is discussed in Appendix E: Methodology and VERIS resources.
Victim demographics
Figure 1.
Countries represented in
combined caseload.
No locale, industry
or organization is
bulletproof when
it comes to the
compromise of data.
Verizon 2016 Data Breach Investigations Report 4
When we zoom in on just confirmed breaches, the numbers are less
astronomical and we see industries such as Accommodation and Retail
accounting for a more significant percentage of breaches (as opposed to
incidents). This is unsurprising as they process information which is highly
desirable to financially motivated criminals.
Industry Total Small Large Unknown
Accommodation (72) 362 140 79 143
Administrative (56) 44 6 3 35
Agriculture (11) 4 1 0 3
Construction (23) 9 0 4 5
Educational (61) 254 16 29 209
Entertainment (71) 2,707 18 1 2,688
Finance (52) 1,368 29 131 1,208
Healthcare (62) 166 21 25 120
Information (51) 1,028 18 38 972
Management (55) 1 0 1 0
Manufacturing (31-33) 171 7 61 103
Mining (21) 11 1 7 3
Other Services (81) 17 5 3 9
Professional (54) 916 24 9 883
Public (92) 47,237 6 46,973 258
Real Estate (53) 11 3 4 4
Retail (44-45) 159 102 20 37
Trade (42) 15 3 7 5
Transportation (48-49) 31 1 6 24
Utilities (22) 24 0 3 21
Unknown 9,453 113 1 9,339
Total 64,199 521 47,408 16,270 Table 1.
Number of security incidents by
victim industry and organization size,
2015 dataset.
Verizon 2016 Data Breach Investigations Report 5
Industry Total Small Large Unknown
Accommodation (72) 282 136 10 136
Administrative (56) 18 6 2 10
Agriculture (11) 1 0 0 1
Construction (23) 4 0 1 3
Educational (61) 29 3 8 18
Entertainment (71) 38 18 1 19
Finance (52) 795 14 94 687
Healthcare (62) 115 18 20 77
Information (51) 194 12 12 170
Management (55) 0 0 0 0
Manufacturing (31-33) 37 5 11 21
Mining (21) 7 0 6 1
Other Services (81) 11 5 2 4
Professional (54) 53 10 4 39
Public (92) 193 4 122 67
Real Estate (53) 5 3 0 2
Retail (44-45) 137 96 12 29
Trade (42) 4 2 2 0
Transportation (48-49) 15 1 3 11
Utilities (22) 7 0 0 7
Unknown 270 109 0 161
Total 2,260 447 312 1501
Small = organizations with fewer than 1,000 employees, Large = organizations
with 1,001+ employees.
Table 2.
Number of security incidents with
confirmed data loss by victim industry
and organization size, 2015 dataset.
Breaches vs. Incidents
This report uses the following definitions:
Incident: A security event that compromises the integrity,
confidentiality or availability of an information asset.
Breach: An incident that results in the confirmed disclosure (not just
potential exposure) of data to an unauthorized party.
Verizon 2016 Data Breach Investigations Report 6
Breach trends
Playing a part on the blue team in information security can, to a very small
degree, be compared to the lot of a hapless soldier. The soldier is told to guard
a certain hill and to keep it at all costs. However, he is not told who his enemy
may be, what they look like, where they are coming from, or when (or how) they
are likely to strike. To ride this analogous horse a bit further, the soldier is given
a hand-me-down rifle with only a few rounds of ammunition to fulfill his task. It
seems a bit unfair really—even the American Revolution got Paul Revere.
With that in mind, we hope that this section and the facts and figures contained
in it will go some way toward making you better prepared than our friend
mentioned above. After all, “forewarned is forearmed.”
A brief primer on VERIS
This section, and many that follow, are based on the Vocabulary for
Event Recording and Incident Sharing, or VERIS for short. VERIS is
a framework to record and share your security events, incidents and
breaches in a repeatable manner. It asks the question, what threat
Actor took what Action on what Asset compromising what Attribute?
We commonly refer to those as the 4As. In addition to the 4As, it
captures timeline, victim demographics, discovery method, impact
data and much more.
There are a lot of tools available for VERIS. Methods for creating,
importing and analyzing the data are all freely available. More on that
in Appendix E: Methodology and VERIS resources.
Be prepared:
forewarned is
forearmed.
Verizon 2016 Data Breach Investigations Report 7
Figure 2.
Percent of breaches per threat actor
category over time, (n=8,158)
Figure 3.
Percent of breaches per threat actor
motive over time, (n=6,762)
For those who have read the DBIR before, Figure 2 will come as no surprise.
Again, the Actors in breaches are predominantly external. While this goes
against InfoSec folklore, the story the data consistently tells is that, when it
comes to data disclosure, the attacker is not coming from inside the house. And
let’s face it, no matter how big your house may be there are more folks outside
it than there are inside it.
Why are these people attacking me?
So why do the Actors do what they do? Money, loot, cash, filthy lucre,
greed … get the idea? In fact, it can be money even when it’s not money
(see Secondary Motive sidebar for more). In the 2013 DBIR it appeared that
perhaps the reigning lothario of “financial gain” was in danger of being cast
aside in favor of “espionage.” Could such a thing come to pass? No, not really.
2010 2011 2012 2013 2014 2015
0%
20%
40%
60%
80%
100%
25%
50%
75%
100%
2009 2010 2011 2012 2013 2014 2015
n Financial
n Espionage
n Fun
n Ideology
n Grudge
n Everything Else
n Partner
n Internal
n Collusion
n External
Verizon 2016 Data Breach Investigations Report 8
There was never any real danger of the financial motive losing its prominence,
as even at its peak, espionage remained a far distant second. As illustrated
by Figure 3, breaches with a financial motive dominate everything else,
including espionage and fun.
Pistols at dawn, or knives at noon?
Now that we know at least a very little bit more about who’s coming after us,
the next logical question is: how are they armed? As a glance at Figures 4
and 5 can show you, it is often with phishing, which leads to other events that
are not going to make your day. We also see the calling card of Point-of-Sale
(POS) attacks. No need to go get in the weeds on this here, as these topics will
reappear quite a bit in the pages to follow.
Now, to be fair to the other hardworking threat action types in our list, phishing
(and the higher level threat action category of Social) was given a leg up this
year by the ‘Dridex’ campaign. We had several contributors who combined to
provide a great amount of insight into that naughtiness and this skewed the
results somewhat.
Figure 4.
Number of breaches per threat action
category over time, (n=9,009)
Secondary motive
Many of the attacks discussed in this report have what we call a
‘secondary motive’, which we define as when the motive of the incident
is to ‘aid in a different attack’. We filter these out of the report because
it would overshadow everything else if we didn’t. One example is where
the bad guy compromises a web server to repurpose it to his own uses
(e.g., hosting malicious files or using it in a spam or DoS botnet). Even
criminals need infrastructure. “It is a far, far better thing” that someone
else manages it for free, rather than having to pay for it yourself. We
had thousands of these incidents, as well as poorly configured NTP
and DNS servers, leveraged to launch reflective DoS attacks.
0
500
1,000
1,500
2005 2007 2009 2011 2013 2015
Breachcount
n Hacking
n Malware
n Social
n Error
n Misuse
n Physical
n Environmental
Verizon 2016 Data Breach Investigations Report 9
Nevertheless, at this point, we think both Phishing and Point-of-Sale could
safely say, in their best Ron Burgundy voice, “You might have heard of me,
I’m kind of a big deal.” Due to this rock-star status, we’re going to dig a little
deeper into POS attacks later in the Patterns section and also in the Post-
Compromise Fraud write-up. Likewise, we discuss phishing in greater detail
in the Phishing section and Cyber-espionage pattern. We even have a section
on credentials this year. Credentials have made numerous cameo appearances
in this report for years, but never before have they had a speaking part.
(Always a bridesmaid, never a bride.)
The many facets of assets
Guess what? When the bad guys’ actions are centered around phishing and
POS devices, the asset varieties displayed in Figure 6 reflect this. That lovely
“Person” line trending up is due to the human asset falling victim to phishing
attacks4
. The “User device” line upward trend is based on desktops being
infected with malware, as well as POS terminals getting popped.
4	 In VERIS we model this stage of the attack as a loss of Integrity based on the influencing of human behavior.
Figure 5.
Threat action varieties in breaches
over time, (n=7,717)
2009 2012 2015
Breachcount
2010 2011 2013 2014
- 20
- 40
- 60
- 80
- 100
- 50
- 100
- 150
- 200
- 250
- 100
- 200
- 300
- 400
- 500
- 50
- 100
- 150
- 200
- 100
- 200
- 300
- 400
- 500
- 100
- 200
- 300
- 400
- 500
200 -
400 -
600 -
800 -
n Malware - C2
n Hacking - Use of stolen creds
n Malware - Export data
n Hacking - Use of backdoor or C2
n Social - Phishing
n Malware - Spyware/Keylogger
n Malware - RAM
n Hacking - Brute force
n Malware - Backdoor
0%
10%
20%
30%
40%
50%
2009 20122010 2011 2013 2014 2015
Figure 6.
Percent of breaches per asset
category over time, (n=7,736)
n Server
n User Device
n Person
n Media
n Kiosk/Terminal
n Network
Verizon 2016 Data Breach Investigations Report 10
Mick was wrong—time is not on our side.
Rome wasn’t built in a day, but data breaches frequently were. Figure 7
illustrates how quickly the threat Actor gets in and out of your network. The
large spikes, however, are driven by very specific threats. The compromise
time of minutes, while depressing to look at, is actually another reflection of
the ubiquitous ‘Dridex’ breaches in this year’s dataset. As previously alluded
to, these cases begin with a phish, featuring an attachment whose mission in
its malware life is to steal credentials. If you have legit creds, it doesn’t take
a very long time to unlock the door, walk in and help yourself to what’s in the
fridge. Conversely, the exfiltration time being so weighted in the ‘days’ category
is heavily representative of attacks against POS devices where malware is
dropped to capture, package and execute scheduled exports.
Bad news travels fast, with one exception.
We like this next graph—one line goes one way and the other line goes the
other way. Actually we would like it even more if the lines took different paths.
The bad news is, the detection deficit in Figure 8 is getting worse.
Figure 7.
Time to compromise and exfiltration.
<1%6%
81.9%
<1%
11%
<1%
67.8%
2.5%
21.2%
<1%
7.1%
<1%
compromisen=1,177exfiltrationn=326
Seconds Minutes Hours Days Weeks Months Years
0%
25%
50%
75%
100%
%where“daysorless”
67% 56% 55% 61% 67% 62% 67% 89% 62% 76% 62% 84%
2005 2007 2009 2011 2013 2015
Figure 8.
Percent of breaches where time
to compromise (green)/time to
discovery (blue) was days or less
n Time to Compromise
n Time to Discover
Verizon 2016 Data Breach Investigations Report 11
In the 2015 report, we mentioned that there was some improvement in discovery
in the ‘days or less’ category, however, that improvement was short-lived. We
also pointed out that we would need more than one year’s data to verify that
as a definite trend and sadly we did not get that verification. Moreover, readers
with excellent memories will notice that the deficit in 2014 grew from last year’s
report. Data for the year-to-year graphs is filtered by incident year (i.e., when
the compromise occurred). We continue to add incidents and breaches to prior
calendar years post-report to enrich our data. Also, some breaches will occur
late in the year and are discovered the next year.
To add another ray to this sunbeam, attackers are getting even quicker at
compromising their victims. When you review the leading threat actions again,
this really won’t come as a surprise. The phishing scenario is going to work
quickly, with the dropping of malware via malicious attachments occurring
within seconds. Physical compromises of ATMs and gas pumps also happen
in seconds. In the majority of confirmed data breaches, the modus operandi of
nation-states as well as financially motivated attackers is to establish control
via malware and, when successful, it is lightning fast. As this figure is for
confirmed breaches only, it makes sense that the time to compromise is almost
always days or less (if not minutes or less). If—and some have called “if” the
biggest word in the language—there’s any good news, it’s that the number of
breaches staying open months or more continues to decline slightly.
When it comes to external5
breach discovery, fraud detection and law
enforcement notification are battling it out like the Celtics and Lakers in
the ‘80s. Figure 9 shows that law enforcement will raise the banner for
2015, due (again) to a botnet takedown and the subsequent notifications
to members of the botnet. All in all, external notification is up. And when
you have to wait on external detection to tell you you’re popped, it’s
probably too late to keep the horses in the barn.
5	 External is everything but internal detection and when a partner supplies a monitoring or AV service.
The time to
compromise is
almost always
days or less, if not
minutes or less.
0%
20%
40%
60%
80%
2005 2007 2009 2011 2013 2015
Figure 9.
Breach discovery methods over time,
(n=6,133).
n Law Enforcement
n Fraud Detection
n Third Party
n Internal
Verizon 2016 Data Breach Investigations Report 12
One last thing before we get to the patterns. There are a couple of topics that
are omnipresent in many of the patterns that we use to classify incidents. While
they will receive credit where credit is due, in the pattern sections, we feel that
we also need to put the spotlight on them here.
We have numerous breaches where we can infer that some Common
Vulnerabilities and Exposures (CVE) were used in order for the attack to
advance. Hey, we’re looking at you, drive-by downloads! Unfortunately, we don’t
have a tremendous amount of CVE data in our corpus, either because it was
not measured or was unable to be identified. This lack of detail makes us an
embarrassment of sad pandas. (Yes, we wanted to say “sleuth”, but apparently
we can’t. Look it up.) Luckily we have contributors in the vulnerability space that
can lighten our mood.
Phishing has continued to trend upward (like spawning salmon?) and is found
in the most opportunistic attacks as well as the sophisticated nation state
tomfoolery. We feature a section where we dive into the human element a bit
deeper, with some data on our innate need to click stuff.
Lastly, we strike a deceased equine a bit more with a section on
credentials (of the static variety). Don’t get us wrong—passwords are
great, kind of like salt. Wonderful as an addition to something else,
but you wouldn’t consume it on its own.
Points of focus
We don’t have a
tremendous amount
of CVE data because
it wasn’t measured
or was unable to be
identified.
Verizon 2016 Data Breach Investigations Report 13
Methodology
The visualizations and statements regarding rates of exploitation in this section
are underpinned by vulnerability exploitation data provided by Kenna Security.
This dataset spans millions of successful real-world exploitations, and is
derived from hunting down exploitation signatures in security information and
event management (SIEM) logs and correlating those with vulnerability scan
data to find pairings that would be indicative of a successful exploitation.
The tortoise and the hare
Vulnerability management has been a Sisyphean endeavor for decades. Attacks
come in millions, exploits are automated and every enterprise is subject to the
wrath of the quick-to-catch-on hacker. What’s worse, new vulnerabilities come
out every day. Since the first DBIR, we’ve been advocating the turtle’s approach
to vulnerability management (slow and steady wins the race).
This year we revisit this data to see whether the trends hold, but in typical DBIR
fashion, we dig a little deeper, to look at not just how attackers are interacting
with vulnerabilities (exploitation), but also how well and how fast enterprises are
executing remediation. If we can measure both of these routinely, then we can
provide much-needed answers about how the tortoise won the race—and so
learn how to close the gap between attackers and enterprises.
Vulnerabilities
New vulnerabilities
come out every day.
At a glance
Description
A look into software vulnerabilities, whether we are
making any progress in addressing them and ways
to improve.
Contributors
Kenna Security (formerly Risk I/O) collaborated
with us again to leverage their vulnerability and
exploitation data. We also utilized vulnerability
scan data provided by Beyond Trust, Qualys and
Tripwire in support of this section.
Key findings
Older vulnerabilities are still heavily targeted;
a methodical patch approach that emphasizes
consistency and coverage is more important
than expedient patching.
Verizon 2016 Data Breach Investigations Report 14
Slow and steady—but how slow?
This year we take a different approach to measuring the time from publication
to exploitation. Figure 10 is a box plot, which plots the time between publication
and the first observed successful exploit by vendors.6
We can see that Adobe
vulnerabilities are exploited quickly, while Mozilla vulnerabilities take much
longer to exploit after disclosure. Half of all exploitations happen between
10 and 100 days after the vulnerability is published, with the median around
30 days. This provides us with some general guidelines on which software
vulnerabilities to prioritize along with some guidance on time-to-patch targets.
Treading water
Figure 11 shows the number of vulnerabilities opened each week minus the
number of vulnerabilities (aka “vulns”) closed, scaled by the number of assets
in the dataset during each week of 2015. When the line is above zero, it means
that more vulns are being opened than closed (new vulns disclosed, more
6	 The blue boxes in Figure 10 represent 50% of the values for a given category and the gray line within the box is the
median value. The dots represent individual values.
Figure 10.
Time to first-known exploitation
by vulnerability category.
-20
20
60
100
140
180
220
260
MozillaAppleOpenSSLOracleMicrosoft
Vendor
Daystofirstexploitation
AbobeGrand Total
0
-15
-10
-5
0
5
10
15
20
25
30
4 8 12 16 20 24 3228 36 40 44 48 52
Week
Normalized,net,vulnerabilities
Figure 11.
Delta of number of
vulnerabilities opened each
week and number closed.
Verizon 2016 Data Breach Investigations Report 15
machines entering the environment, new software installed). When it’s below
zero, remediation efforts are driving down vulnerability counts faster than new
vulns are entering the enterprise.
Basically, we confirmed across multiple datasets that we are treading
water—we aren’t sinking in new vulnerabilities, but we’re also not swimming
to the land of instantaneous remediation and vuln-free assets. However, all
that patching is for naught if we’re not patching the right things. If we’re
going to tread, let’s tread wisely.
What should we mitigate? Hacker economics.
So what are the right things? The 2015 DBIR gave us an idea and
since then, not much has changed.
Revisiting last year’s trends, we find that the two golden rules of
vulnerabilities still hold.
First, Figure 12 arranges CVEs according to publication year and gives a count
of CVEs for each year. While 2015 was no chump when it came to successfully
exploited CVEs, the tally of really old CVEs which still get exploited in 2015
suggests that the oldies are still goodies. Hackers use what works and what
works doesn’t seem to change all that often.7
Secondly, attackers automate
certain weaponized vulnerabilities and spray and pray them across the internet,
sometimes yielding incredible success. The distribution is very similar to last
year, with the top 10 vulnerabilities accounting for 85% of successful exploit
traffic.8
While being aware of and fixing these mega-vulns is a solid first
step, don’t forget that the other 15% consists of over 900 CVEs, which
are also being actively exploited in the wild.
7	 Astute and frequent readers of the DBIR will notice one more gem in this chart—last year, the numbers of
published CVEs exploited were lower across the board—and this year, we have more and better data. Those newly
exploited CVEs however, are mostly—and consistently—older than one year.
8	 CVE-2001-0876, CVE-2001-0877, CVE-2002-0953, CVE-2001-0680, CVE-2002-1054, CVE-2015-0204,
CVE-2015-1637, CVE-2003-0818, CVE-2002-0126, CVE-1999-1058.
CVE publication date
CVEssuccessfullyexploitedin2015
100
80
60
40
20
0
2015 2013 2011 2009 2007 2005 2003 2001 1999
Figure 12.
Count of CVEs exploited in 2015 by
CVE publication date.
All that patching
is for naught if
we’re not patching
the right things.
Verizon 2016 Data Breach Investigations Report 16
Can’t solve everything
In Figure 13, we see that during 2015, vulnerabilities published in 2015 and 2014
were being patched. After that though, the vulnerabilities begin to drop off
and really hit a steady state. This gets at a core and often ignored vulnerability
management constraint—sometimes you just can’t fix a vulnerability—be it
because of a business process, a lack of a patch, or incompatibilities. At
that point, for whatever reason, you may have to live with those residual
vulnerabilities. It’s important to realize that mitigation is often just as useful as
remediation—and sometimes it’s your only option.
Recommended controls
Knowledge is power.
Establish a process for vulnerability remediation that targets vulnerabilities
which attackers are exploiting in the wild, followed by vulnerabilities with known
exploits or proof-of-concept code.
Have a Plan B.
If you have a system that cannot be patched or receive the latest-and-greatest
software update, identify it, and apply other risk mitigations in the form of
configuration changes or isolation. Discuss a plan on how the device(s) could
be replaced without causing severe business disruption.
At your service
Vulnerability scanning is also useful in identifying new devices and new
services. Review scan-to-scan changes as another control to identify unknown
devices and deviations from standard configurations.
400M
300M
200M
100M
0M
Year remediated vulnerability was published
Numberofvulnerabilitiesremediated
2015 ’13 ’11 ’09 ’07 ’05 ’03 ’01 ’99 ’97
Figure 13.
Closure rate of CVEs by CVE
publication date.
Mitigation is often
just as useful as
remediation—and
sometimes your
only option.
Verizon 2016 Data Breach Investigations Report 17
Phishing
You can’t fool all the people all the time. Or can you?
Social engineering in its basic form is simply to dupe or trick someone into
doing something they would not otherwise do (not unlike some online dating).
Social tactics can take many forms such as pretexting,9
elicitation (the subtle
art of extracting information from a subject via conversation), baiting (planting
infected media in victim areas), and a myriad of other lowdown and dirty tricks.
However, by far its most successful variety is phishing, which as the name
implies is malicious correspondence trying to get the recipient to take the
bait in the form of an attachment or embedded link. It is important to note that
‘pretexting’ via email (a back-and-forth dialogue leveraging an invented scenario
to gain a certain end) and a phishing email are similar, but not the same. In the
case of a pretexting email, the criminal is primarily purporting to be someone
they are not, usually within the victim organization (e.g., the CFO who instructs
the victim to approve a fraudulent Automated Clearing House (ACH) transfer).
Bummed is what you are…
…when you click on that attachment and get owned. The basic structure of
phishing attacks remains the same—user clicks, malware drops, foothold is
9	 I’m Frieda's boss.
The majority of
phishing cases
feature phishing as
a means to install
persistent malware.
At a glance
Description
A form of social engineering in which a message,
typically an email, with a malicious attachment or
link is sent to a victim with the intent of tricking the
recipient to open an attachment.
Contributors
Anti-Phishing Working Group, Lares Consulting,
SANS Securing the Human and Wombat Security
provided the non-incident data for this section.
Top patterns Everything Else, Web App Attacks, Cyber-espionage
Frequency
9,576 total incidents, 916 with confirmed
data disclosure.
Key findings
13% of people tested click on a phishing
attachment; median time to click is very short.
Verizon 2016 Data Breach Investigations Report 18
gained. There are still cases where the phishing email leads users to phony
sites, which are used to capture user input, but the majority of phishing
cases in our data feature phishing as a means to install persistent malware.
The victim opens the email, sees the attachment that contains the malware du
jour and says “That file looks good, I’ll have that”. What happens next is dictated
by the end goal of the phisher.
“What we have here is a failure to communicate.”
Apparently, the communication between the criminal and the victim is much
more effective than the communication between employees and security staff.
We combined over eight million results of sanctioned phishing tests in 2015
from multiple security awareness vendors aiming to fix just that. Figure 14 is
jam-packed with information. In this year’s dataset, 30% of phishing messages
were opened by the target across all campaigns.10
“But wait, there’s more!” (in
our best infomercial voice) About 12% went on to click the malicious attachment
or link and thus enabled the attack to succeed. That indicates a significant
rise from last year’s report in the number of folks who opened the email (23%
in the 2014 dataset) and a minimal increase in the number who clicked on the
attachment (11% in the 2014 dataset). The median time for the first user of a
phishing campaign to open the malicious email is 1 minute, 40 seconds. The
median time to the first click on the attachment was 3 minutes, 45 seconds, thus
proving that most people are clearly more on top of their email than I am.
However, before we drag these individuals outside and collectively stone
them, keep in mind that the main perpetrators for these types of attacks are
organized crime syndicates (89%) and state-affiliated Actors (9%) who can
put some thought into the ruse they use (yeah, I know). In roughly 636,000
sanctioned phishing emails, we captured whether the email was reported.
Approximately 3% of targeted individuals alerted management of a possible
phishing email. We did not verify by what means the email was reported, or
whether it was because they were savvy enough to avoid the trap or because
they only realized it once they had fallen in themselves.
10	Granted this could be affected by preview pane opening of emails or people not loading images in emails.
Figure 14.
Number of phishing emails
opened and clicked in first 24
hours and percent of opened
emails that were clicked
50%
25%
0
0.5M
1M
0 12
Hours
CountPercent
6 18
n Opened
n Clicked
n Percent (of opened) clicked
The main
perpetrators for
phishing attacks
are organized
crime syndicates
and state-affiliated
actors.
Verizon 2016 Data Breach Investigations Report 19
As an aside, the smaller proportion of nation-state Actors in this year’s data is
due to a large contribution from a particular contributor who saw a great deal of
‘Dridex’ campaigns which skewed the data toward organized crime. We should
not conclude from this that certain groups from East Asia have had a crisis of
conscience and mended their wicked ways.
What do the attackers ultimately steal? A heck of a lot of credentials (mostly
due to the large amount of opportunistic banking Trojans—beware of Greeks
bearing gifts), but also trade secrets.
Recommended controls
Filter it! Filter it real good!
“An ounce of prevention is worth a pound of cure.” It was good advice when
Ben said it and so it remains. The first opportunity to defend against email-
borne threats is (thankfully) before a human can interact with it. Email filtering
is your buddy in this fight and you need to have an understanding of your
current solution, and test its implementation.
Talk amongst yourselves (I’m verklempt)!
Provide employees with awareness training and information so they can tell
if there is something ‘phishy’ (couldn’t resist) going on. Also, provide them with
a means for reporting these events. We recommend a button on their taskbar,
but whatever works for you.
One click does not a catastrophe make.
So, it snuck past your email filters and someone went clicky-clicky. There is
still ample opportunity to limit the impact. Assuming the organization’s “seekrit
stuff” isn’t resident on the initial foothold, make it hard to pivot from the user
device to other assets in the organization. Protect the rest of your network
from compromised desktops and laptops by segmenting the network and
implementing strong authentication between the user networks and anything of
importance. Static passwords are adorable, but sophisticated attackers don’t
just bypass them, they utilize them to advance their attack.
Keep your eye on the ball.
You increase your chances of catching signs that you have fallen victim to a
phishing attack if you monitor outbound traffic for suspicious connections and
potential exfiltration of data to remote hosts.
829
62
7
7
7Personal
Medical
Bank
Secrets
Credentials
Breach count
Figure 15.
Top five data varieties breached by
phishing attacks, (n=905)
Protect the rest
of your network
from compromised
desktops and
laptops by
segmenting the
network and
implementing strong
authentication.
Verizon 2016 Data Breach Investigations Report 20
We’re not mad, just disappointed.
The use of stolen, weak or default credentials in breaches is not new, is not
bleeding edge, is not glamorous, but boy howdy it works. Static authentication
mechanisms have been attacked for as long as we can remember. Password
guessing from an InfoSec perspective has been around at least as long as
the Morris worm, and has evolved to prominent malware families like Dyre and
Zeus that are designed to (among other bad things) capture keystrokes from
an infected device. All those efforts to get users to use special characters,
upper/lower case numbers and minimum lengths are nullified by this ubiquitous
malware functionality.
The capture and/or reuse of credentials is used in numerous incident
classification patterns. It is used in highly targeted attacks as well as in
opportunistic malware infections. It is in the standard toolkit of organized
criminal groups and state-affiliated attackers alike. Even fraud committed with
stolen payment card data often relies on the static Card Verification Value
(CVV) information on the magnetic stripe.11
We are realists here, we know that implementation of multi-factor
authentication is not easy. We know that a standard username and password
combo may very well be enough to protect your fantasy football league. We
also know that implementation of stronger authentication mechanisms is a bar
11	 More on this in the Post-Compromise Fraud appendix.
Credentials
63% of confirmed
data breaches
involved weak,
default or stolen
passwords.
At a glance
Description
Use of stolen credentials and other hacking and
malware actions targeting traditional username and
password authentication are prevalent across
numerous patterns.
Top patterns Web App Attacks, POS Intrusions
Frequency 1,429 incidents with confirmed data disclosure.
Key findings
Static credentials continue to be targeted by several
of the top hacking action varieties and malware
functionalities.
Verizon 2016 Data Breach Investigations Report 21
raise, not a panacea. Even with all of that, 63%12
of confirmed data breaches
involved leveraging weak/default/stolen passwords. This statistic drives our
recommendation that this is a bar worth raising. Figure 16 shows the most
common threat action varieties associated with attacks involving legitimate
credentials. The obvious action of the use of stolen credentials is numero uno,
but we see some other common actions used in conjunction, including C2
malware, exporting of data, phishing and keyloggers.
12	 We combined all incidents with confirmed data disclosure AND use of stolen creds OR brute force
OR password dumpers OR a data variety of credentials.
1,095
1,031
980
847
841
Malware -
Spyware/keylogger
Social -
Phishing
Malware -
C2
Malware -
Export data
Hacking -
Use of stolen creds
Incident count
n=1462
Figure 16.
Top threat action varieties within
incidents involving credentials,
(n=1,462)
Verizon 2016 Data Breach Investigations Report 22
What began with a muttered complaint of “ugh, another one of these” during
data conversion a couple of years ago grew into a shift in how we present our
core results and analysis. The nine incident classification patterns were born
of recurring combinations of the who (Actors), what (assets), how (actions) and
why (motive) among other incident characteristics.
In the 2014 report, we found that over 90% of breaches fell into one of
the nine buckets and this year’s dataset is no different. We hope that by
discussing security incidents, both for this year and historically, and using
these clusters as the foundation, we can allow security folks to gain the
most from the entire (huge) dataset. Understanding that you don’t have to
necessarily worry about 2,260 different breach possibilities, but only a
select number of nine patterns (depending on your industry) makes the
life of a CISO less of a daily Kobayashi Maru.
Before we dive deeper into changes over time and the individual patterns
(and don’t fret, we will), let’s take a moment and look at the incident and
breach breakouts for 2015 in Figures 17 and 18.
Incident classification patterns
|
|
|
|
|
|
|
|
|
11,347
10,490
9,701
9,630
8,886
7,951
5,334
534
247
102Payment Card Skimmers
Cyber-espionage
POS Intrusions
Web App Attacks
Crimeware
Everything Else
Denial-of-Service
Physical Theft/Loss
Privilege Misuse
Miscellaneous Errors
Percentage of incidents
0% 10% 20% 30%
| Figure 17.
Percentage (blue bar), and count
of incidents per pattern. The gray
line represents the percentage
of incidents from the 2015 DBIR.
(n=64,199)
The nine
classification
patterns were
born of recurring
combinations of
the who, what,
how and why.
Verizon 2016 Data Breach Investigations Report 23
Much to the chagrin of Jerry Lee Lewis, there was not a whole lot of moving
and shaking going on in the pattern rankings compared to last year and looking
at all incidents, only one pattern moved in the pecking order. Crimeware was
the third most common pattern last year and has moved to sixth. The reason is
the filter on the secondary motive we discussed in the Breach Trends section.
Thousands of incidents where we know a device was participating in a denial-
of-service (DoS) bot (but nothing else) were not sent to /dev/null per se, but
you won’t find them here.13
The fact is that our dataset is constantly evolving with contributors joining (yay)
and others not able to participate for a year. Many of our contributors have a
certain specialty or discipline that results in their data being associated with a
certain victim industry, or threat Actor type, or country … you get the picture.
Because of this fact, the ebbs and flows in the patterns from year to year are
attributed more to changes in our data than changes in the threat landscape.
Bad guy trends would likely be best gleaned from the threat action variety level
within a pattern and again, the deeper dives are coming. Having said all of that,
Figures 19 and 20 represent the obligatory “trend” graphs.
13	There are thousands of compromised web servers used as phishing sites that did not make the cut either.
No information on how the server was compromised, or if it was owned or maintained by an organization,
was available.
|
|
|
|
|
|
|
|
|
908
525
197
172
155
125
86
56
49
1Denial-of-Service
Crimeware
Physical Theft/Loss
Payment Card Skimmers
Everything Else
Cyber-espionage
Privilege Misuse
Miscellaneous Errors
POS Intrusions
Web App Attacks
Percentage of breaches
|
0% 10% 20% 30% 40%
Figure 18.
Percentage (blue bar), and count
of breaches per pattern. The gray
line represents the percentage
of breaches from the 2015 DBIR.
(n=2,260)
Figure 19.
Frequency of incident classification
patterns over time across security
incidents.
2006 2007 2008 2009 2010 2011 2012 2013 2014 2015
0%
20%
40%
60%
80%
100%
n Web App Attacks
n Insider and Privilege Misuse
n POS Intrusions
n Payment Card Skimmers
n Miscellaneous Errors
n Physical Theft/Loss
n Everything Else
n Denial-of-Service Attacks
n Cyber-espionage
n Crimeware
Verizon 2016 Data Breach Investigations Report 24
Figure 20.
Frequency of incident classification
patterns over time across confirmed
data breaches.
OK, in lieu of worrying about how patterns rank overall compared to each other, let’s
get to the good stuff. The best way to use the patterns is to understand the applicability
of each of them to your organization. The following charts show the frequency of each
of the patterns relative to each industry. In other words, it shows for all the incidents
(Figure 21) and breaches (Figure 22) within your industry, those patterns which were
common and those which didn’t make an appearance. We have included the incident
and breach totals again as some of the combinations are a small percentage, but
still represent a significant number of events. We use the North American Industry
Classification System (NAICS) to classify the victim industry—go to the NAICS website14
if you’re unsure where your organization fits. Of course if you are an E Corp-like
conglomerate, you can have business units that fall into several industry categories.
14	Census.gov/cgi-bin/sssd/naics/naicsrch?chart=2012
2006 2007 2008 2009 2010 2011 2012 2013 2014 2015
0%
20%
40%
60%
80%
100%
Crimeware Cyber-
espionage
Denial of
Service
Everything
Else
Stolen
Assets
Misc.
Errors
Card
Skimmers
Point
of Sale
Privilege
Misuse
Web
Apps
<1%
2%
2%
4%
4%
5%
1%
16%
1%
10%
<1%
2%
<1%
2%
3%
16%
2%
<1%
<1%
16%
20%
56%
81%
99%
34%
46%
33%
90%
1%
45%
26%
1%
4%
2%
5%
11%
21%
33%
2%
17%
2%
1%
3%
<1%
<1%
32%
<1%
1%
20%
1%
2%
4%
1%
18%
11%
1%
1%
24%
1%
6%
<1%
6%
3%
74%
4%
1%
<1%
5%
<1%
1%
<1%
32%
2%
22%
1%
3%
23%
2%
6%
2%
22%
1%
6%
1%
11%
5%
1%
48%
4%
12%
6%
1%
<1%
13%
35%
Figure 21.
Incident patterns by industry
minimum 25 incidents
Accommodation (72), n=362
Administrative (56), n=44
Educational (61), n=254
Entertainment (71), n=2,707
Finance (52), n=1,368
Healthcare (62), n=166
Information (51)n, 1,028
Manufacturing (31-33), n=171
Professional (54), n=916
Public (92), n=47,237
Retail (44-45), n=370
Transportation (48-49), n=31
n Web App Attacks
n Insider and Privilege Misuse
n POS Intrusions
n Payment Card Skimmers
n Miscellaneous Errors
n Physical Theft/Loss
n Everything Else
n Denial-of-Service Attacks
n Cyber-espionage
n Crimeware
Verizon 2016 Data Breach Investigations Report 25
From an incident standpoint, Denial-of-Service stands out like “a zoot suit
at a Quaker funeral”. This is partly due to the fact that DoS attacks are in
fact, happening all the time—remember all those popped boxes in the DoS
botnets we filtered out? Another reality is that the other patterns that are more
commonly classified as incidents as opposed to confirmed data breaches
(Crimeware, Insider and Privilege Misuse, and Physical Theft and Loss) are
mostly provided by the public sector and healthcare. Those are the top three
incident patterns and we are confident that in the real world they are taking
some of that market share from DoS in other industries.
The most interesting discovery in the breach patterns to industry matrix was
the rise of Web App Attacks across the board, but especially for financial
services organizations (up from 31% in the 2015 DBIR). The next item that
raised an eyebrow or two (or perhaps a unibrow) was the decline (down
from 36% last year) in Crimeware, also in Finance. Is there anything to this?
Actually, yes. This year, again thanks to the organizations involved in the Dridex
takedown, we have even more data involving the reuse of stolen credentials.
This caused the spike in the Web App Attack pattern and if we removed these
breaches, the numbers would be more in line with 2014. On the flip side, in 2014
we received more data on malware infections within organizations, leading to
breaches that landed in our Crimeware bucket. Is Crimeware not playing as big
a role in breaches? The perspective of the reporting contributor has a lot to do
with the pattern breakdowns as well. Using the banking Trojan example:
Event 1: Organization A is infected with a Zeus variant via a drive-by download
Event 2: Malware has a keylogging functionality that captures
banking credentials
Event 3: Malware exports captured data to command and control (C2) server
Crimeware Cyber-
espionage
Denial of
Service
Everything
Else
Stolen
Assets
Misc.
Errors
Card
Skimmers
Point
of Sale
Privilege
Misuse
Web
Apps
1%
3%
1%
3%
4%
12%
1%
7%
1%
3%
3%
47%
19%
16%
1%
1%
1%
17%
2%
11%
4%
3%
25%
4%
4%
1%
17%
3%
1%
19%
4%
9%
1%
27%
2%
22%
25%
15%
37%
1%
1%
9%
3%
95%
47%
7%
1%
3%
64%
1%
3%
4%
32%
11%
24%
21%
13%
2%
1%
30%
50%
82%
3%
57%
21%
13%
9%
26%
Figure 22.
Incident patterns by industry
minimum 25 incidents (only
confirmed data breaches)
Intermission music
Accommodation (72), n=282
Educational (61), n=29
Entertainment (71), n=38
Finance (52), n=795
Healthcare (62), n=115
Information (51), n=194
Manufacturing (31-33), n=37
Professional (54), n=53
Public (92), n=193
Retail (44-45), n=182
Verizon 2016 Data Breach Investigations Report 26
Event 4: Credentials are used to log into Organization B web server
Event 5: Fraudulent transaction is initiated
Organization B may be quick to say “We didn’t have a malware incident” and
if events 4–5 are provided to us, the incident would find a good home in the
Web App Attacks section. But if we received data from Organization A and only
events 1–3 are documented, it now becomes a newly minted Crimeware breach.
It is important to realize that there are interrelations between the incident patterns
that aren’t always evident. Crimeware in one organization leads to DoS against
another; or to fraudulent transactions on another’s application. Remember we’re
all in this together: the security ecosystem, Kumbaya and trust falls folks…
Verizon 2016 Data Breach Investigations Report 27
When Clippit was king
Websites aren’t what they used to be, with a background of a tiled cloud
image, the company name proudly displayed center top in Comic Sans and
with identical animated gifs on either side. Combined with a healthy dose of
ALL CAPS, blink tags and, of course, a site counter at the bottom with
numbers that had just the right touch of drop shadow. 1997 was a simpler time.
Now organizations have less ugly (typically), less static and more business-
critical websites promoting their operations, conducting ecommerce and
hooking into backend databases. Users are not merely reading a homepage
and clicking on a couple of links to basic information about store hours, but are
increasingly more interactive and issue various types of inputs to be read and
acted upon by the web infrastructure. The greater complexity, including the web
application code and underlying business logic, and their potential as a vector15
to sensitive data in storage, or in process, makes web application servers an
obvious target for attackers.
15	 They are likely/hopefully one of the only services that are internet accessible for an organization.
Web App Attacks
The great complexity
of the infrastructure
makes web
application servers a
target for attackers.
At a glance
Description
Any incident in which a web application was the
vector of attack. This includes exploits of code-level
vulnerabilities in the application as well as thwarting
authentication mechanisms.
Top industries Finance, Information, Retail
Frequency
5,334 total incidents (19,389 additional
with secondary motivation), 908 with
confirmed data disclosure.
Key findings
The breaches within this pattern are heavily
influenced by information gathered by contributors
involved in the Dridex botnet takedown. Hundreds of
breaches involving social attacks on customers,
followed by the Dridex malware and subsequent use
of credentials captured by keyloggers, dominate the
actions. Defacements are still commonplace and
CMS plugins are also a fruitful attack point.
Point-of-Sale
Intrusions
Payment Card
Skimmers
CrimewareWeb App
Attacks
Denial-of-
Service Attacks
Physical Theft
and Loss
Insider and
Privilege Misuse
Miscellaneous
Errors
Cyber-
espionage
Verizon 2016 Data Breach Investigations Report 28
For starters, not all website compromises are targeted affairs. We had almost
20,000 incidents of websites that were popped used to either host malware,
participate in distributed denial-of-service (DDoS) attacks or repurposed as a
phishing site. We have no idea as to the method of compromise, nor the victim
demographics and thus these instances of secondary motivation have been
culled from the information that follows. About half of the incidents that remain
were website defacements and the data we have on those was not enough to
establish whether the motive was ideology, a personal grudge, or just for fun—
so we combined them in Figure 23 below. Typically the hacking actions used to
compromise were not known either, but in case you thought defacements, like
the blink element, were an obnoxious thing of the past, think again.16
When we filter down into confirmed data disclosure, the financial
motive flexes its muscle with 95% of breaches associated with
criminals all about the cheddar.
Eco-friendly hacking—reusing and recycling passwords
When looking at the threat actions in Figure 24, a pattern within the pattern
smacks us in the face with a glove and demands satisfaction. The top six
actions narrate the story of the Dridex campaign better than Morgan Freeman
combined with Sir David Attenborough ever could. These breaches, uncovered
through the forensic analysis performed on several C2 servers tell the tale of
phish customer  C2  Drop Keylogger  Export captured data  Use stolen
credentials.18
Even with a particular spree inflating these numbers, the top six
looked very similar to last year, albeit in a different order, and with phishing
making an appearance in the top actions this year.
There are other stories beyond the botnet though. We wanted to know
what other data points the use of stolen credentials was associated with
when that spree was removed from the data. Phishing still showed a strong
association in the pattern, but also mail servers. While masked at first in our
data by the botnet, social engineering to acquire web-based email credentials
16	If you are not familiar with the blink element, just Google “blink tag”. We’re sorry in advance.
17	 F/I/G is the combination of Fun, Ideology, or Grudge
18	If “get funky” was a VERIS enumeration, it would surely be an extension of this attack chain.
Figure 23.
External Actor motives within Web
App Attack incidents, (n=3,720)
2,849
863
7Espionage
Financial
F/I/G17
Incident Count
95% of confirmed
web app breaches
were financially
motivated.
Point-of-Sale
Intrusions
Payment Card
Skimmers
CrimewareWeb App
Attacks
Denial-of-
Service Attacks
Physical Theft
and Loss
Insider and
Privilege Misuse
Miscellaneous
Errors
Cyber-
espionage
Verizon 2016 Data Breach Investigations Report 29
Figure 24.
Top 10 Threat action varieties within
Web App Attack breaches, (n=879)
was uncovered when peeling back the layers of the Web App onion. And
they probably don’t even have the black “I read your email” T-shirt to
brag about their bounty.
Wendell Wilkins injects web shells into the Web App.
We have seen content management systems (CMS) as the vector for
installation of web shells,19
which are also classified as a backdoor in our
framework. Either exploiting a remote file inclusion (RFI) vulnerability, or
abusing an insecure upload functionality, the web shells are injected and used
as the gateway to additional mayhem. In financially motivated attacks against
ecommerce servers, web shells are used to access the payment application
code, which is then modified with a new feature that will capture the user
input (think payment card number and CVV) for future pickup. As with prior
years, this is backed up by other studies.20
And it wouldn’t be a proper DBIR
if we didn’t raise a glass to one of the elder statesmen of web application
hacking, SQL injection (SQLi). It, like other vulnerabilities associated with web
applications, stems from a lack of input validation allowing Actors to pass
SQL commands via the web application and to the database. Lastly we want
to thank AsTech Consulting, Imperva, and WhiteHat Security for scan data
and mind melds around web application security.
19	US-Cert.gov/ncas/alerts/TA15-314A
20	Imperva’s 2015 WAAR showed a strong correlation between RFI and Content Management Systems.
831
817
817
812
811
809
19
14
9
7Brute force
Hacking - RFI
Malware - Backdoor
Hacking - SQLi
Malware - Export data
Malware - C2
Malware - Spyware/Keylogger
Social - Phishing
Hacking - Use of backdoor or C2
Hacking - Use of stolen creds
Breach count
In attacks against
ecommerce servers,
web shells are
used to access the
payment application
code and capture
user input.
Point-of-Sale
Intrusions
Payment Card
Skimmers
CrimewareWeb App
Attacks
Denial-of-
Service Attacks
Physical Theft
and Loss
Insider and
Privilege Misuse
Miscellaneous
Errors
Cyber-
espionage
Verizon 2016 Data Breach Investigations Report 30
Recommended controls
Factor, meet factor.
Like that song you can’t get out of your head. Here is another shot across
the bow of single-factor, password-based authentication for anything of
criticality. If you are securing a web application, don’t base the integrity of
authentication on the assumption that your customers won’t get owned
with keylogging malware. They do and will.
I value your input, I just don’t trust it.
Validate inputs, whether it is ensuring that the image upload functionality makes
sure that it is actually an image and not a web shell, or that users can’t pass
commands to the database via the customer name field.21
Unplug.
Worrying about OS and core application code is hard enough, but third-
party plugins are also gray-hair-inducing. Establish a patch process for CMS
platforms and third-party plugins.
21	 Still great: XKCD.com/327/
Point-of-Sale
Intrusions
Payment Card
Skimmers
CrimewareWeb App
Attacks
Denial-of-
Service Attacks
Physical Theft
and Loss
Insider and
Privilege Misuse
Miscellaneous
Errors
Cyber-
espionage
Verizon 2016 Data Breach Investigations Report 31
Point-of-Sale Intrusions
The well, revisited
It should be no surprise to anyone that this pattern is alive and well in
the 2015 dataset. There are still folks out there seeking to get paid and looking
to stolen payment card data as the means to meet their greedy objectives.
22	Personal Identification Number (PIN) Entry Device
At a glance
Description
Remote attacks against the environments where
card-present retail transactions are conducted.
POS terminals and POS controllers are the targeted
assets. Physical tampering of PED24
pads or
swapping out devices is covered in the Payment
Card Skimmers section.
Top industries Accommodation and Food Services, Retail
Frequency
534 total incidents, 525 with confirmed
data disclosure.
Key findings
Headline-grabbing remote payment card breaches
have shifted from large retailers in 2014 to hotel
chains in 2015. Use of stolen credentials to access
POS environments is significant. Command and
control functionalities are being reported at a much
higher rate than in years past, although this may be
in part due to an underrepresentation of C2
functionalities as opposed to a 2015 trend.
RAM scraping continues to be omnipresent in 2015,
but keylogging malware has a significant role in
many POS attacks, being a common method of
capturing valid credentials to be used against POS
assets. Continuing the trend of the last several
years, the sprees (single threat Actor, many victims)
represented in this data are a byproduct of
successful attacks against POS vendors and cannot
be attributed to automated attacks targeting poorly
configured, internet-facing POS devices.
Point of sale
devices continue
to be a reliable
source for
stolen payment
card data.
Point-of-Sale
Intrusions
Payment Card
Skimmers
CrimewareWeb App
Attacks
Denial-of-
Service Attacks
Physical Theft
and Loss
Insider and
Privilege Misuse
Miscellaneous
Errors
Cyber-
espionage
Verizon 2016 Data Breach Investigations Report 32
Point-of-sale devices continue to be a reliable source for this data, notably
the POS terminals that directly consume magnetic stripe information
from customers, or POS controllers that typically act as an aggregator of
transactional data from the terminals in a server-to-client relationship.
In small businesses, the POS environment may have a population of one, with
a lone computer processing payments and communicating out to the payment
processor. This device might also (unfortunately) be used for checking personal
email, social media breaks and other interwebby activities that introduce more
risk to the POS application which is all alone, with no anti-virus or host-based
firewall to talk to.
Four or five years ago, our findings were dominated by POS breaches—
simplistic and automated in nature and making full use of known default vendor
credentials. We lovingly called these POS Smash and Grabs, and this attack
method was one that we saw over and over again and helped drive us to the
development of incident classification patterns. The gist of these, if this is your
first DBIR rodeo, is: 1) POS server is visible to the entire internet, 2) POS has
default login, 3) Bad guy leverages 1) and 2) to install malware and 4) Malware
grabs the payment card data as it is processed. This scenario was, and still is,
a small business problem. It did, however, offer some insight into what was to
come for larger organizations.
The 2015 DBIR detailed the rise of larger organizations suffering POS breaches
and their representation in this pattern. While 1) and 2) were not present in
these breaches, raising that fruit a little higher from the ground, there are some
definite similarities. Both the smash and grabs and large organization breaches
took advantage of static, single-factor authentication. Attackers have had to up
their game a bit, having to do some work to compromise valid and assumed-
to-be non-default, credentials to access the environments. Moreover, they
have issued the stolen credentials from a foothold on the network as
opposed to directly from the internet.
Figure 25 shows the prevalence of stolen passwords in the POS Intrusion
pattern. Brute force is still relevant, but we hope it will continue to decline
as small and medium businesses move away from passwords that could be
guessed by a rhesus monkey of average intelligence.
Figure 25.
Three-year chart of % and number
of breaches using stolen credentials
within POS Intrusions, (n=1,103)
127
99
78
0%
10%
20%
30%
40%
2013 2014 2015
Attackers have
had to up their game
to compromise
valid credentials
and access the
environments.
Point-of-Sale
Intrusions
Payment Card
Skimmers
CrimewareWeb App
Attacks
Denial-of-
Service Attacks
Physical Theft
and Loss
Insider and
Privilege Misuse
Miscellaneous
Errors
Cyber-
espionage
Verizon 2016 Data Breach Investigations Report 33
Vendor as a vector
The vector associated with the hacking actions tells an interesting story as
well. Ninety-seven percent of breaches featuring use of stolen credentials also
had a vector of Partner. This is selected when the Actor uses legitimate partner
access in the hacking action. This year continued the trend of the criminal
sprees in our data being associated with attacks against POS vendors followed
by using their access into their customer base.23
Bill Gates once said “Your
most unhappy customers are your greatest source of learning.” With all of their
customers equally unhappy, the amount of learning some POS vendors have
acquired must have been like Neo’s martial arts training.24
The other similarity of large and small organizations is that malware is the
workhorse of POS breaches. Figure 26 shows the most common malware
functionalities. We have seen the evolution from “off-the-shelf” keyloggers,
to memory scraping malware (RAM scrapers), to POS-specific RAM scrapers
with names like BlackPOS and PoSeidon (in case you weren’t sure what they
were designed to attack). Exfiltration has evolved from static code within the
malware to FTP data to a single destination, to utilization of a C2 infrastructure
to ship the captured data out.
Both C2 and Backdoor are more prevalent this year than in years past. The
reality is that POS malware families are typically multifunctional and some
of the most notorious (Dexter, vSkimmer, Alina, Backoff, JackPOS …) have
command and control/backdoor capabilities. In many cases, it is easier to
prove the use of one functionality (the one that stole the data) than others (C2
beaconing). Many of the POS Intrusion incidents did not have the evidentiary
logs needed to validate outbound communications. Long story short, the spike
in C2 and Backdoor may very well be a product of better windows into the
entire behavior of the malware.
23	The actions used in this scenario are examined more closely in the Wrap Up section as it features
combinations of many of the top threat action varieties that are also found in other patterns.
24	“I know kung fu.”
512
210
160
155
4
4
3
2
2
1Worm
Capture app data
Adminware
Spyware/Keylogger
Downloader
Capture stored data
Backdoor
C2
Export data
Ram scraper
Breach count
Figure 26.
Malware varieties within POS
Intrusion breaches, (n=521)
97% of breaches
featuring stolen
credentials
leveraged legitimate
partner access.
Point-of-Sale
Intrusions
Payment Card
Skimmers
CrimewareWeb App
Attacks
Denial-of-
Service Attacks
Physical Theft
and Loss
Insider and
Privilege Misuse
Miscellaneous
Errors
Cyber-
espionage
Verizon 2016 Data Breach Investigations Report 34
Recommended controls
Not trying to give you static, but...
Static single authentication is a weakness that is used in spades by the
attackers. If possible, improve this with a second factor such as a hardware
token or mobile app, and monitor login activity with an eye out for unusual
patterns. Have a conversation with your vendors and ensure that they are using
strong authentication to access your POS environment.
Who can it be, knocking at my door?
Find out what monitoring options are available for your POS environment and
validate their implementation. Track remote logins and verify any and all that are
against the norm.
Segmentation, seriously
Separate the POS environment from the corporate LAN and ensure that it is not
visible to the entire internet.
Point-of-Sale
Intrusions
Payment Card
Skimmers
CrimewareWeb App
Attacks
Denial-of-
Service Attacks
Physical Theft
and Loss
Insider and
Privilege Misuse
Miscellaneous
Errors
Cyber-
espionage
Verizon 2016 Data Breach Investigations Report 35
The disgruntled insider—we all have an idea in our minds of what this
person looks like. Perhaps it is the software developer who is frustrated
with management; maybe it is the healthcare worker who has been
recruited by organized crime; or maybe it is that guy in the basement
grieving the loss of his red stapler. Regardless of what they look like,
the fact is they are inside our carefully constructed defenses and they
are wreaking havoc with our data.
The Insider and Privilege Misuse pattern is one of the few that sees collusion
between internal and external (or even partner) Actors. Figure 27 shows the
percentage of these breaches where multiple Actors are present.
These are most frequently an external/internal pairing, but ruling out partners
as potential colluders is a mistake. The break from the norm that we saw was
the rise in misuse breaches tied to external Actors only. This was normally
solely associated with TGYFBFTDHRA,25
but this year we had cases where
25 That guy you fired but forgot to disable his remote access.
Insider and Privilege Misuse
The Privilege
Misuse pattern is
one of the few that
includes collusion
between internal and
external Actors.
At a glance
Description
All incidents tagged with the action category of
Misuse—any unapproved or malicious use of
organizational resources—fall within this pattern.
This is mainly insider-only misuse, but outsiders
(due to collusion) and partners (because they are
granted privileges) show up as well.
Top industries Public, Healthcare, Finance
Frequency
10,489 total incidents, 172 with confirmed
data disclosure.
Key findings
They’re behind your firewall, getting all up in your
data. They are often end users and they are
comfortable exfiltrating data out in the open on the
corporate LAN. Insider incidents are the hardest
(and take the longest) to detect. Of all the incidents,
these insider misuse cases are the most likely to
take months or years to discover.
Point-of-Sale
Intrusions
Payment Card
Skimmers
CrimewareWeb App
Attacks
Denial-of-
Service Attacks
Physical Theft
and Loss
Insider and
Privilege Misuse
Miscellaneous
Errors
Cyber-
espionage
Verizon 2016 Data Breach Investigations Report 36
instead of organized crime soliciting insiders to provide banking information,
they went to the customer. It was actually external  external collusion to
commit fraud.
The butler did it.
Back to the insiders—who are they? When their roles were classified in the
incident, almost one third were found to be end users who have access to
sensitive data as a requirement to do their jobs. Only a small percentage
(14%) are in leadership roles (executive or other management), or in roles with
elevated access privilege jobs such as system administrators or developers
(14%). The moral of this story is to worry less about job titles and more about
the level of access that every Joe or Jane has (and your ability to monitor
them). At the end of the day, keep up a healthy level of suspicion toward all
employees. While we would like to think they will never give you up, let you
down, run around or desert you, we simply can’t (tell a lie, and hurt you).
The why and how
What motivates them? Most frequently it is the potential for financial gain
(34%), although the espionage motivation (25%) continues to be associated
with these breaches. Figure 28 shows how the motivation of these Actors
Figure 27.
Percent of breaches per threat Actor
category within Insider and Privilege
Misuse, (n=172)
11% 77% 3%8%
25%
50%
75%
2009 2013 201520142010 2011 2012
Figure 28.
Actor motive over time within Insider
and Privilege Misuse, (n=715)
n Financial
n Espionage
n Grudge
n Fun
n Everything Else
n Ideology
Actor
n External
n Collusion
n Internal
n Partner
Point-of-Sale
Intrusions
Payment Card
Skimmers
CrimewareWeb App
Attacks
Denial-of-
Service Attacks
Physical Theft
and Loss
Insider and
Privilege Misuse
Miscellaneous
Errors
Cyber-
espionage
Verizon 2016 Data Breach Investigations Report 37
has changed since 2009. It is interesting to see the potential convergence
of the financial motivation and the espionage motivation. While this also
reflects the change in the dataset as we progress over time, the rise of the
espionage-motivated insider should give organizations reason to consider
implementing processes to detect when exiting employees may have taken
valuable data with them.
Figure 29 lists the top varieties of Misuse within the Insider and Privilege
Misuse pattern. When the nature of their actions is known, the general privilege
abuse is always at the top of the list. This is merely using access to gain
information for alternative and unsanctioned uses. Data mishandling follows
and typically involves mailing sensitive information or loading to a sharing
service. Many times this is not done with malicious intent, but for a convenience
factor. Use of unapproved hardware and software are the third and fourth most
common varieties of misuse. The unapproved hardware is usually either a USB
drive (used to store information to be used later, like, when employed at another
company kind of later) or a hand-held skimmer that we have seen food servers
use to capture diners’ payment card data.
The actions of insiders are among the most difficult to detect and the discovery
timeline (Figure 30) illustrates this point. In our graphic we show the majority
of these incidents are taking months or longer to discover. In fact, when we
looked at the overall DBIR dataset, we found that the incidents that take the
152
30
24
23
18
17
6
6
5
4Unapproved workaround
Illicit content
Net misuse
Knowledge abuse
Email misuse
Possession abuse
Unapproved software
Unapproved hardware
Data mishandling
Privilege abuse
Incident count
Figure 29.
Top Misuse action varieties within
Insider and Privilege Misuse, (n=230)
Point-of-Sale
Intrusions
Payment Card
Skimmers
CrimewareWeb App
Attacks
Denial-of-
Service Attacks
Physical Theft
and Loss
Insider and
Privilege Misuse
Miscellaneous
Errors
Cyber-
espionage
Verizon 2016 Data Breach Investigations Report 38
longest to discover were these inside jobs. The shift from days to months led
us to look at what was different. We found that there were more cases where
bank employees provided info that was used for fraud—and was discovered
quicker—in years prior. For organizations that will not have fraud detection in
their arsenal, the shift is likely more representative of their world.
Recommended controls
The evil within
So love your employees, bond at the company retreat, bring in bagels on Friday,
but monitor the heck out of their authorized daily activity, especially ones
with access to monetizable data (financial account information, personally
identifiable information (PII), payment cards, medical records).
USB wary
Our dataset included numerous instances of audits being performed after an
employee had left, which uncovered evidence of a USB drive used to transfer
data prior to their departure. It makes sense to take measures to identify use of
these portable drives sooner rather than later.
Keep one eye on your data and the other on your employees!
You cannot effectively protect your data if you do not know where it resides.
Likewise, it does you little good to know where it is but then pay no attention to
who has access to it. Make sure that you are aware of exactly where your data
is and be careful who you give privileges to and to what degree. It makes sense
to give the valet attendant your keys to park your car, but not to hand over your
credit cards as well.
Figure 30.
Discovery timeline within Insider and
Privilege Misuse over time, (n=358)
2009 2011 2013 2015
5%
5%
49%
21%
21%Years
Months
Weeks
Days
Hours
Minutes
Seconds
201420122010
You can’t effectively
protect your data
if you don’t know
where it resides.
Point-of-Sale
Intrusions
Payment Card
Skimmers
CrimewareWeb App
Attacks
Denial-of-
Service Attacks
Physical Theft
and Loss
Insider and
Privilege Misuse
Miscellaneous
Errors
Cyber-
espionage
Verizon 2016 Data Breach Investigations Report 39
Tougher penalties for data breaches
Almost without exception, every international fraud and business crime
case that Mishcon de Reya LLP has advised on in the past 12 months
involved the use of computer equipment and electronic data. For a
company that falls victim to cybercrime, there are immediate financial
ramifications from loss of revenue while systems are down, the unlawful
exploitation of valuable data that has been stolen, or possible claims
faced from the queue of litigants seeking compensation. Additionally,
there can be a broader impact on customer trust and confidence
following an incident that can lead to reputational damage that is more
difficult to quantify.
Yet, there is huge inconsistency and discrepancy in the way that
governments are tackling this problem. Many believe that the legislation
is out of date with technology and too weak to combat the problem with
any meaningful sanction. There is widespread confusion and enhanced
regulatory risk as businesses are forced to comply with radically
different laws as their data passes from one country to the next.
In the US, there are a multitude of privacy and data security laws
but no specific and comprehensive federal law, and no official
national authority responsible for enforcing it. As a member of the
European Union, the UK implemented the European Union’s 1995 Data
Protection Directive 95/46/EC with the Data Protection Act 1998.
The Information Commissioner’s Office is responsible for enforcing it
and upholding information rights, but the ICO is championing tougher
sanctions, including prison sentences rather than fines, to deter theft
and trading of personal data. At the moment, there is no mandatory
reporting obligation in the UK under the data protection legislation
and the toughest penalty that the ICO can impose is a £500,000 fine
(about $700,000) for the most serious of data breaches. As such,
the legislation lacks the necessary teeth to properly deter misuse of
personal data.
While there is other criminal legislation law enforcement can use
to combat cybercrime more broadly, the authorities in the UK
and elsewhere face difficult and expensive jurisdiction hurdles as
offences routinely cross borders, requiring authorities to cooperate
internationally to investigate acts, then extradite and prosecute
criminals. With huge volumes of encrypted data, proxy servers masking
true IP addresses, secure VPNs and anonymous currency exchanges
used by criminals, many authorities are falling at the first hurdle in
terms of finding the necessary evidence to support a prosecution.
Unfortunately, there is still a long way to go before the scale and rate of
cyberattacks is brought under control by effective legislation.
Hugo Plowman and Rob Wynn Jones, Partners—Mishcon de Reya LLP
Point-of-Sale
Intrusions
Payment Card
Skimmers
CrimewareWeb App
Attacks
Denial-of-
Service Attacks
Physical Theft
and Loss
Insider and
Privilege Misuse
Miscellaneous
Errors
Cyber-
espionage
Verizon 2016 Data Breach Investigations Report 40
People aren’t perfect.
With all of the hubris and bravado in the InfoSec world, one proclamation we
usually don’t hear is “Our employees NEVER make mistakes.” Well, because
they do. Everyone does and this is the section where we talk about breaches
caused by the people saying “Oops, my bad”. An important distinction that
will be familiar to those with strong VERIS-fu is that we take a very narrow
approach to the Miscellaneous Errors action category. If you got hacked due
to the lack of any patch process or validation, then that is not an error. The
action or inaction was not a direct cause of the data loss (the bad guy still had
to get his hack on). To ensure that every incident we come across isn’t rubber-
stamped as an error due to less-than-perfect security practices, we limit its
use to only when the action is the direct cause of attribute loss. And because
the most common error of losing stuff is so common, it was deemed worthy of
its own pattern along with stolen assets on page 43. As in prior reports, due to
the influx of thousands upon thousands of misdelivery incidents from the public
sector26
that tried to steal the show, we have removed them in the interest of
finding actionable tidbits of information that would never have a voice otherwise.
Data errors reduce productivity (DERP).
Traditionally, this pattern has been dominated by the Trio of Trouble:
Misdelivery, Publishing and Disposal errors and they make their annual
appearance in Figure 31. Last year we grew our corpus to include data that
26	Public sector misdelivery incidents was, (n=10,094)
Miscellaneous Errors
The most common
error of losing stuff
is so common, it was
deemed worthy of its
own pattern.
At a glance
Description
Incidents where unintentional actions directly
compromised a security attribute of an information
asset. This does not include lost devices, which are
grouped with theft instead.
Top industries Public, Information, Healthcare
Frequency
11,347 total incidents, 197 with confirmed
data disclosure.
Key findings
Misdelivery of information both in paper and digital
form remains the most prevalent variety of error.
Point-of-Sale
Intrusions
Payment Card
Skimmers
CrimewareWeb App
Attacks
Denial-of-
Service Attacks
Physical Theft
and Loss
Insider and
Privilege Misuse
Miscellaneous
Errors
Cyber-
espionage
Verizon 2016 Data Breach Investigations Report 41
shed light on availability issues caused by non-malicious spikes in traffic.
Those capacity shortage errors lead the way this year, followed by worker
bees either sending emails or documents to the wrong recipients. Classified as
Misdelivery errors, these events have seen many a person curse the existence
of autocomplete in their Outlook To: field.
Publishing information where an unintended audience (e.g., the entire internet)
is able to view it remains in the top five. As does misconfiguration—mistyping a
firewall rule allowing access to a sensitive file server from all internal networks
instead of a specific pool of hosts would be a fine example.
Rounding out the top five is disposal errors. These are primarily documents,
which is concerning, since that data is in human-readable format—look Ma, no
controls! While not as common in our dataset this year, proper wiping of hard
drives on decommissioned devices must also be standard operating procedure
for organizations.
61
40
18
15
10
3
2
2
1
1Omission
Data entry error
Programming error
Other
Gaffe
Disposal error
Misconfiguration
Publishing error
Misdelivery
Capacity shortage
Incident count
Figure 31.
Top 10 threat action varieties within
Miscellaneous Errors, excluding
Public, (n=153)
A note on data disclosure—for the VERIS field name data_disclosure to
be “Yes,” there must be some indication that data was actually viewed
or accessed by an unauthorized individual. The following are example
scenarios and guidance on how this variable is set:
•	 Unencrypted stolen or lost device: Potentially
•	 Encrypted stolen or lost device: No
•	 Improperly disposed documents or devices: Potentially
•	 Accidentally publishing private data to a public website (no evidence
that anyone viewed it): Potentially
•	 Misaddressed envelope that was never traced or recovered:
Potentially
•	 Misaddressed envelope that was opened by the incorrect recipient:
Yes
•	 Scenarios not marked No or Potentially will change to Yes if
discovered by an outside party. For instance, if an external party
notifies the victim of a publishing error, the data is, by definition,
disclosed.
Point-of-Sale
Intrusions
Payment Card
Skimmers
CrimewareWeb App
Attacks
Denial-of-
Service Attacks
Physical Theft
and Loss
Insider and
Privilege Misuse
Miscellaneous
Errors
Cyber-
espionage
Verizon 2016 Data Breach Investigations Report 42
When errors lead to data spills, it is still more common to find out from the
customers affected by the mistake. One or several of the recipients of someone
else’s PII or medical information will reach back out to the organization to clue
them into the off-by-one error. Figure 32 shows the top discovery methods for
breaches in the Miscellaneous Error pattern.
Recommended Controls
There is perhaps an element of absurdity in recommending controls for the
Error section. One can’t really say “don’t screw up again”, or “pay attention to
what you are doing for Pete’s sake”. Nevertheless, there are some common
sense practices that can be implemented to help keep errors to a minimum.
After all, with all the crooks trying to ruin us, the least we can do is try not to
help them.
Learn from your mistakes!
Keeping a record of common errors that have plagued your organization can
be used for something other than to mock fellow employees at the company
Christmas party. Collecting this information can be used to implement new
training materials for security awareness. Did Jim in accounting cc: everyone
in to his latest rant again? Talk about it. Just don’t mention Jim by name.
Incorporate frequent “Oops moments” into security training.
“I’m the map, I’m the map, I’m the map, I’m the map, I’m the map!”
Now that you are keeping a record of wrongs (love may not do it, but wise IT
departments do), use that data to map the most common errors to effective
controls that can help to minimize the frequency with which they occur, and
mitigate the damage they do when they do take place.
Stop trash talking!
When assets are ready for disposal, make sure that there is a documented
procedure for wiping all assets before they are trashed or resold. Ensure that
any and all assets go through a rigorous process of check and recheck by
the IT department before they can be decommissioned and disposed of. Our
dataset is rife with examples of assets being sold to a third party while chock-
full of PII and other sensitive data.
43
27
8
7
6
3
2
1
1
1Other
Internal - IT review
External - suspicious traffic
External - audit
External - actor disclosure
External - found documents
Internal - reported by employee
External - customer
Internal
External
Breach count
Figure 32.
Discovery methods of breaches
within Miscellaneous Error excluding
Public, (n=52)
Ensure that all
assets go through
a rigorous check by
the IT department
before they can be
decommissioned or
disposed of.
Point-of-Sale
Intrusions
Payment Card
Skimmers
CrimewareWeb App
Attacks
Denial-of-
Service Attacks
Physical Theft
and Loss
Insider and
Privilege Misuse
Miscellaneous
Errors
Cyber-
espionage
Verizon 2016 Data Breach Investigations Report 43
Humans, what are you gonna do?
If you have young children, the next time you are in their school take a gander
at the horror show known as Lost and Found. You will see what appears to be
at least 2.5 articles of clothing per student shoved in a bin and left there long
enough to form a single brick of coats, hats, gloves and unidentifiable pieces
of fabric that entered—but like Charlie on the MTA—never returned home.
People lose things all the time—this is not new or particularly newsworthy. It
is, however, a real-world pain in the neck for organizations that are at best
replacing Scooter’s laptop, or at worse scrambling around to figure out if there
was PII on the device and whether encryption had been implemented. And if the
fallibility of Scooter weren’t enough, there are still people that want something
and don’t wanna pay for it. So to sum this pattern up in haiku form:
Same old story, same old song and dance
We defined more specific guidelines on data disclosure in the sidebar
featured in the Miscellaneous Error pattern. For non-encrypted devices, the
Physical Theft and Loss
For non-encrypted
devices, the
determination of a
breach can be tough,
given that you no
longer have custody.
Employees lose things
Bad guys also steal your stuff
Full disk encryption
At a glance
Description
Pretty much what it sounds like—any incident where
an information asset went missing, whether through
misplacement or malice.
Top industries Public, Healthcare
Frequency
9,701 total incidents, 56 with confirmed data
disclosure.
Key findings
When we look at all incidents, laptops are the top
asset affected by this pattern. However, for
confirmed breaches, it is the documents, with their
lack of controls, which result in the most confirmed
disclosures. Lost assets were over 100 times more
prevalent than theft.
Point-of-Sale
Intrusions
Payment Card
Skimmers
CrimewareWeb App
Attacks
Denial-of-
Service Attacks
Physical Theft
and Loss
Insider and
Privilege Misuse
Miscellaneous
Errors
Cyber-
espionage
Verizon 2016 Data Breach Investigations Report 44
determination of a breach can be tough, given that you no longer have custody
of the computer in question. Is the data on that system at risk? Certainly, since
it is trivial to bypass the sole control—the password. Still, we cannot by our
definition, in most cases of lost computing devices, label them as a confirmed
data breach. This discrepancy between the number of confirmed breaches and
the number of incidents in this pattern shows that there is quite a bit more data
in the at-risk category than the number of confirmed breaches implies.
Based on all the incidents in this pattern, laptops are the most common target.
However, when we narrowed our research to confirmed breaches, documents
are in the lead due to the ability to infer that the finder or thief can read the
language in which the information is written.
Physical theft is a problem that we have seen time and again, and these
incidents most commonly occur in the victim’s own work area (39%) or
from the personal vehicle of the employee (33.9%). That said, these items
are being lost far more often than they are being stolen. In this year’s data,
an asset is lost over 100 times more frequently than it is stolen. At the
end of the day, the impact is the same—the laptop is gone and likely
wasn’t turned into Lost and Found.
Recommended controls
Just do it.
Full disk encryption on all mobile devices and removable media—make it part of
the standard build.
Changes in attitudes
Keep hope alive that security and situational awareness will become ingrained
in your users. Include physical security of corporate assets as part of their
orientation and ongoing training. Reiterate that cars are not an appropriate
place to leave laptops. Cars have windows which thieves have proven that they
can not only see through, but also break to get what they want.
Dead trees
Rein in the paper as much as feasible given your business. Establish data
classification and make it a policy violation, with potential consequences, to
print and transport sensitive data. Consider tokenizing to replace sensitive
information with an alternate unique identifier when printed copies are required.
In this year’s
data, an asset is
lost over 100 times
more frequently
than it is stolen.
Point-of-Sale
Intrusions
Payment Card
Skimmers
CrimewareWeb App
Attacks
Denial-of-
Service Attacks
Physical Theft
and Loss
Insider and
Privilege Misuse
Miscellaneous
Errors
Cyber-
espionage
Verizon 2016 Data Breach Investigations Report 45
Since the expansion of our data contributors and the advent of the patterns,
Crimeware has historically been generous in the number of cases, but not so
rich in detail. The majority of the incidents found in this neck of the woods come
(in bulk) from CERT/CSIRT organizations, who receive them from a wide variety
of organizations. These are typically high-frequency, low-impact annoyances
that will not receive a full forensics investigation and/or be documented and
categorized. We focus on the smaller subset of incidents where the fidelity is
higher and use those as predictors into the nature of the rest. This year we also
will be delving into malware data received from our security vendor contributors
(many thanks to Cylance, Fortinet, ICSA Labs, Palo Alto Networks and Tenable)
to shed some light on certain areas.
When the functionality of the malware was known, C2, ransomware, spyware/
keylogger, and backdoor and export data were the top five functionalities
(see Figure 33). Notably absent is malware designed to DoS another target—
these were culled with the secondary motive filter discussed on page 8. Over
Crimeware
Typically, these are
high-frequency, low-
impact annoyances
that will not receive
a full forensics
investigation.
At a glance
Description
Any incident involving malware that did not fit into a
more specific pattern. The majority of the incidents
that comprise this pattern are opportunistic in
nature and have a financial motivation behind them.
This pattern frequently affects consumers and is
where “typical” malware infections will land.
Top industries Public, Information, Finance
Frequency
7,951 total incidents (6,858 additional
with secondary motivation), 49 with confirmed
data disclosure.
Key findings
The Crimeware pattern continues to be driven
by external organized criminal groups that are
financially motivated. Establishment of control
over a device using C2 malware followed by
ransomware, then the targeting of credentials or
enrollment into a botnet accounts for the majority
of the incidents.
Point-of-Sale
Intrusions
Payment Card
Skimmers
CrimewareWeb App
Attacks
Denial-of-
Service Attacks
Physical Theft
and Loss
Insider and
Privilege Misuse
Miscellaneous
Errors
Cyber-
espionage
Verizon 2016 Data Breach Investigations Report 46
6,800 instances of identified devices launching traffic at unknown victims
would have dominated the numbers in such a way that it would deter from the
usability of the data.
Ransomware, in the number two spot, realized the biggest jump in our data
and this will continue to be an element that we track. In case you missed it,
ransomware is malware that encrypts files resident on the infected device
and, in worst cases, attached file shares. Extortion demands follow, leveraging
the need for availability of the data. This is cut from the same cloth as denial-
of-service extortion, but typically is opportunistic in nature and affects
organizations and consumers alike.
The rest of the top five draw out a very familiar pattern involving banking
Trojans. The criminal groups behind these families of malware know that you
need to control your infected minions (C2/backdoor), and you need to capture
(keylogger) and send (export data) the banking credential information—so these
are the tools of the trade. These functionalities are top-heavy this year, but are
by no means new or indicative of an upward trend.
Generally speaking, there are three major avenues for crimeware installation,
either via emails with malicious attachments, websites serving up drive-by
downloads with each visit, or a hybrid of the two—emails with links to pages
with, you guessed it, drive-by code installs.
175
148
42
21
19Export data
Backdoor
Spyware/keylogger
Ransomware
C2
Incident count
Figure 33.
Top five malware varieties within
Crimeware, (n=382)
Figure 34.
Top five malware vectors within
Crimeware, (n=135)
63
61
39
10
10Network propagation
Download by malware
Email link
Web drive-by
Email attachment
Incident count
Point-of-Sale
Intrusions
Payment Card
Skimmers
CrimewareWeb App
Attacks
Denial-of-
Service Attacks
Physical Theft
and Loss
Insider and
Privilege Misuse
Miscellaneous
Errors
Cyber-
espionage
Verizon 2016 Data Breach Investigations Report 47
We look to non-incident data for the rest of this section to provide some more
malware information. We first wanted to reaffirm what we found last year
regarding the uniqueness of hashes.
To hash or not to hash? Let’s not.
Last year we burst many a bubble by calling out that a unique hash does not
mean you have been targeted by an ultra-sophisticated group of nation state
malware ninjas.
This year, we compared hashes out of a total of 40 million records of malware
from several contributors and noticed that again there was little overlap across
organizations. When investigating for commonalities, we saw that about 20,000
MD5 hashes existed across multiple organizations out of almost 3.8 million
unique hashes.
And poof, he’s gone.
We then looked at how long hashes were used for. Drumroll please … not long.
When looking at the difference between when a hash was first seen versus
when it was last seen, we saw that the count of hashes over this time difference
was very much long-tailed (see Figure 36 below). The vast majority were used
for a very short period of time and then dropped off the face of the network.
Do you want ransomware? Because that’s how you get ransomware!
We stated earlier that because run-of-the-mill malware does not
always merit incident responders rappelling in through skylights and
cloning drives, it is a bit light on details. We did however receive a
group of ransomware cases where the vector was known (hooray!)
and what was specifically exploited (Flash). Even better was that we
had the version of Flash exploited and the current Flash version. We
thought, “This could be interesting—how bad can people be at updating
Flash?” The answer is, very bad. This is a small sample size, but the
results were still eye-opening. We aren’t putting this here to ring the
shame bell at anyone, but Figure 35 shows that over one half of these
browsers were rocking Flash versions that were over a year older than
the current revision. The speed of Lewis Hamilton was not required
for the majority of these drive-by downloads; the pace of a horse-
drawn carriage would have done just fine. It should be noted that some
organizations with more togetherness in their act also fell victim, with
one having a version that was current and another only two weeks
older than the latest iteration.
0 1 2
Years
Figure 35.
Time from release date of
exploited Flash version to release
date of current version at time
of exploitation (n=15)
We then looked at
how long hashes
were used for.
Drumroll please…
not long.
Point-of-Sale
Intrusions
Payment Card
Skimmers
CrimewareWeb App
Attacks
Denial-of-
Service Attacks
Physical Theft
and Loss
Insider and
Privilege Misuse
Miscellaneous
Errors
Cyber-
espionage
Verizon 2016 Data Breach Investigations Report 48
Analysis of one of our larger datasets showed that 99% of malware hashes are
seen for only 58 seconds or less. In fact, most malware was seen only once.
This reflects how quickly hackers are modifying their code to avoid detection.
Recommended controls
Where be me eye patch, matey?
We know that malware droppers, in many cases, succeed by exploiting known
vulnerabilities, so utilize those patches that your vendors release for your OS,
applications (cough, browsers, cough) and security tools.
Exes, stop calling!
Defending against malicious executables ranges from not allowing programs
to run scripts/macros (e.g., document-based programs) to having your email
server strip/remove executables or other file extensions as attachments in
emails. Less is more in this scenario, as you will be reducing the attack surface.
Don’t monkey around.
Don’t be like the three wise monkeys here. See, listen and discuss. As
suggested in last year’s report, capture malware analysis data in your own
environment; actually look into the different families of malware in your own
organization and, if at all possible, the entry point.
0.5M
1M
1.5M
2M
0 200 400
Seconds
Countofhashes
100 300 500
Figure 36.
Count of hashes by lifespan in
seconds, (n=2.3 million)
The lifespan of
malware hashes
is short and not
so sweet.
Point-of-Sale
Intrusions
Payment Card
Skimmers
CrimewareWeb App
Attacks
Denial-of-
Service Attacks
Physical Theft
and Loss
Insider and
Privilege Misuse
Miscellaneous
Errors
Cyber-
espionage
2016 data breach investigations report

More Related Content

What's hot

3rd Part Cyber Risk Report - 2018
3rd Part Cyber Risk Report - 20183rd Part Cyber Risk Report - 2018
3rd Part Cyber Risk Report - 2018NormShield
 
Malwarebytes labs 2019 - state of malware report 2
Malwarebytes labs 2019 - state of malware report 2Malwarebytes labs 2019 - state of malware report 2
Malwarebytes labs 2019 - state of malware report 2Felipe Prado
 
Digital 2017 Niger (January 2017)
Digital 2017 Niger (January 2017)Digital 2017 Niger (January 2017)
Digital 2017 Niger (January 2017)DataReportal
 
Digital 2021: Essential Facebook Messenger Stats for October 2021 v01
Digital 2021: Essential Facebook Messenger Stats for October 2021 v01Digital 2021: Essential Facebook Messenger Stats for October 2021 v01
Digital 2021: Essential Facebook Messenger Stats for October 2021 v01DataReportal
 
WhiteHat 2014 Website Security Statistics Report
WhiteHat 2014 Website Security Statistics ReportWhiteHat 2014 Website Security Statistics Report
WhiteHat 2014 Website Security Statistics ReportJeremiah Grossman
 
Jib inc260425-2
Jib inc260425-2Jib inc260425-2
Jib inc260425-2Liberteks
 
Global Megatrends in Cybersecurity – A Survey of 1,000 CxOs
Global Megatrends in Cybersecurity – A Survey of 1,000 CxOsGlobal Megatrends in Cybersecurity – A Survey of 1,000 CxOs
Global Megatrends in Cybersecurity – A Survey of 1,000 CxOsArgyle Executive Forum
 

What's hot (7)

3rd Part Cyber Risk Report - 2018
3rd Part Cyber Risk Report - 20183rd Part Cyber Risk Report - 2018
3rd Part Cyber Risk Report - 2018
 
Malwarebytes labs 2019 - state of malware report 2
Malwarebytes labs 2019 - state of malware report 2Malwarebytes labs 2019 - state of malware report 2
Malwarebytes labs 2019 - state of malware report 2
 
Digital 2017 Niger (January 2017)
Digital 2017 Niger (January 2017)Digital 2017 Niger (January 2017)
Digital 2017 Niger (January 2017)
 
Digital 2021: Essential Facebook Messenger Stats for October 2021 v01
Digital 2021: Essential Facebook Messenger Stats for October 2021 v01Digital 2021: Essential Facebook Messenger Stats for October 2021 v01
Digital 2021: Essential Facebook Messenger Stats for October 2021 v01
 
WhiteHat 2014 Website Security Statistics Report
WhiteHat 2014 Website Security Statistics ReportWhiteHat 2014 Website Security Statistics Report
WhiteHat 2014 Website Security Statistics Report
 
Jib inc260425-2
Jib inc260425-2Jib inc260425-2
Jib inc260425-2
 
Global Megatrends in Cybersecurity – A Survey of 1,000 CxOs
Global Megatrends in Cybersecurity – A Survey of 1,000 CxOsGlobal Megatrends in Cybersecurity – A Survey of 1,000 CxOs
Global Megatrends in Cybersecurity – A Survey of 1,000 CxOs
 

Similar to 2016 data breach investigations report

2016 Data Breach Investigations Report89 of breaches.docx
2016 Data  Breach Investigations Report89 of breaches.docx2016 Data  Breach Investigations Report89 of breaches.docx
2016 Data Breach Investigations Report89 of breaches.docxfelicidaddinwoodie
 
1. What do hackers break in to the mostHackers have been increa.docx
1. What do hackers break in to the mostHackers have been increa.docx1. What do hackers break in to the mostHackers have been increa.docx
1. What do hackers break in to the mostHackers have been increa.docxpaynetawnya
 
2017 Data Breach Investigations Report
2017 Data Breach Investigations Report2017 Data Breach Investigations Report
2017 Data Breach Investigations Report- Mark - Fullbright
 
Rp data breach-investigation-report-2015-en_xg
Rp data breach-investigation-report-2015-en_xgRp data breach-investigation-report-2015-en_xg
Rp data breach-investigation-report-2015-en_xgCMR WORLD TECH
 
Rp data breach-investigation-report-2015-en_xg
Rp data breach-investigation-report-2015-en_xgRp data breach-investigation-report-2015-en_xg
Rp data breach-investigation-report-2015-en_xgLiberteks
 
The 2014 Data Breach Investigations Report
The 2014 Data Breach Investigations ReportThe 2014 Data Breach Investigations Report
The 2014 Data Breach Investigations Report- Mark - Fullbright
 
rp_data-breach-investigation-report-2015-insider_en_xg
rp_data-breach-investigation-report-2015-insider_en_xgrp_data-breach-investigation-report-2015-insider_en_xg
rp_data-breach-investigation-report-2015-insider_en_xgKevin Long
 
D2015 Protected-Health-Information-Data-Breach-Report
D2015 Protected-Health-Information-Data-Breach-ReportD2015 Protected-Health-Information-Data-Breach-Report
D2015 Protected-Health-Information-Data-Breach-ReportThe Internet of Things
 
Financial Institutions, Merchants, and the Race Against Cyberthreats
Financial Institutions, Merchants, and the  Race Against CyberthreatsFinancial Institutions, Merchants, and the  Race Against Cyberthreats
Financial Institutions, Merchants, and the Race Against CyberthreatsEMC
 
IBM X-Force Threat Intelligence Report 2016
IBM X-Force Threat Intelligence Report 2016IBM X-Force Threat Intelligence Report 2016
IBM X-Force Threat Intelligence Report 2016thinkASG
 
Bitdefender-CSG-Report-creat7534-interactive
Bitdefender-CSG-Report-creat7534-interactiveBitdefender-CSG-Report-creat7534-interactive
Bitdefender-CSG-Report-creat7534-interactivestartupro
 
Verizon Data Breach Digest 2016
Verizon Data Breach Digest 2016Verizon Data Breach Digest 2016
Verizon Data Breach Digest 2016Ryan Carleton
 
IBM X Force threat intelligence quarterly 1Q 2014
IBM X Force threat intelligence quarterly 1Q 2014IBM X Force threat intelligence quarterly 1Q 2014
IBM X Force threat intelligence quarterly 1Q 2014IBM Software India
 
Alert logic cloud security report
Alert logic cloud security reportAlert logic cloud security report
Alert logic cloud security reportGabe Akisanmi
 
Gbl report risk-value_2018_us_uea_v1
Gbl report risk-value_2018_us_uea_v1Gbl report risk-value_2018_us_uea_v1
Gbl report risk-value_2018_us_uea_v1Paperjam_redaction
 

Similar to 2016 data breach investigations report (20)

2016 Data Breach Investigations Report89 of breaches.docx
2016 Data  Breach Investigations Report89 of breaches.docx2016 Data  Breach Investigations Report89 of breaches.docx
2016 Data Breach Investigations Report89 of breaches.docx
 
1. What do hackers break in to the mostHackers have been increa.docx
1. What do hackers break in to the mostHackers have been increa.docx1. What do hackers break in to the mostHackers have been increa.docx
1. What do hackers break in to the mostHackers have been increa.docx
 
2017 Data Breach Investigations Report
2017 Data Breach Investigations Report2017 Data Breach Investigations Report
2017 Data Breach Investigations Report
 
Rp data breach-investigation-report-2015-en_xg
Rp data breach-investigation-report-2015-en_xgRp data breach-investigation-report-2015-en_xg
Rp data breach-investigation-report-2015-en_xg
 
Verizon DBIR-2015
Verizon DBIR-2015Verizon DBIR-2015
Verizon DBIR-2015
 
Rp data breach-investigation-report-2015-en_xg
Rp data breach-investigation-report-2015-en_xgRp data breach-investigation-report-2015-en_xg
Rp data breach-investigation-report-2015-en_xg
 
The 2014 Data Breach Investigations Report
The 2014 Data Breach Investigations ReportThe 2014 Data Breach Investigations Report
The 2014 Data Breach Investigations Report
 
rp_data-breach-investigation-report-2015-insider_en_xg
rp_data-breach-investigation-report-2015-insider_en_xgrp_data-breach-investigation-report-2015-insider_en_xg
rp_data-breach-investigation-report-2015-insider_en_xg
 
D2015 Protected-Health-Information-Data-Breach-Report
D2015 Protected-Health-Information-Data-Breach-ReportD2015 Protected-Health-Information-Data-Breach-Report
D2015 Protected-Health-Information-Data-Breach-Report
 
Financial Institutions, Merchants, and the Race Against Cyberthreats
Financial Institutions, Merchants, and the  Race Against CyberthreatsFinancial Institutions, Merchants, and the  Race Against Cyberthreats
Financial Institutions, Merchants, and the Race Against Cyberthreats
 
IBM X-Force Threat Intelligence Report 2016
IBM X-Force Threat Intelligence Report 2016IBM X-Force Threat Intelligence Report 2016
IBM X-Force Threat Intelligence Report 2016
 
Bitdefender-CSG-Report-creat7534-interactive
Bitdefender-CSG-Report-creat7534-interactiveBitdefender-CSG-Report-creat7534-interactive
Bitdefender-CSG-Report-creat7534-interactive
 
BREACH LEVEL INDEX
BREACH LEVEL INDEXBREACH LEVEL INDEX
BREACH LEVEL INDEX
 
Verizon Data Breach Digest 2016
Verizon Data Breach Digest 2016Verizon Data Breach Digest 2016
Verizon Data Breach Digest 2016
 
IBM X Force threat intelligence quarterly 1Q 2014
IBM X Force threat intelligence quarterly 1Q 2014IBM X Force threat intelligence quarterly 1Q 2014
IBM X Force threat intelligence quarterly 1Q 2014
 
Alert logic cloud security report
Alert logic cloud security reportAlert logic cloud security report
Alert logic cloud security report
 
2010 GISS EY
2010 GISS EY2010 GISS EY
2010 GISS EY
 
Gbl report risk-value_2018_us_uea_v1
Gbl report risk-value_2018_us_uea_v1Gbl report risk-value_2018_us_uea_v1
Gbl report risk-value_2018_us_uea_v1
 
Get Prepared
Get PreparedGet Prepared
Get Prepared
 
IT Security Risks Survey 2014
IT Security Risks Survey 2014IT Security Risks Survey 2014
IT Security Risks Survey 2014
 

Recently uploaded

AWS Community DAY Albertini-Ellan Cloud Security (1).pptx
AWS Community DAY Albertini-Ellan Cloud Security (1).pptxAWS Community DAY Albertini-Ellan Cloud Security (1).pptx
AWS Community DAY Albertini-Ellan Cloud Security (1).pptxellan12
 
Chennai Call Girls Porur Phone 🍆 8250192130 👅 celebrity escorts service
Chennai Call Girls Porur Phone 🍆 8250192130 👅 celebrity escorts serviceChennai Call Girls Porur Phone 🍆 8250192130 👅 celebrity escorts service
Chennai Call Girls Porur Phone 🍆 8250192130 👅 celebrity escorts servicesonalikaur4
 
Challengers I Told Ya ShirtChallengers I Told Ya Shirt
Challengers I Told Ya ShirtChallengers I Told Ya ShirtChallengers I Told Ya ShirtChallengers I Told Ya Shirt
Challengers I Told Ya ShirtChallengers I Told Ya Shirtrahman018755
 
Russian Call girl in Ajman +971563133746 Ajman Call girl Service
Russian Call girl in Ajman +971563133746 Ajman Call girl ServiceRussian Call girl in Ajman +971563133746 Ajman Call girl Service
Russian Call girl in Ajman +971563133746 Ajman Call girl Servicegwenoracqe6
 
VIP Kolkata Call Girls Salt Lake 8250192130 Available With Room
VIP Kolkata Call Girls Salt Lake 8250192130 Available With RoomVIP Kolkata Call Girls Salt Lake 8250192130 Available With Room
VIP Kolkata Call Girls Salt Lake 8250192130 Available With Roomgirls4nights
 
Networking in the Penumbra presented by Geoff Huston at NZNOG
Networking in the Penumbra presented by Geoff Huston at NZNOGNetworking in the Penumbra presented by Geoff Huston at NZNOG
Networking in the Penumbra presented by Geoff Huston at NZNOGAPNIC
 
Call Girls In Ashram Chowk Delhi 💯Call Us 🔝8264348440🔝
Call Girls In Ashram Chowk Delhi 💯Call Us 🔝8264348440🔝Call Girls In Ashram Chowk Delhi 💯Call Us 🔝8264348440🔝
Call Girls In Ashram Chowk Delhi 💯Call Us 🔝8264348440🔝soniya singh
 
Call Girls Service Chandigarh Lucky ❤️ 7710465962 Independent Call Girls In C...
Call Girls Service Chandigarh Lucky ❤️ 7710465962 Independent Call Girls In C...Call Girls Service Chandigarh Lucky ❤️ 7710465962 Independent Call Girls In C...
Call Girls Service Chandigarh Lucky ❤️ 7710465962 Independent Call Girls In C...Sheetaleventcompany
 
Russian Call girls in Dubai +971563133746 Dubai Call girls
Russian  Call girls in Dubai +971563133746 Dubai  Call girlsRussian  Call girls in Dubai +971563133746 Dubai  Call girls
Russian Call girls in Dubai +971563133746 Dubai Call girlsstephieert
 
Delhi Call Girls Rohini 9711199171 ☎✔👌✔ Whatsapp Hard And Sexy Vip Call
Delhi Call Girls Rohini 9711199171 ☎✔👌✔ Whatsapp Hard And Sexy Vip CallDelhi Call Girls Rohini 9711199171 ☎✔👌✔ Whatsapp Hard And Sexy Vip Call
Delhi Call Girls Rohini 9711199171 ☎✔👌✔ Whatsapp Hard And Sexy Vip Callshivangimorya083
 
FULL ENJOY Call Girls In Mayur Vihar Delhi Contact Us 8377087607
FULL ENJOY Call Girls In Mayur Vihar Delhi Contact Us 8377087607FULL ENJOY Call Girls In Mayur Vihar Delhi Contact Us 8377087607
FULL ENJOY Call Girls In Mayur Vihar Delhi Contact Us 8377087607dollysharma2066
 
Hot Call Girls |Delhi |Hauz Khas ☎ 9711199171 Book Your One night Stand
Hot Call Girls |Delhi |Hauz Khas ☎ 9711199171 Book Your One night StandHot Call Girls |Delhi |Hauz Khas ☎ 9711199171 Book Your One night Stand
Hot Call Girls |Delhi |Hauz Khas ☎ 9711199171 Book Your One night Standkumarajju5765
 
VIP Kolkata Call Girl Salt Lake 👉 8250192130 Available With Room
VIP Kolkata Call Girl Salt Lake 👉 8250192130  Available With RoomVIP Kolkata Call Girl Salt Lake 👉 8250192130  Available With Room
VIP Kolkata Call Girl Salt Lake 👉 8250192130 Available With Roomishabajaj13
 
Hot Service (+9316020077 ) Goa Call Girls Real Photos and Genuine Service
Hot Service (+9316020077 ) Goa  Call Girls Real Photos and Genuine ServiceHot Service (+9316020077 ) Goa  Call Girls Real Photos and Genuine Service
Hot Service (+9316020077 ) Goa Call Girls Real Photos and Genuine Servicesexy call girls service in goa
 
'Future Evolution of the Internet' delivered by Geoff Huston at Everything Op...
'Future Evolution of the Internet' delivered by Geoff Huston at Everything Op...'Future Evolution of the Internet' delivered by Geoff Huston at Everything Op...
'Future Evolution of the Internet' delivered by Geoff Huston at Everything Op...APNIC
 
Call Girls In Saket Delhi 💯Call Us 🔝8264348440🔝
Call Girls In Saket Delhi 💯Call Us 🔝8264348440🔝Call Girls In Saket Delhi 💯Call Us 🔝8264348440🔝
Call Girls In Saket Delhi 💯Call Us 🔝8264348440🔝soniya singh
 
Russian Call Girls in Kolkata Samaira 🤌 8250192130 🚀 Vip Call Girls Kolkata
Russian Call Girls in Kolkata Samaira 🤌  8250192130 🚀 Vip Call Girls KolkataRussian Call Girls in Kolkata Samaira 🤌  8250192130 🚀 Vip Call Girls Kolkata
Russian Call Girls in Kolkata Samaira 🤌 8250192130 🚀 Vip Call Girls Kolkataanamikaraghav4
 
Pune Airport ( Call Girls ) Pune 6297143586 Hot Model With Sexy Bhabi Ready...
Pune Airport ( Call Girls ) Pune  6297143586  Hot Model With Sexy Bhabi Ready...Pune Airport ( Call Girls ) Pune  6297143586  Hot Model With Sexy Bhabi Ready...
Pune Airport ( Call Girls ) Pune 6297143586 Hot Model With Sexy Bhabi Ready...tanu pandey
 

Recently uploaded (20)

AWS Community DAY Albertini-Ellan Cloud Security (1).pptx
AWS Community DAY Albertini-Ellan Cloud Security (1).pptxAWS Community DAY Albertini-Ellan Cloud Security (1).pptx
AWS Community DAY Albertini-Ellan Cloud Security (1).pptx
 
Chennai Call Girls Porur Phone 🍆 8250192130 👅 celebrity escorts service
Chennai Call Girls Porur Phone 🍆 8250192130 👅 celebrity escorts serviceChennai Call Girls Porur Phone 🍆 8250192130 👅 celebrity escorts service
Chennai Call Girls Porur Phone 🍆 8250192130 👅 celebrity escorts service
 
Challengers I Told Ya ShirtChallengers I Told Ya Shirt
Challengers I Told Ya ShirtChallengers I Told Ya ShirtChallengers I Told Ya ShirtChallengers I Told Ya Shirt
Challengers I Told Ya ShirtChallengers I Told Ya Shirt
 
Russian Call girl in Ajman +971563133746 Ajman Call girl Service
Russian Call girl in Ajman +971563133746 Ajman Call girl ServiceRussian Call girl in Ajman +971563133746 Ajman Call girl Service
Russian Call girl in Ajman +971563133746 Ajman Call girl Service
 
VIP Kolkata Call Girls Salt Lake 8250192130 Available With Room
VIP Kolkata Call Girls Salt Lake 8250192130 Available With RoomVIP Kolkata Call Girls Salt Lake 8250192130 Available With Room
VIP Kolkata Call Girls Salt Lake 8250192130 Available With Room
 
Networking in the Penumbra presented by Geoff Huston at NZNOG
Networking in the Penumbra presented by Geoff Huston at NZNOGNetworking in the Penumbra presented by Geoff Huston at NZNOG
Networking in the Penumbra presented by Geoff Huston at NZNOG
 
Call Girls In Ashram Chowk Delhi 💯Call Us 🔝8264348440🔝
Call Girls In Ashram Chowk Delhi 💯Call Us 🔝8264348440🔝Call Girls In Ashram Chowk Delhi 💯Call Us 🔝8264348440🔝
Call Girls In Ashram Chowk Delhi 💯Call Us 🔝8264348440🔝
 
Call Girls Service Chandigarh Lucky ❤️ 7710465962 Independent Call Girls In C...
Call Girls Service Chandigarh Lucky ❤️ 7710465962 Independent Call Girls In C...Call Girls Service Chandigarh Lucky ❤️ 7710465962 Independent Call Girls In C...
Call Girls Service Chandigarh Lucky ❤️ 7710465962 Independent Call Girls In C...
 
Russian Call girls in Dubai +971563133746 Dubai Call girls
Russian  Call girls in Dubai +971563133746 Dubai  Call girlsRussian  Call girls in Dubai +971563133746 Dubai  Call girls
Russian Call girls in Dubai +971563133746 Dubai Call girls
 
Call Girls In South Ex 📱 9999965857 🤩 Delhi 🫦 HOT AND SEXY VVIP 🍎 SERVICE
Call Girls In South Ex 📱  9999965857  🤩 Delhi 🫦 HOT AND SEXY VVIP 🍎 SERVICECall Girls In South Ex 📱  9999965857  🤩 Delhi 🫦 HOT AND SEXY VVIP 🍎 SERVICE
Call Girls In South Ex 📱 9999965857 🤩 Delhi 🫦 HOT AND SEXY VVIP 🍎 SERVICE
 
Delhi Call Girls Rohini 9711199171 ☎✔👌✔ Whatsapp Hard And Sexy Vip Call
Delhi Call Girls Rohini 9711199171 ☎✔👌✔ Whatsapp Hard And Sexy Vip CallDelhi Call Girls Rohini 9711199171 ☎✔👌✔ Whatsapp Hard And Sexy Vip Call
Delhi Call Girls Rohini 9711199171 ☎✔👌✔ Whatsapp Hard And Sexy Vip Call
 
FULL ENJOY Call Girls In Mayur Vihar Delhi Contact Us 8377087607
FULL ENJOY Call Girls In Mayur Vihar Delhi Contact Us 8377087607FULL ENJOY Call Girls In Mayur Vihar Delhi Contact Us 8377087607
FULL ENJOY Call Girls In Mayur Vihar Delhi Contact Us 8377087607
 
Hot Call Girls |Delhi |Hauz Khas ☎ 9711199171 Book Your One night Stand
Hot Call Girls |Delhi |Hauz Khas ☎ 9711199171 Book Your One night StandHot Call Girls |Delhi |Hauz Khas ☎ 9711199171 Book Your One night Stand
Hot Call Girls |Delhi |Hauz Khas ☎ 9711199171 Book Your One night Stand
 
VIP Kolkata Call Girl Salt Lake 👉 8250192130 Available With Room
VIP Kolkata Call Girl Salt Lake 👉 8250192130  Available With RoomVIP Kolkata Call Girl Salt Lake 👉 8250192130  Available With Room
VIP Kolkata Call Girl Salt Lake 👉 8250192130 Available With Room
 
Hot Service (+9316020077 ) Goa Call Girls Real Photos and Genuine Service
Hot Service (+9316020077 ) Goa  Call Girls Real Photos and Genuine ServiceHot Service (+9316020077 ) Goa  Call Girls Real Photos and Genuine Service
Hot Service (+9316020077 ) Goa Call Girls Real Photos and Genuine Service
 
'Future Evolution of the Internet' delivered by Geoff Huston at Everything Op...
'Future Evolution of the Internet' delivered by Geoff Huston at Everything Op...'Future Evolution of the Internet' delivered by Geoff Huston at Everything Op...
'Future Evolution of the Internet' delivered by Geoff Huston at Everything Op...
 
Call Girls In Saket Delhi 💯Call Us 🔝8264348440🔝
Call Girls In Saket Delhi 💯Call Us 🔝8264348440🔝Call Girls In Saket Delhi 💯Call Us 🔝8264348440🔝
Call Girls In Saket Delhi 💯Call Us 🔝8264348440🔝
 
Russian Call Girls in Kolkata Samaira 🤌 8250192130 🚀 Vip Call Girls Kolkata
Russian Call Girls in Kolkata Samaira 🤌  8250192130 🚀 Vip Call Girls KolkataRussian Call Girls in Kolkata Samaira 🤌  8250192130 🚀 Vip Call Girls Kolkata
Russian Call Girls in Kolkata Samaira 🤌 8250192130 🚀 Vip Call Girls Kolkata
 
Pune Airport ( Call Girls ) Pune 6297143586 Hot Model With Sexy Bhabi Ready...
Pune Airport ( Call Girls ) Pune  6297143586  Hot Model With Sexy Bhabi Ready...Pune Airport ( Call Girls ) Pune  6297143586  Hot Model With Sexy Bhabi Ready...
Pune Airport ( Call Girls ) Pune 6297143586 Hot Model With Sexy Bhabi Ready...
 
Rohini Sector 6 Call Girls Delhi 9999965857 @Sabina Saikh No Advance
Rohini Sector 6 Call Girls Delhi 9999965857 @Sabina Saikh No AdvanceRohini Sector 6 Call Girls Delhi 9999965857 @Sabina Saikh No Advance
Rohini Sector 6 Call Girls Delhi 9999965857 @Sabina Saikh No Advance
 

2016 data breach investigations report

  • 1. 2016 Data Breach Investigations Report 89% of breaches had a financial or espionage motive.
  • 2. Verizon 2016 Data Breach Investigations Report i 2016 DBIR Contributors (See Appendix B for a detailed list.)
  • 3. Verizon 2016 Data Breach Investigations Report ii
  • 4. Verizon 2016 Data Breach Investigations Report iii Table of Contents 2016 DBIR—Introduction............................................................................................................. 1 Victim demographics....................................................................................................................3 Breach trends................................................................................................................................ 6 Points of focus.............................................................................................................................12 Vulnerabilities...............................................................................................................................13 Phishing.......................................................................................................................................... 17 Credentials...................................................................................................................................20 Incident classification patterns.............................................................................................. 22 Web App Attacks.............................................................................................................. 27 Point-of-Sale Intrusions..................................................................................................31 Insider and Privilege Misuse.........................................................................................35 Miscellaneous Errors......................................................................................................40 Physical Theft and Loss.................................................................................................43 Crimeware..........................................................................................................................45 Payment Card Skimmers................................................................................................49 Cyber-espionage.............................................................................................................. 52 Denial-of-Service Attacks.............................................................................................56 Everything Else.................................................................................................................60 Wrap up......................................................................................................................................... 62 Varieties of impact.....................................................................................................................64 Appendix A: Post-compromise fraud ..................................................................................66 Appendix B: Contributing organizations..............................................................................71 Appendix C: The Taupe Book................................................................................................. 72 Appendix D: Attack graphs.......................................................................................................74 Appendix E: Methodology and VERIS resources.............................................................. 76 Appendix F: Year in review...................................................................................................... 78
  • 5. Verizon 2016 Data Breach Investigations Report 1 Well here we are again, and it is time to take the annual journey into our collection of real-world data breaches and information security incidents from the prior year. We have published this report nine times1 and we truly appreciate you spending your valuable time with us, whether you have been with us since our humble, pie-chart-centric beginnings or if this is your first read. We would be remiss if we did not begin by acknowledging the organizations that contributed data (and time) to this publication. Simply stated, we thank you for helping to make this possible. For a full list of contributors, mosey over to Appendix B. The incident data is the workhorse of this report and is used to build out all the information within the Breach Trends and Incident Classification Patterns sections. We use non-incident security data to paint a fuller picture in the patterns as well as in stand-alone research. Any opportunity to take several organizations’ data and combine them for a research topic was pursued. The Gestalt principles in action! The nine incident classification patterns we identified back in the 2014 report still reign supreme. And while there are no drastic shifts that have established a show-stopping talking point when looking at the patterns as a whole, we have searched for interesting tidbits in the actions that comprise them. This year’s dataset is made up of over 100,000 incidents, of which 3,141 were confirmed data breaches. Of these, 64,199 incidents and 2,260 breaches comprise the finalized dataset that was used in the analysis and figures throughout the report. We address the reasons for culling the dataset in Victim Demographics and provide additional details when we discuss motives in Breach Trends. Of course, we would never suggest that every last security event of 2015 is in this report. We acknowledge sample bias, and provide information about our methodology as well as links to resources that we encourage you to look into to help collect and analyze incident data within your own organization, in Appendix E. We will also acknowledge what isn’t in this report. For those looking for proclamations about this being the year that mobile attacks bring us to our knees or that the Internet of Things (IoT) is coming to kill us all, you will be disappointed. We still do not have significant real-world data on these 1 Nine times? Nine times. 2016 DBIR—Introduction “It’s like déjà vu, all over again.” —Yogi Berra The nine incident classification patterns we identified in 2014 still reign supreme.
  • 6. Verizon 2016 Data Breach Investigations Report 2 technologies as the vector of attack on organizations.2 If you feel we are in error, put down the torches and pitchforks and share any breach data that you have. We are always looking for avenues to shine lights into areas in which we may not have sufficient illumination. Also, their absence is not a suggestion to ignore these areas in your risk management decision-making. The report is designed so you can enjoy it like a prog-rock concept album, from beginning to end, or feel free to bounce around (the room). Enjoy the Breach Trends section for all your figure and chart needs. Get some knowledge on a few of the concepts that stretch across several patterns in our Points of Focus section and for those who want more factoids, pop over to the appendices and give our Taupe Book section a look. 2 Yes, we are aware of the xCode hack, but without confirmed organizations that suffered an attribute loss it will not be an influencer of this report.
  • 7. Verizon 2016 Data Breach Investigations Report 3 Before we get into the adversaries behind the incidents and breaches that both underpin this report and keep information security professionals busy, let’s acknowledge who is on the receiving end of these attacks. The 2016 report features incidents affecting organizations in 82 countries and across a myriad of industries. No locale, industry or organization is bulletproof when it comes to the compromise of data. Some are notably more represented than others and this is not an indictment that the public sector is any less secure than any other industry. As with prior years, the numbers that follow are heavily influenced by US agency reporting requirements, which open up the fire hose of minor security incidents. Tables 1 and 2 show the number of incidents and breaches by victim industry and size. You may have noticed that the totals in Tables 1 and 2 feature fewer incidents and breaches than the previously advertised 100,000 and 3,141. None are typos—there are a couple of filters applied to the original total. We excluded incidents involving devices repurposed as infrastructure to be used against another target (more on this in the Secondary Motive sidebar in Breach Trends). We also had numerous incidents that failed the “You must be this detailed to enjoy this ride” test.3 3 Complexity and completeness scoring is discussed in Appendix E: Methodology and VERIS resources. Victim demographics Figure 1. Countries represented in combined caseload. No locale, industry or organization is bulletproof when it comes to the compromise of data.
  • 8. Verizon 2016 Data Breach Investigations Report 4 When we zoom in on just confirmed breaches, the numbers are less astronomical and we see industries such as Accommodation and Retail accounting for a more significant percentage of breaches (as opposed to incidents). This is unsurprising as they process information which is highly desirable to financially motivated criminals. Industry Total Small Large Unknown Accommodation (72) 362 140 79 143 Administrative (56) 44 6 3 35 Agriculture (11) 4 1 0 3 Construction (23) 9 0 4 5 Educational (61) 254 16 29 209 Entertainment (71) 2,707 18 1 2,688 Finance (52) 1,368 29 131 1,208 Healthcare (62) 166 21 25 120 Information (51) 1,028 18 38 972 Management (55) 1 0 1 0 Manufacturing (31-33) 171 7 61 103 Mining (21) 11 1 7 3 Other Services (81) 17 5 3 9 Professional (54) 916 24 9 883 Public (92) 47,237 6 46,973 258 Real Estate (53) 11 3 4 4 Retail (44-45) 159 102 20 37 Trade (42) 15 3 7 5 Transportation (48-49) 31 1 6 24 Utilities (22) 24 0 3 21 Unknown 9,453 113 1 9,339 Total 64,199 521 47,408 16,270 Table 1. Number of security incidents by victim industry and organization size, 2015 dataset.
  • 9. Verizon 2016 Data Breach Investigations Report 5 Industry Total Small Large Unknown Accommodation (72) 282 136 10 136 Administrative (56) 18 6 2 10 Agriculture (11) 1 0 0 1 Construction (23) 4 0 1 3 Educational (61) 29 3 8 18 Entertainment (71) 38 18 1 19 Finance (52) 795 14 94 687 Healthcare (62) 115 18 20 77 Information (51) 194 12 12 170 Management (55) 0 0 0 0 Manufacturing (31-33) 37 5 11 21 Mining (21) 7 0 6 1 Other Services (81) 11 5 2 4 Professional (54) 53 10 4 39 Public (92) 193 4 122 67 Real Estate (53) 5 3 0 2 Retail (44-45) 137 96 12 29 Trade (42) 4 2 2 0 Transportation (48-49) 15 1 3 11 Utilities (22) 7 0 0 7 Unknown 270 109 0 161 Total 2,260 447 312 1501 Small = organizations with fewer than 1,000 employees, Large = organizations with 1,001+ employees. Table 2. Number of security incidents with confirmed data loss by victim industry and organization size, 2015 dataset. Breaches vs. Incidents This report uses the following definitions: Incident: A security event that compromises the integrity, confidentiality or availability of an information asset. Breach: An incident that results in the confirmed disclosure (not just potential exposure) of data to an unauthorized party.
  • 10. Verizon 2016 Data Breach Investigations Report 6 Breach trends Playing a part on the blue team in information security can, to a very small degree, be compared to the lot of a hapless soldier. The soldier is told to guard a certain hill and to keep it at all costs. However, he is not told who his enemy may be, what they look like, where they are coming from, or when (or how) they are likely to strike. To ride this analogous horse a bit further, the soldier is given a hand-me-down rifle with only a few rounds of ammunition to fulfill his task. It seems a bit unfair really—even the American Revolution got Paul Revere. With that in mind, we hope that this section and the facts and figures contained in it will go some way toward making you better prepared than our friend mentioned above. After all, “forewarned is forearmed.” A brief primer on VERIS This section, and many that follow, are based on the Vocabulary for Event Recording and Incident Sharing, or VERIS for short. VERIS is a framework to record and share your security events, incidents and breaches in a repeatable manner. It asks the question, what threat Actor took what Action on what Asset compromising what Attribute? We commonly refer to those as the 4As. In addition to the 4As, it captures timeline, victim demographics, discovery method, impact data and much more. There are a lot of tools available for VERIS. Methods for creating, importing and analyzing the data are all freely available. More on that in Appendix E: Methodology and VERIS resources. Be prepared: forewarned is forearmed.
  • 11. Verizon 2016 Data Breach Investigations Report 7 Figure 2. Percent of breaches per threat actor category over time, (n=8,158) Figure 3. Percent of breaches per threat actor motive over time, (n=6,762) For those who have read the DBIR before, Figure 2 will come as no surprise. Again, the Actors in breaches are predominantly external. While this goes against InfoSec folklore, the story the data consistently tells is that, when it comes to data disclosure, the attacker is not coming from inside the house. And let’s face it, no matter how big your house may be there are more folks outside it than there are inside it. Why are these people attacking me? So why do the Actors do what they do? Money, loot, cash, filthy lucre, greed … get the idea? In fact, it can be money even when it’s not money (see Secondary Motive sidebar for more). In the 2013 DBIR it appeared that perhaps the reigning lothario of “financial gain” was in danger of being cast aside in favor of “espionage.” Could such a thing come to pass? No, not really. 2010 2011 2012 2013 2014 2015 0% 20% 40% 60% 80% 100% 25% 50% 75% 100% 2009 2010 2011 2012 2013 2014 2015 n Financial n Espionage n Fun n Ideology n Grudge n Everything Else n Partner n Internal n Collusion n External
  • 12. Verizon 2016 Data Breach Investigations Report 8 There was never any real danger of the financial motive losing its prominence, as even at its peak, espionage remained a far distant second. As illustrated by Figure 3, breaches with a financial motive dominate everything else, including espionage and fun. Pistols at dawn, or knives at noon? Now that we know at least a very little bit more about who’s coming after us, the next logical question is: how are they armed? As a glance at Figures 4 and 5 can show you, it is often with phishing, which leads to other events that are not going to make your day. We also see the calling card of Point-of-Sale (POS) attacks. No need to go get in the weeds on this here, as these topics will reappear quite a bit in the pages to follow. Now, to be fair to the other hardworking threat action types in our list, phishing (and the higher level threat action category of Social) was given a leg up this year by the ‘Dridex’ campaign. We had several contributors who combined to provide a great amount of insight into that naughtiness and this skewed the results somewhat. Figure 4. Number of breaches per threat action category over time, (n=9,009) Secondary motive Many of the attacks discussed in this report have what we call a ‘secondary motive’, which we define as when the motive of the incident is to ‘aid in a different attack’. We filter these out of the report because it would overshadow everything else if we didn’t. One example is where the bad guy compromises a web server to repurpose it to his own uses (e.g., hosting malicious files or using it in a spam or DoS botnet). Even criminals need infrastructure. “It is a far, far better thing” that someone else manages it for free, rather than having to pay for it yourself. We had thousands of these incidents, as well as poorly configured NTP and DNS servers, leveraged to launch reflective DoS attacks. 0 500 1,000 1,500 2005 2007 2009 2011 2013 2015 Breachcount n Hacking n Malware n Social n Error n Misuse n Physical n Environmental
  • 13. Verizon 2016 Data Breach Investigations Report 9 Nevertheless, at this point, we think both Phishing and Point-of-Sale could safely say, in their best Ron Burgundy voice, “You might have heard of me, I’m kind of a big deal.” Due to this rock-star status, we’re going to dig a little deeper into POS attacks later in the Patterns section and also in the Post- Compromise Fraud write-up. Likewise, we discuss phishing in greater detail in the Phishing section and Cyber-espionage pattern. We even have a section on credentials this year. Credentials have made numerous cameo appearances in this report for years, but never before have they had a speaking part. (Always a bridesmaid, never a bride.) The many facets of assets Guess what? When the bad guys’ actions are centered around phishing and POS devices, the asset varieties displayed in Figure 6 reflect this. That lovely “Person” line trending up is due to the human asset falling victim to phishing attacks4 . The “User device” line upward trend is based on desktops being infected with malware, as well as POS terminals getting popped. 4 In VERIS we model this stage of the attack as a loss of Integrity based on the influencing of human behavior. Figure 5. Threat action varieties in breaches over time, (n=7,717) 2009 2012 2015 Breachcount 2010 2011 2013 2014 - 20 - 40 - 60 - 80 - 100 - 50 - 100 - 150 - 200 - 250 - 100 - 200 - 300 - 400 - 500 - 50 - 100 - 150 - 200 - 100 - 200 - 300 - 400 - 500 - 100 - 200 - 300 - 400 - 500 200 - 400 - 600 - 800 - n Malware - C2 n Hacking - Use of stolen creds n Malware - Export data n Hacking - Use of backdoor or C2 n Social - Phishing n Malware - Spyware/Keylogger n Malware - RAM n Hacking - Brute force n Malware - Backdoor 0% 10% 20% 30% 40% 50% 2009 20122010 2011 2013 2014 2015 Figure 6. Percent of breaches per asset category over time, (n=7,736) n Server n User Device n Person n Media n Kiosk/Terminal n Network
  • 14. Verizon 2016 Data Breach Investigations Report 10 Mick was wrong—time is not on our side. Rome wasn’t built in a day, but data breaches frequently were. Figure 7 illustrates how quickly the threat Actor gets in and out of your network. The large spikes, however, are driven by very specific threats. The compromise time of minutes, while depressing to look at, is actually another reflection of the ubiquitous ‘Dridex’ breaches in this year’s dataset. As previously alluded to, these cases begin with a phish, featuring an attachment whose mission in its malware life is to steal credentials. If you have legit creds, it doesn’t take a very long time to unlock the door, walk in and help yourself to what’s in the fridge. Conversely, the exfiltration time being so weighted in the ‘days’ category is heavily representative of attacks against POS devices where malware is dropped to capture, package and execute scheduled exports. Bad news travels fast, with one exception. We like this next graph—one line goes one way and the other line goes the other way. Actually we would like it even more if the lines took different paths. The bad news is, the detection deficit in Figure 8 is getting worse. Figure 7. Time to compromise and exfiltration. <1%6% 81.9% <1% 11% <1% 67.8% 2.5% 21.2% <1% 7.1% <1% compromisen=1,177exfiltrationn=326 Seconds Minutes Hours Days Weeks Months Years 0% 25% 50% 75% 100% %where“daysorless” 67% 56% 55% 61% 67% 62% 67% 89% 62% 76% 62% 84% 2005 2007 2009 2011 2013 2015 Figure 8. Percent of breaches where time to compromise (green)/time to discovery (blue) was days or less n Time to Compromise n Time to Discover
  • 15. Verizon 2016 Data Breach Investigations Report 11 In the 2015 report, we mentioned that there was some improvement in discovery in the ‘days or less’ category, however, that improvement was short-lived. We also pointed out that we would need more than one year’s data to verify that as a definite trend and sadly we did not get that verification. Moreover, readers with excellent memories will notice that the deficit in 2014 grew from last year’s report. Data for the year-to-year graphs is filtered by incident year (i.e., when the compromise occurred). We continue to add incidents and breaches to prior calendar years post-report to enrich our data. Also, some breaches will occur late in the year and are discovered the next year. To add another ray to this sunbeam, attackers are getting even quicker at compromising their victims. When you review the leading threat actions again, this really won’t come as a surprise. The phishing scenario is going to work quickly, with the dropping of malware via malicious attachments occurring within seconds. Physical compromises of ATMs and gas pumps also happen in seconds. In the majority of confirmed data breaches, the modus operandi of nation-states as well as financially motivated attackers is to establish control via malware and, when successful, it is lightning fast. As this figure is for confirmed breaches only, it makes sense that the time to compromise is almost always days or less (if not minutes or less). If—and some have called “if” the biggest word in the language—there’s any good news, it’s that the number of breaches staying open months or more continues to decline slightly. When it comes to external5 breach discovery, fraud detection and law enforcement notification are battling it out like the Celtics and Lakers in the ‘80s. Figure 9 shows that law enforcement will raise the banner for 2015, due (again) to a botnet takedown and the subsequent notifications to members of the botnet. All in all, external notification is up. And when you have to wait on external detection to tell you you’re popped, it’s probably too late to keep the horses in the barn. 5 External is everything but internal detection and when a partner supplies a monitoring or AV service. The time to compromise is almost always days or less, if not minutes or less. 0% 20% 40% 60% 80% 2005 2007 2009 2011 2013 2015 Figure 9. Breach discovery methods over time, (n=6,133). n Law Enforcement n Fraud Detection n Third Party n Internal
  • 16. Verizon 2016 Data Breach Investigations Report 12 One last thing before we get to the patterns. There are a couple of topics that are omnipresent in many of the patterns that we use to classify incidents. While they will receive credit where credit is due, in the pattern sections, we feel that we also need to put the spotlight on them here. We have numerous breaches where we can infer that some Common Vulnerabilities and Exposures (CVE) were used in order for the attack to advance. Hey, we’re looking at you, drive-by downloads! Unfortunately, we don’t have a tremendous amount of CVE data in our corpus, either because it was not measured or was unable to be identified. This lack of detail makes us an embarrassment of sad pandas. (Yes, we wanted to say “sleuth”, but apparently we can’t. Look it up.) Luckily we have contributors in the vulnerability space that can lighten our mood. Phishing has continued to trend upward (like spawning salmon?) and is found in the most opportunistic attacks as well as the sophisticated nation state tomfoolery. We feature a section where we dive into the human element a bit deeper, with some data on our innate need to click stuff. Lastly, we strike a deceased equine a bit more with a section on credentials (of the static variety). Don’t get us wrong—passwords are great, kind of like salt. Wonderful as an addition to something else, but you wouldn’t consume it on its own. Points of focus We don’t have a tremendous amount of CVE data because it wasn’t measured or was unable to be identified.
  • 17. Verizon 2016 Data Breach Investigations Report 13 Methodology The visualizations and statements regarding rates of exploitation in this section are underpinned by vulnerability exploitation data provided by Kenna Security. This dataset spans millions of successful real-world exploitations, and is derived from hunting down exploitation signatures in security information and event management (SIEM) logs and correlating those with vulnerability scan data to find pairings that would be indicative of a successful exploitation. The tortoise and the hare Vulnerability management has been a Sisyphean endeavor for decades. Attacks come in millions, exploits are automated and every enterprise is subject to the wrath of the quick-to-catch-on hacker. What’s worse, new vulnerabilities come out every day. Since the first DBIR, we’ve been advocating the turtle’s approach to vulnerability management (slow and steady wins the race). This year we revisit this data to see whether the trends hold, but in typical DBIR fashion, we dig a little deeper, to look at not just how attackers are interacting with vulnerabilities (exploitation), but also how well and how fast enterprises are executing remediation. If we can measure both of these routinely, then we can provide much-needed answers about how the tortoise won the race—and so learn how to close the gap between attackers and enterprises. Vulnerabilities New vulnerabilities come out every day. At a glance Description A look into software vulnerabilities, whether we are making any progress in addressing them and ways to improve. Contributors Kenna Security (formerly Risk I/O) collaborated with us again to leverage their vulnerability and exploitation data. We also utilized vulnerability scan data provided by Beyond Trust, Qualys and Tripwire in support of this section. Key findings Older vulnerabilities are still heavily targeted; a methodical patch approach that emphasizes consistency and coverage is more important than expedient patching.
  • 18. Verizon 2016 Data Breach Investigations Report 14 Slow and steady—but how slow? This year we take a different approach to measuring the time from publication to exploitation. Figure 10 is a box plot, which plots the time between publication and the first observed successful exploit by vendors.6 We can see that Adobe vulnerabilities are exploited quickly, while Mozilla vulnerabilities take much longer to exploit after disclosure. Half of all exploitations happen between 10 and 100 days after the vulnerability is published, with the median around 30 days. This provides us with some general guidelines on which software vulnerabilities to prioritize along with some guidance on time-to-patch targets. Treading water Figure 11 shows the number of vulnerabilities opened each week minus the number of vulnerabilities (aka “vulns”) closed, scaled by the number of assets in the dataset during each week of 2015. When the line is above zero, it means that more vulns are being opened than closed (new vulns disclosed, more 6 The blue boxes in Figure 10 represent 50% of the values for a given category and the gray line within the box is the median value. The dots represent individual values. Figure 10. Time to first-known exploitation by vulnerability category. -20 20 60 100 140 180 220 260 MozillaAppleOpenSSLOracleMicrosoft Vendor Daystofirstexploitation AbobeGrand Total 0 -15 -10 -5 0 5 10 15 20 25 30 4 8 12 16 20 24 3228 36 40 44 48 52 Week Normalized,net,vulnerabilities Figure 11. Delta of number of vulnerabilities opened each week and number closed.
  • 19. Verizon 2016 Data Breach Investigations Report 15 machines entering the environment, new software installed). When it’s below zero, remediation efforts are driving down vulnerability counts faster than new vulns are entering the enterprise. Basically, we confirmed across multiple datasets that we are treading water—we aren’t sinking in new vulnerabilities, but we’re also not swimming to the land of instantaneous remediation and vuln-free assets. However, all that patching is for naught if we’re not patching the right things. If we’re going to tread, let’s tread wisely. What should we mitigate? Hacker economics. So what are the right things? The 2015 DBIR gave us an idea and since then, not much has changed. Revisiting last year’s trends, we find that the two golden rules of vulnerabilities still hold. First, Figure 12 arranges CVEs according to publication year and gives a count of CVEs for each year. While 2015 was no chump when it came to successfully exploited CVEs, the tally of really old CVEs which still get exploited in 2015 suggests that the oldies are still goodies. Hackers use what works and what works doesn’t seem to change all that often.7 Secondly, attackers automate certain weaponized vulnerabilities and spray and pray them across the internet, sometimes yielding incredible success. The distribution is very similar to last year, with the top 10 vulnerabilities accounting for 85% of successful exploit traffic.8 While being aware of and fixing these mega-vulns is a solid first step, don’t forget that the other 15% consists of over 900 CVEs, which are also being actively exploited in the wild. 7 Astute and frequent readers of the DBIR will notice one more gem in this chart—last year, the numbers of published CVEs exploited were lower across the board—and this year, we have more and better data. Those newly exploited CVEs however, are mostly—and consistently—older than one year. 8 CVE-2001-0876, CVE-2001-0877, CVE-2002-0953, CVE-2001-0680, CVE-2002-1054, CVE-2015-0204, CVE-2015-1637, CVE-2003-0818, CVE-2002-0126, CVE-1999-1058. CVE publication date CVEssuccessfullyexploitedin2015 100 80 60 40 20 0 2015 2013 2011 2009 2007 2005 2003 2001 1999 Figure 12. Count of CVEs exploited in 2015 by CVE publication date. All that patching is for naught if we’re not patching the right things.
  • 20. Verizon 2016 Data Breach Investigations Report 16 Can’t solve everything In Figure 13, we see that during 2015, vulnerabilities published in 2015 and 2014 were being patched. After that though, the vulnerabilities begin to drop off and really hit a steady state. This gets at a core and often ignored vulnerability management constraint—sometimes you just can’t fix a vulnerability—be it because of a business process, a lack of a patch, or incompatibilities. At that point, for whatever reason, you may have to live with those residual vulnerabilities. It’s important to realize that mitigation is often just as useful as remediation—and sometimes it’s your only option. Recommended controls Knowledge is power. Establish a process for vulnerability remediation that targets vulnerabilities which attackers are exploiting in the wild, followed by vulnerabilities with known exploits or proof-of-concept code. Have a Plan B. If you have a system that cannot be patched or receive the latest-and-greatest software update, identify it, and apply other risk mitigations in the form of configuration changes or isolation. Discuss a plan on how the device(s) could be replaced without causing severe business disruption. At your service Vulnerability scanning is also useful in identifying new devices and new services. Review scan-to-scan changes as another control to identify unknown devices and deviations from standard configurations. 400M 300M 200M 100M 0M Year remediated vulnerability was published Numberofvulnerabilitiesremediated 2015 ’13 ’11 ’09 ’07 ’05 ’03 ’01 ’99 ’97 Figure 13. Closure rate of CVEs by CVE publication date. Mitigation is often just as useful as remediation—and sometimes your only option.
  • 21. Verizon 2016 Data Breach Investigations Report 17 Phishing You can’t fool all the people all the time. Or can you? Social engineering in its basic form is simply to dupe or trick someone into doing something they would not otherwise do (not unlike some online dating). Social tactics can take many forms such as pretexting,9 elicitation (the subtle art of extracting information from a subject via conversation), baiting (planting infected media in victim areas), and a myriad of other lowdown and dirty tricks. However, by far its most successful variety is phishing, which as the name implies is malicious correspondence trying to get the recipient to take the bait in the form of an attachment or embedded link. It is important to note that ‘pretexting’ via email (a back-and-forth dialogue leveraging an invented scenario to gain a certain end) and a phishing email are similar, but not the same. In the case of a pretexting email, the criminal is primarily purporting to be someone they are not, usually within the victim organization (e.g., the CFO who instructs the victim to approve a fraudulent Automated Clearing House (ACH) transfer). Bummed is what you are… …when you click on that attachment and get owned. The basic structure of phishing attacks remains the same—user clicks, malware drops, foothold is 9 I’m Frieda's boss. The majority of phishing cases feature phishing as a means to install persistent malware. At a glance Description A form of social engineering in which a message, typically an email, with a malicious attachment or link is sent to a victim with the intent of tricking the recipient to open an attachment. Contributors Anti-Phishing Working Group, Lares Consulting, SANS Securing the Human and Wombat Security provided the non-incident data for this section. Top patterns Everything Else, Web App Attacks, Cyber-espionage Frequency 9,576 total incidents, 916 with confirmed data disclosure. Key findings 13% of people tested click on a phishing attachment; median time to click is very short.
  • 22. Verizon 2016 Data Breach Investigations Report 18 gained. There are still cases where the phishing email leads users to phony sites, which are used to capture user input, but the majority of phishing cases in our data feature phishing as a means to install persistent malware. The victim opens the email, sees the attachment that contains the malware du jour and says “That file looks good, I’ll have that”. What happens next is dictated by the end goal of the phisher. “What we have here is a failure to communicate.” Apparently, the communication between the criminal and the victim is much more effective than the communication between employees and security staff. We combined over eight million results of sanctioned phishing tests in 2015 from multiple security awareness vendors aiming to fix just that. Figure 14 is jam-packed with information. In this year’s dataset, 30% of phishing messages were opened by the target across all campaigns.10 “But wait, there’s more!” (in our best infomercial voice) About 12% went on to click the malicious attachment or link and thus enabled the attack to succeed. That indicates a significant rise from last year’s report in the number of folks who opened the email (23% in the 2014 dataset) and a minimal increase in the number who clicked on the attachment (11% in the 2014 dataset). The median time for the first user of a phishing campaign to open the malicious email is 1 minute, 40 seconds. The median time to the first click on the attachment was 3 minutes, 45 seconds, thus proving that most people are clearly more on top of their email than I am. However, before we drag these individuals outside and collectively stone them, keep in mind that the main perpetrators for these types of attacks are organized crime syndicates (89%) and state-affiliated Actors (9%) who can put some thought into the ruse they use (yeah, I know). In roughly 636,000 sanctioned phishing emails, we captured whether the email was reported. Approximately 3% of targeted individuals alerted management of a possible phishing email. We did not verify by what means the email was reported, or whether it was because they were savvy enough to avoid the trap or because they only realized it once they had fallen in themselves. 10 Granted this could be affected by preview pane opening of emails or people not loading images in emails. Figure 14. Number of phishing emails opened and clicked in first 24 hours and percent of opened emails that were clicked 50% 25% 0 0.5M 1M 0 12 Hours CountPercent 6 18 n Opened n Clicked n Percent (of opened) clicked The main perpetrators for phishing attacks are organized crime syndicates and state-affiliated actors.
  • 23. Verizon 2016 Data Breach Investigations Report 19 As an aside, the smaller proportion of nation-state Actors in this year’s data is due to a large contribution from a particular contributor who saw a great deal of ‘Dridex’ campaigns which skewed the data toward organized crime. We should not conclude from this that certain groups from East Asia have had a crisis of conscience and mended their wicked ways. What do the attackers ultimately steal? A heck of a lot of credentials (mostly due to the large amount of opportunistic banking Trojans—beware of Greeks bearing gifts), but also trade secrets. Recommended controls Filter it! Filter it real good! “An ounce of prevention is worth a pound of cure.” It was good advice when Ben said it and so it remains. The first opportunity to defend against email- borne threats is (thankfully) before a human can interact with it. Email filtering is your buddy in this fight and you need to have an understanding of your current solution, and test its implementation. Talk amongst yourselves (I’m verklempt)! Provide employees with awareness training and information so they can tell if there is something ‘phishy’ (couldn’t resist) going on. Also, provide them with a means for reporting these events. We recommend a button on their taskbar, but whatever works for you. One click does not a catastrophe make. So, it snuck past your email filters and someone went clicky-clicky. There is still ample opportunity to limit the impact. Assuming the organization’s “seekrit stuff” isn’t resident on the initial foothold, make it hard to pivot from the user device to other assets in the organization. Protect the rest of your network from compromised desktops and laptops by segmenting the network and implementing strong authentication between the user networks and anything of importance. Static passwords are adorable, but sophisticated attackers don’t just bypass them, they utilize them to advance their attack. Keep your eye on the ball. You increase your chances of catching signs that you have fallen victim to a phishing attack if you monitor outbound traffic for suspicious connections and potential exfiltration of data to remote hosts. 829 62 7 7 7Personal Medical Bank Secrets Credentials Breach count Figure 15. Top five data varieties breached by phishing attacks, (n=905) Protect the rest of your network from compromised desktops and laptops by segmenting the network and implementing strong authentication.
  • 24. Verizon 2016 Data Breach Investigations Report 20 We’re not mad, just disappointed. The use of stolen, weak or default credentials in breaches is not new, is not bleeding edge, is not glamorous, but boy howdy it works. Static authentication mechanisms have been attacked for as long as we can remember. Password guessing from an InfoSec perspective has been around at least as long as the Morris worm, and has evolved to prominent malware families like Dyre and Zeus that are designed to (among other bad things) capture keystrokes from an infected device. All those efforts to get users to use special characters, upper/lower case numbers and minimum lengths are nullified by this ubiquitous malware functionality. The capture and/or reuse of credentials is used in numerous incident classification patterns. It is used in highly targeted attacks as well as in opportunistic malware infections. It is in the standard toolkit of organized criminal groups and state-affiliated attackers alike. Even fraud committed with stolen payment card data often relies on the static Card Verification Value (CVV) information on the magnetic stripe.11 We are realists here, we know that implementation of multi-factor authentication is not easy. We know that a standard username and password combo may very well be enough to protect your fantasy football league. We also know that implementation of stronger authentication mechanisms is a bar 11 More on this in the Post-Compromise Fraud appendix. Credentials 63% of confirmed data breaches involved weak, default or stolen passwords. At a glance Description Use of stolen credentials and other hacking and malware actions targeting traditional username and password authentication are prevalent across numerous patterns. Top patterns Web App Attacks, POS Intrusions Frequency 1,429 incidents with confirmed data disclosure. Key findings Static credentials continue to be targeted by several of the top hacking action varieties and malware functionalities.
  • 25. Verizon 2016 Data Breach Investigations Report 21 raise, not a panacea. Even with all of that, 63%12 of confirmed data breaches involved leveraging weak/default/stolen passwords. This statistic drives our recommendation that this is a bar worth raising. Figure 16 shows the most common threat action varieties associated with attacks involving legitimate credentials. The obvious action of the use of stolen credentials is numero uno, but we see some other common actions used in conjunction, including C2 malware, exporting of data, phishing and keyloggers. 12 We combined all incidents with confirmed data disclosure AND use of stolen creds OR brute force OR password dumpers OR a data variety of credentials. 1,095 1,031 980 847 841 Malware - Spyware/keylogger Social - Phishing Malware - C2 Malware - Export data Hacking - Use of stolen creds Incident count n=1462 Figure 16. Top threat action varieties within incidents involving credentials, (n=1,462)
  • 26. Verizon 2016 Data Breach Investigations Report 22 What began with a muttered complaint of “ugh, another one of these” during data conversion a couple of years ago grew into a shift in how we present our core results and analysis. The nine incident classification patterns were born of recurring combinations of the who (Actors), what (assets), how (actions) and why (motive) among other incident characteristics. In the 2014 report, we found that over 90% of breaches fell into one of the nine buckets and this year’s dataset is no different. We hope that by discussing security incidents, both for this year and historically, and using these clusters as the foundation, we can allow security folks to gain the most from the entire (huge) dataset. Understanding that you don’t have to necessarily worry about 2,260 different breach possibilities, but only a select number of nine patterns (depending on your industry) makes the life of a CISO less of a daily Kobayashi Maru. Before we dive deeper into changes over time and the individual patterns (and don’t fret, we will), let’s take a moment and look at the incident and breach breakouts for 2015 in Figures 17 and 18. Incident classification patterns | | | | | | | | | 11,347 10,490 9,701 9,630 8,886 7,951 5,334 534 247 102Payment Card Skimmers Cyber-espionage POS Intrusions Web App Attacks Crimeware Everything Else Denial-of-Service Physical Theft/Loss Privilege Misuse Miscellaneous Errors Percentage of incidents 0% 10% 20% 30% | Figure 17. Percentage (blue bar), and count of incidents per pattern. The gray line represents the percentage of incidents from the 2015 DBIR. (n=64,199) The nine classification patterns were born of recurring combinations of the who, what, how and why.
  • 27. Verizon 2016 Data Breach Investigations Report 23 Much to the chagrin of Jerry Lee Lewis, there was not a whole lot of moving and shaking going on in the pattern rankings compared to last year and looking at all incidents, only one pattern moved in the pecking order. Crimeware was the third most common pattern last year and has moved to sixth. The reason is the filter on the secondary motive we discussed in the Breach Trends section. Thousands of incidents where we know a device was participating in a denial- of-service (DoS) bot (but nothing else) were not sent to /dev/null per se, but you won’t find them here.13 The fact is that our dataset is constantly evolving with contributors joining (yay) and others not able to participate for a year. Many of our contributors have a certain specialty or discipline that results in their data being associated with a certain victim industry, or threat Actor type, or country … you get the picture. Because of this fact, the ebbs and flows in the patterns from year to year are attributed more to changes in our data than changes in the threat landscape. Bad guy trends would likely be best gleaned from the threat action variety level within a pattern and again, the deeper dives are coming. Having said all of that, Figures 19 and 20 represent the obligatory “trend” graphs. 13 There are thousands of compromised web servers used as phishing sites that did not make the cut either. No information on how the server was compromised, or if it was owned or maintained by an organization, was available. | | | | | | | | | 908 525 197 172 155 125 86 56 49 1Denial-of-Service Crimeware Physical Theft/Loss Payment Card Skimmers Everything Else Cyber-espionage Privilege Misuse Miscellaneous Errors POS Intrusions Web App Attacks Percentage of breaches | 0% 10% 20% 30% 40% Figure 18. Percentage (blue bar), and count of breaches per pattern. The gray line represents the percentage of breaches from the 2015 DBIR. (n=2,260) Figure 19. Frequency of incident classification patterns over time across security incidents. 2006 2007 2008 2009 2010 2011 2012 2013 2014 2015 0% 20% 40% 60% 80% 100% n Web App Attacks n Insider and Privilege Misuse n POS Intrusions n Payment Card Skimmers n Miscellaneous Errors n Physical Theft/Loss n Everything Else n Denial-of-Service Attacks n Cyber-espionage n Crimeware
  • 28. Verizon 2016 Data Breach Investigations Report 24 Figure 20. Frequency of incident classification patterns over time across confirmed data breaches. OK, in lieu of worrying about how patterns rank overall compared to each other, let’s get to the good stuff. The best way to use the patterns is to understand the applicability of each of them to your organization. The following charts show the frequency of each of the patterns relative to each industry. In other words, it shows for all the incidents (Figure 21) and breaches (Figure 22) within your industry, those patterns which were common and those which didn’t make an appearance. We have included the incident and breach totals again as some of the combinations are a small percentage, but still represent a significant number of events. We use the North American Industry Classification System (NAICS) to classify the victim industry—go to the NAICS website14 if you’re unsure where your organization fits. Of course if you are an E Corp-like conglomerate, you can have business units that fall into several industry categories. 14 Census.gov/cgi-bin/sssd/naics/naicsrch?chart=2012 2006 2007 2008 2009 2010 2011 2012 2013 2014 2015 0% 20% 40% 60% 80% 100% Crimeware Cyber- espionage Denial of Service Everything Else Stolen Assets Misc. Errors Card Skimmers Point of Sale Privilege Misuse Web Apps <1% 2% 2% 4% 4% 5% 1% 16% 1% 10% <1% 2% <1% 2% 3% 16% 2% <1% <1% 16% 20% 56% 81% 99% 34% 46% 33% 90% 1% 45% 26% 1% 4% 2% 5% 11% 21% 33% 2% 17% 2% 1% 3% <1% <1% 32% <1% 1% 20% 1% 2% 4% 1% 18% 11% 1% 1% 24% 1% 6% <1% 6% 3% 74% 4% 1% <1% 5% <1% 1% <1% 32% 2% 22% 1% 3% 23% 2% 6% 2% 22% 1% 6% 1% 11% 5% 1% 48% 4% 12% 6% 1% <1% 13% 35% Figure 21. Incident patterns by industry minimum 25 incidents Accommodation (72), n=362 Administrative (56), n=44 Educational (61), n=254 Entertainment (71), n=2,707 Finance (52), n=1,368 Healthcare (62), n=166 Information (51)n, 1,028 Manufacturing (31-33), n=171 Professional (54), n=916 Public (92), n=47,237 Retail (44-45), n=370 Transportation (48-49), n=31 n Web App Attacks n Insider and Privilege Misuse n POS Intrusions n Payment Card Skimmers n Miscellaneous Errors n Physical Theft/Loss n Everything Else n Denial-of-Service Attacks n Cyber-espionage n Crimeware
  • 29. Verizon 2016 Data Breach Investigations Report 25 From an incident standpoint, Denial-of-Service stands out like “a zoot suit at a Quaker funeral”. This is partly due to the fact that DoS attacks are in fact, happening all the time—remember all those popped boxes in the DoS botnets we filtered out? Another reality is that the other patterns that are more commonly classified as incidents as opposed to confirmed data breaches (Crimeware, Insider and Privilege Misuse, and Physical Theft and Loss) are mostly provided by the public sector and healthcare. Those are the top three incident patterns and we are confident that in the real world they are taking some of that market share from DoS in other industries. The most interesting discovery in the breach patterns to industry matrix was the rise of Web App Attacks across the board, but especially for financial services organizations (up from 31% in the 2015 DBIR). The next item that raised an eyebrow or two (or perhaps a unibrow) was the decline (down from 36% last year) in Crimeware, also in Finance. Is there anything to this? Actually, yes. This year, again thanks to the organizations involved in the Dridex takedown, we have even more data involving the reuse of stolen credentials. This caused the spike in the Web App Attack pattern and if we removed these breaches, the numbers would be more in line with 2014. On the flip side, in 2014 we received more data on malware infections within organizations, leading to breaches that landed in our Crimeware bucket. Is Crimeware not playing as big a role in breaches? The perspective of the reporting contributor has a lot to do with the pattern breakdowns as well. Using the banking Trojan example: Event 1: Organization A is infected with a Zeus variant via a drive-by download Event 2: Malware has a keylogging functionality that captures banking credentials Event 3: Malware exports captured data to command and control (C2) server Crimeware Cyber- espionage Denial of Service Everything Else Stolen Assets Misc. Errors Card Skimmers Point of Sale Privilege Misuse Web Apps 1% 3% 1% 3% 4% 12% 1% 7% 1% 3% 3% 47% 19% 16% 1% 1% 1% 17% 2% 11% 4% 3% 25% 4% 4% 1% 17% 3% 1% 19% 4% 9% 1% 27% 2% 22% 25% 15% 37% 1% 1% 9% 3% 95% 47% 7% 1% 3% 64% 1% 3% 4% 32% 11% 24% 21% 13% 2% 1% 30% 50% 82% 3% 57% 21% 13% 9% 26% Figure 22. Incident patterns by industry minimum 25 incidents (only confirmed data breaches) Intermission music Accommodation (72), n=282 Educational (61), n=29 Entertainment (71), n=38 Finance (52), n=795 Healthcare (62), n=115 Information (51), n=194 Manufacturing (31-33), n=37 Professional (54), n=53 Public (92), n=193 Retail (44-45), n=182
  • 30. Verizon 2016 Data Breach Investigations Report 26 Event 4: Credentials are used to log into Organization B web server Event 5: Fraudulent transaction is initiated Organization B may be quick to say “We didn’t have a malware incident” and if events 4–5 are provided to us, the incident would find a good home in the Web App Attacks section. But if we received data from Organization A and only events 1–3 are documented, it now becomes a newly minted Crimeware breach. It is important to realize that there are interrelations between the incident patterns that aren’t always evident. Crimeware in one organization leads to DoS against another; or to fraudulent transactions on another’s application. Remember we’re all in this together: the security ecosystem, Kumbaya and trust falls folks…
  • 31. Verizon 2016 Data Breach Investigations Report 27 When Clippit was king Websites aren’t what they used to be, with a background of a tiled cloud image, the company name proudly displayed center top in Comic Sans and with identical animated gifs on either side. Combined with a healthy dose of ALL CAPS, blink tags and, of course, a site counter at the bottom with numbers that had just the right touch of drop shadow. 1997 was a simpler time. Now organizations have less ugly (typically), less static and more business- critical websites promoting their operations, conducting ecommerce and hooking into backend databases. Users are not merely reading a homepage and clicking on a couple of links to basic information about store hours, but are increasingly more interactive and issue various types of inputs to be read and acted upon by the web infrastructure. The greater complexity, including the web application code and underlying business logic, and their potential as a vector15 to sensitive data in storage, or in process, makes web application servers an obvious target for attackers. 15 They are likely/hopefully one of the only services that are internet accessible for an organization. Web App Attacks The great complexity of the infrastructure makes web application servers a target for attackers. At a glance Description Any incident in which a web application was the vector of attack. This includes exploits of code-level vulnerabilities in the application as well as thwarting authentication mechanisms. Top industries Finance, Information, Retail Frequency 5,334 total incidents (19,389 additional with secondary motivation), 908 with confirmed data disclosure. Key findings The breaches within this pattern are heavily influenced by information gathered by contributors involved in the Dridex botnet takedown. Hundreds of breaches involving social attacks on customers, followed by the Dridex malware and subsequent use of credentials captured by keyloggers, dominate the actions. Defacements are still commonplace and CMS plugins are also a fruitful attack point. Point-of-Sale Intrusions Payment Card Skimmers CrimewareWeb App Attacks Denial-of- Service Attacks Physical Theft and Loss Insider and Privilege Misuse Miscellaneous Errors Cyber- espionage
  • 32. Verizon 2016 Data Breach Investigations Report 28 For starters, not all website compromises are targeted affairs. We had almost 20,000 incidents of websites that were popped used to either host malware, participate in distributed denial-of-service (DDoS) attacks or repurposed as a phishing site. We have no idea as to the method of compromise, nor the victim demographics and thus these instances of secondary motivation have been culled from the information that follows. About half of the incidents that remain were website defacements and the data we have on those was not enough to establish whether the motive was ideology, a personal grudge, or just for fun— so we combined them in Figure 23 below. Typically the hacking actions used to compromise were not known either, but in case you thought defacements, like the blink element, were an obnoxious thing of the past, think again.16 When we filter down into confirmed data disclosure, the financial motive flexes its muscle with 95% of breaches associated with criminals all about the cheddar. Eco-friendly hacking—reusing and recycling passwords When looking at the threat actions in Figure 24, a pattern within the pattern smacks us in the face with a glove and demands satisfaction. The top six actions narrate the story of the Dridex campaign better than Morgan Freeman combined with Sir David Attenborough ever could. These breaches, uncovered through the forensic analysis performed on several C2 servers tell the tale of phish customer C2 Drop Keylogger Export captured data Use stolen credentials.18 Even with a particular spree inflating these numbers, the top six looked very similar to last year, albeit in a different order, and with phishing making an appearance in the top actions this year. There are other stories beyond the botnet though. We wanted to know what other data points the use of stolen credentials was associated with when that spree was removed from the data. Phishing still showed a strong association in the pattern, but also mail servers. While masked at first in our data by the botnet, social engineering to acquire web-based email credentials 16 If you are not familiar with the blink element, just Google “blink tag”. We’re sorry in advance. 17 F/I/G is the combination of Fun, Ideology, or Grudge 18 If “get funky” was a VERIS enumeration, it would surely be an extension of this attack chain. Figure 23. External Actor motives within Web App Attack incidents, (n=3,720) 2,849 863 7Espionage Financial F/I/G17 Incident Count 95% of confirmed web app breaches were financially motivated. Point-of-Sale Intrusions Payment Card Skimmers CrimewareWeb App Attacks Denial-of- Service Attacks Physical Theft and Loss Insider and Privilege Misuse Miscellaneous Errors Cyber- espionage
  • 33. Verizon 2016 Data Breach Investigations Report 29 Figure 24. Top 10 Threat action varieties within Web App Attack breaches, (n=879) was uncovered when peeling back the layers of the Web App onion. And they probably don’t even have the black “I read your email” T-shirt to brag about their bounty. Wendell Wilkins injects web shells into the Web App. We have seen content management systems (CMS) as the vector for installation of web shells,19 which are also classified as a backdoor in our framework. Either exploiting a remote file inclusion (RFI) vulnerability, or abusing an insecure upload functionality, the web shells are injected and used as the gateway to additional mayhem. In financially motivated attacks against ecommerce servers, web shells are used to access the payment application code, which is then modified with a new feature that will capture the user input (think payment card number and CVV) for future pickup. As with prior years, this is backed up by other studies.20 And it wouldn’t be a proper DBIR if we didn’t raise a glass to one of the elder statesmen of web application hacking, SQL injection (SQLi). It, like other vulnerabilities associated with web applications, stems from a lack of input validation allowing Actors to pass SQL commands via the web application and to the database. Lastly we want to thank AsTech Consulting, Imperva, and WhiteHat Security for scan data and mind melds around web application security. 19 US-Cert.gov/ncas/alerts/TA15-314A 20 Imperva’s 2015 WAAR showed a strong correlation between RFI and Content Management Systems. 831 817 817 812 811 809 19 14 9 7Brute force Hacking - RFI Malware - Backdoor Hacking - SQLi Malware - Export data Malware - C2 Malware - Spyware/Keylogger Social - Phishing Hacking - Use of backdoor or C2 Hacking - Use of stolen creds Breach count In attacks against ecommerce servers, web shells are used to access the payment application code and capture user input. Point-of-Sale Intrusions Payment Card Skimmers CrimewareWeb App Attacks Denial-of- Service Attacks Physical Theft and Loss Insider and Privilege Misuse Miscellaneous Errors Cyber- espionage
  • 34. Verizon 2016 Data Breach Investigations Report 30 Recommended controls Factor, meet factor. Like that song you can’t get out of your head. Here is another shot across the bow of single-factor, password-based authentication for anything of criticality. If you are securing a web application, don’t base the integrity of authentication on the assumption that your customers won’t get owned with keylogging malware. They do and will. I value your input, I just don’t trust it. Validate inputs, whether it is ensuring that the image upload functionality makes sure that it is actually an image and not a web shell, or that users can’t pass commands to the database via the customer name field.21 Unplug. Worrying about OS and core application code is hard enough, but third- party plugins are also gray-hair-inducing. Establish a patch process for CMS platforms and third-party plugins. 21 Still great: XKCD.com/327/ Point-of-Sale Intrusions Payment Card Skimmers CrimewareWeb App Attacks Denial-of- Service Attacks Physical Theft and Loss Insider and Privilege Misuse Miscellaneous Errors Cyber- espionage
  • 35. Verizon 2016 Data Breach Investigations Report 31 Point-of-Sale Intrusions The well, revisited It should be no surprise to anyone that this pattern is alive and well in the 2015 dataset. There are still folks out there seeking to get paid and looking to stolen payment card data as the means to meet their greedy objectives. 22 Personal Identification Number (PIN) Entry Device At a glance Description Remote attacks against the environments where card-present retail transactions are conducted. POS terminals and POS controllers are the targeted assets. Physical tampering of PED24 pads or swapping out devices is covered in the Payment Card Skimmers section. Top industries Accommodation and Food Services, Retail Frequency 534 total incidents, 525 with confirmed data disclosure. Key findings Headline-grabbing remote payment card breaches have shifted from large retailers in 2014 to hotel chains in 2015. Use of stolen credentials to access POS environments is significant. Command and control functionalities are being reported at a much higher rate than in years past, although this may be in part due to an underrepresentation of C2 functionalities as opposed to a 2015 trend. RAM scraping continues to be omnipresent in 2015, but keylogging malware has a significant role in many POS attacks, being a common method of capturing valid credentials to be used against POS assets. Continuing the trend of the last several years, the sprees (single threat Actor, many victims) represented in this data are a byproduct of successful attacks against POS vendors and cannot be attributed to automated attacks targeting poorly configured, internet-facing POS devices. Point of sale devices continue to be a reliable source for stolen payment card data. Point-of-Sale Intrusions Payment Card Skimmers CrimewareWeb App Attacks Denial-of- Service Attacks Physical Theft and Loss Insider and Privilege Misuse Miscellaneous Errors Cyber- espionage
  • 36. Verizon 2016 Data Breach Investigations Report 32 Point-of-sale devices continue to be a reliable source for this data, notably the POS terminals that directly consume magnetic stripe information from customers, or POS controllers that typically act as an aggregator of transactional data from the terminals in a server-to-client relationship. In small businesses, the POS environment may have a population of one, with a lone computer processing payments and communicating out to the payment processor. This device might also (unfortunately) be used for checking personal email, social media breaks and other interwebby activities that introduce more risk to the POS application which is all alone, with no anti-virus or host-based firewall to talk to. Four or five years ago, our findings were dominated by POS breaches— simplistic and automated in nature and making full use of known default vendor credentials. We lovingly called these POS Smash and Grabs, and this attack method was one that we saw over and over again and helped drive us to the development of incident classification patterns. The gist of these, if this is your first DBIR rodeo, is: 1) POS server is visible to the entire internet, 2) POS has default login, 3) Bad guy leverages 1) and 2) to install malware and 4) Malware grabs the payment card data as it is processed. This scenario was, and still is, a small business problem. It did, however, offer some insight into what was to come for larger organizations. The 2015 DBIR detailed the rise of larger organizations suffering POS breaches and their representation in this pattern. While 1) and 2) were not present in these breaches, raising that fruit a little higher from the ground, there are some definite similarities. Both the smash and grabs and large organization breaches took advantage of static, single-factor authentication. Attackers have had to up their game a bit, having to do some work to compromise valid and assumed- to-be non-default, credentials to access the environments. Moreover, they have issued the stolen credentials from a foothold on the network as opposed to directly from the internet. Figure 25 shows the prevalence of stolen passwords in the POS Intrusion pattern. Brute force is still relevant, but we hope it will continue to decline as small and medium businesses move away from passwords that could be guessed by a rhesus monkey of average intelligence. Figure 25. Three-year chart of % and number of breaches using stolen credentials within POS Intrusions, (n=1,103) 127 99 78 0% 10% 20% 30% 40% 2013 2014 2015 Attackers have had to up their game to compromise valid credentials and access the environments. Point-of-Sale Intrusions Payment Card Skimmers CrimewareWeb App Attacks Denial-of- Service Attacks Physical Theft and Loss Insider and Privilege Misuse Miscellaneous Errors Cyber- espionage
  • 37. Verizon 2016 Data Breach Investigations Report 33 Vendor as a vector The vector associated with the hacking actions tells an interesting story as well. Ninety-seven percent of breaches featuring use of stolen credentials also had a vector of Partner. This is selected when the Actor uses legitimate partner access in the hacking action. This year continued the trend of the criminal sprees in our data being associated with attacks against POS vendors followed by using their access into their customer base.23 Bill Gates once said “Your most unhappy customers are your greatest source of learning.” With all of their customers equally unhappy, the amount of learning some POS vendors have acquired must have been like Neo’s martial arts training.24 The other similarity of large and small organizations is that malware is the workhorse of POS breaches. Figure 26 shows the most common malware functionalities. We have seen the evolution from “off-the-shelf” keyloggers, to memory scraping malware (RAM scrapers), to POS-specific RAM scrapers with names like BlackPOS and PoSeidon (in case you weren’t sure what they were designed to attack). Exfiltration has evolved from static code within the malware to FTP data to a single destination, to utilization of a C2 infrastructure to ship the captured data out. Both C2 and Backdoor are more prevalent this year than in years past. The reality is that POS malware families are typically multifunctional and some of the most notorious (Dexter, vSkimmer, Alina, Backoff, JackPOS …) have command and control/backdoor capabilities. In many cases, it is easier to prove the use of one functionality (the one that stole the data) than others (C2 beaconing). Many of the POS Intrusion incidents did not have the evidentiary logs needed to validate outbound communications. Long story short, the spike in C2 and Backdoor may very well be a product of better windows into the entire behavior of the malware. 23 The actions used in this scenario are examined more closely in the Wrap Up section as it features combinations of many of the top threat action varieties that are also found in other patterns. 24 “I know kung fu.” 512 210 160 155 4 4 3 2 2 1Worm Capture app data Adminware Spyware/Keylogger Downloader Capture stored data Backdoor C2 Export data Ram scraper Breach count Figure 26. Malware varieties within POS Intrusion breaches, (n=521) 97% of breaches featuring stolen credentials leveraged legitimate partner access. Point-of-Sale Intrusions Payment Card Skimmers CrimewareWeb App Attacks Denial-of- Service Attacks Physical Theft and Loss Insider and Privilege Misuse Miscellaneous Errors Cyber- espionage
  • 38. Verizon 2016 Data Breach Investigations Report 34 Recommended controls Not trying to give you static, but... Static single authentication is a weakness that is used in spades by the attackers. If possible, improve this with a second factor such as a hardware token or mobile app, and monitor login activity with an eye out for unusual patterns. Have a conversation with your vendors and ensure that they are using strong authentication to access your POS environment. Who can it be, knocking at my door? Find out what monitoring options are available for your POS environment and validate their implementation. Track remote logins and verify any and all that are against the norm. Segmentation, seriously Separate the POS environment from the corporate LAN and ensure that it is not visible to the entire internet. Point-of-Sale Intrusions Payment Card Skimmers CrimewareWeb App Attacks Denial-of- Service Attacks Physical Theft and Loss Insider and Privilege Misuse Miscellaneous Errors Cyber- espionage
  • 39. Verizon 2016 Data Breach Investigations Report 35 The disgruntled insider—we all have an idea in our minds of what this person looks like. Perhaps it is the software developer who is frustrated with management; maybe it is the healthcare worker who has been recruited by organized crime; or maybe it is that guy in the basement grieving the loss of his red stapler. Regardless of what they look like, the fact is they are inside our carefully constructed defenses and they are wreaking havoc with our data. The Insider and Privilege Misuse pattern is one of the few that sees collusion between internal and external (or even partner) Actors. Figure 27 shows the percentage of these breaches where multiple Actors are present. These are most frequently an external/internal pairing, but ruling out partners as potential colluders is a mistake. The break from the norm that we saw was the rise in misuse breaches tied to external Actors only. This was normally solely associated with TGYFBFTDHRA,25 but this year we had cases where 25 That guy you fired but forgot to disable his remote access. Insider and Privilege Misuse The Privilege Misuse pattern is one of the few that includes collusion between internal and external Actors. At a glance Description All incidents tagged with the action category of Misuse—any unapproved or malicious use of organizational resources—fall within this pattern. This is mainly insider-only misuse, but outsiders (due to collusion) and partners (because they are granted privileges) show up as well. Top industries Public, Healthcare, Finance Frequency 10,489 total incidents, 172 with confirmed data disclosure. Key findings They’re behind your firewall, getting all up in your data. They are often end users and they are comfortable exfiltrating data out in the open on the corporate LAN. Insider incidents are the hardest (and take the longest) to detect. Of all the incidents, these insider misuse cases are the most likely to take months or years to discover. Point-of-Sale Intrusions Payment Card Skimmers CrimewareWeb App Attacks Denial-of- Service Attacks Physical Theft and Loss Insider and Privilege Misuse Miscellaneous Errors Cyber- espionage
  • 40. Verizon 2016 Data Breach Investigations Report 36 instead of organized crime soliciting insiders to provide banking information, they went to the customer. It was actually external external collusion to commit fraud. The butler did it. Back to the insiders—who are they? When their roles were classified in the incident, almost one third were found to be end users who have access to sensitive data as a requirement to do their jobs. Only a small percentage (14%) are in leadership roles (executive or other management), or in roles with elevated access privilege jobs such as system administrators or developers (14%). The moral of this story is to worry less about job titles and more about the level of access that every Joe or Jane has (and your ability to monitor them). At the end of the day, keep up a healthy level of suspicion toward all employees. While we would like to think they will never give you up, let you down, run around or desert you, we simply can’t (tell a lie, and hurt you). The why and how What motivates them? Most frequently it is the potential for financial gain (34%), although the espionage motivation (25%) continues to be associated with these breaches. Figure 28 shows how the motivation of these Actors Figure 27. Percent of breaches per threat Actor category within Insider and Privilege Misuse, (n=172) 11% 77% 3%8% 25% 50% 75% 2009 2013 201520142010 2011 2012 Figure 28. Actor motive over time within Insider and Privilege Misuse, (n=715) n Financial n Espionage n Grudge n Fun n Everything Else n Ideology Actor n External n Collusion n Internal n Partner Point-of-Sale Intrusions Payment Card Skimmers CrimewareWeb App Attacks Denial-of- Service Attacks Physical Theft and Loss Insider and Privilege Misuse Miscellaneous Errors Cyber- espionage
  • 41. Verizon 2016 Data Breach Investigations Report 37 has changed since 2009. It is interesting to see the potential convergence of the financial motivation and the espionage motivation. While this also reflects the change in the dataset as we progress over time, the rise of the espionage-motivated insider should give organizations reason to consider implementing processes to detect when exiting employees may have taken valuable data with them. Figure 29 lists the top varieties of Misuse within the Insider and Privilege Misuse pattern. When the nature of their actions is known, the general privilege abuse is always at the top of the list. This is merely using access to gain information for alternative and unsanctioned uses. Data mishandling follows and typically involves mailing sensitive information or loading to a sharing service. Many times this is not done with malicious intent, but for a convenience factor. Use of unapproved hardware and software are the third and fourth most common varieties of misuse. The unapproved hardware is usually either a USB drive (used to store information to be used later, like, when employed at another company kind of later) or a hand-held skimmer that we have seen food servers use to capture diners’ payment card data. The actions of insiders are among the most difficult to detect and the discovery timeline (Figure 30) illustrates this point. In our graphic we show the majority of these incidents are taking months or longer to discover. In fact, when we looked at the overall DBIR dataset, we found that the incidents that take the 152 30 24 23 18 17 6 6 5 4Unapproved workaround Illicit content Net misuse Knowledge abuse Email misuse Possession abuse Unapproved software Unapproved hardware Data mishandling Privilege abuse Incident count Figure 29. Top Misuse action varieties within Insider and Privilege Misuse, (n=230) Point-of-Sale Intrusions Payment Card Skimmers CrimewareWeb App Attacks Denial-of- Service Attacks Physical Theft and Loss Insider and Privilege Misuse Miscellaneous Errors Cyber- espionage
  • 42. Verizon 2016 Data Breach Investigations Report 38 longest to discover were these inside jobs. The shift from days to months led us to look at what was different. We found that there were more cases where bank employees provided info that was used for fraud—and was discovered quicker—in years prior. For organizations that will not have fraud detection in their arsenal, the shift is likely more representative of their world. Recommended controls The evil within So love your employees, bond at the company retreat, bring in bagels on Friday, but monitor the heck out of their authorized daily activity, especially ones with access to monetizable data (financial account information, personally identifiable information (PII), payment cards, medical records). USB wary Our dataset included numerous instances of audits being performed after an employee had left, which uncovered evidence of a USB drive used to transfer data prior to their departure. It makes sense to take measures to identify use of these portable drives sooner rather than later. Keep one eye on your data and the other on your employees! You cannot effectively protect your data if you do not know where it resides. Likewise, it does you little good to know where it is but then pay no attention to who has access to it. Make sure that you are aware of exactly where your data is and be careful who you give privileges to and to what degree. It makes sense to give the valet attendant your keys to park your car, but not to hand over your credit cards as well. Figure 30. Discovery timeline within Insider and Privilege Misuse over time, (n=358) 2009 2011 2013 2015 5% 5% 49% 21% 21%Years Months Weeks Days Hours Minutes Seconds 201420122010 You can’t effectively protect your data if you don’t know where it resides. Point-of-Sale Intrusions Payment Card Skimmers CrimewareWeb App Attacks Denial-of- Service Attacks Physical Theft and Loss Insider and Privilege Misuse Miscellaneous Errors Cyber- espionage
  • 43. Verizon 2016 Data Breach Investigations Report 39 Tougher penalties for data breaches Almost without exception, every international fraud and business crime case that Mishcon de Reya LLP has advised on in the past 12 months involved the use of computer equipment and electronic data. For a company that falls victim to cybercrime, there are immediate financial ramifications from loss of revenue while systems are down, the unlawful exploitation of valuable data that has been stolen, or possible claims faced from the queue of litigants seeking compensation. Additionally, there can be a broader impact on customer trust and confidence following an incident that can lead to reputational damage that is more difficult to quantify. Yet, there is huge inconsistency and discrepancy in the way that governments are tackling this problem. Many believe that the legislation is out of date with technology and too weak to combat the problem with any meaningful sanction. There is widespread confusion and enhanced regulatory risk as businesses are forced to comply with radically different laws as their data passes from one country to the next. In the US, there are a multitude of privacy and data security laws but no specific and comprehensive federal law, and no official national authority responsible for enforcing it. As a member of the European Union, the UK implemented the European Union’s 1995 Data Protection Directive 95/46/EC with the Data Protection Act 1998. The Information Commissioner’s Office is responsible for enforcing it and upholding information rights, but the ICO is championing tougher sanctions, including prison sentences rather than fines, to deter theft and trading of personal data. At the moment, there is no mandatory reporting obligation in the UK under the data protection legislation and the toughest penalty that the ICO can impose is a £500,000 fine (about $700,000) for the most serious of data breaches. As such, the legislation lacks the necessary teeth to properly deter misuse of personal data. While there is other criminal legislation law enforcement can use to combat cybercrime more broadly, the authorities in the UK and elsewhere face difficult and expensive jurisdiction hurdles as offences routinely cross borders, requiring authorities to cooperate internationally to investigate acts, then extradite and prosecute criminals. With huge volumes of encrypted data, proxy servers masking true IP addresses, secure VPNs and anonymous currency exchanges used by criminals, many authorities are falling at the first hurdle in terms of finding the necessary evidence to support a prosecution. Unfortunately, there is still a long way to go before the scale and rate of cyberattacks is brought under control by effective legislation. Hugo Plowman and Rob Wynn Jones, Partners—Mishcon de Reya LLP Point-of-Sale Intrusions Payment Card Skimmers CrimewareWeb App Attacks Denial-of- Service Attacks Physical Theft and Loss Insider and Privilege Misuse Miscellaneous Errors Cyber- espionage
  • 44. Verizon 2016 Data Breach Investigations Report 40 People aren’t perfect. With all of the hubris and bravado in the InfoSec world, one proclamation we usually don’t hear is “Our employees NEVER make mistakes.” Well, because they do. Everyone does and this is the section where we talk about breaches caused by the people saying “Oops, my bad”. An important distinction that will be familiar to those with strong VERIS-fu is that we take a very narrow approach to the Miscellaneous Errors action category. If you got hacked due to the lack of any patch process or validation, then that is not an error. The action or inaction was not a direct cause of the data loss (the bad guy still had to get his hack on). To ensure that every incident we come across isn’t rubber- stamped as an error due to less-than-perfect security practices, we limit its use to only when the action is the direct cause of attribute loss. And because the most common error of losing stuff is so common, it was deemed worthy of its own pattern along with stolen assets on page 43. As in prior reports, due to the influx of thousands upon thousands of misdelivery incidents from the public sector26 that tried to steal the show, we have removed them in the interest of finding actionable tidbits of information that would never have a voice otherwise. Data errors reduce productivity (DERP). Traditionally, this pattern has been dominated by the Trio of Trouble: Misdelivery, Publishing and Disposal errors and they make their annual appearance in Figure 31. Last year we grew our corpus to include data that 26 Public sector misdelivery incidents was, (n=10,094) Miscellaneous Errors The most common error of losing stuff is so common, it was deemed worthy of its own pattern. At a glance Description Incidents where unintentional actions directly compromised a security attribute of an information asset. This does not include lost devices, which are grouped with theft instead. Top industries Public, Information, Healthcare Frequency 11,347 total incidents, 197 with confirmed data disclosure. Key findings Misdelivery of information both in paper and digital form remains the most prevalent variety of error. Point-of-Sale Intrusions Payment Card Skimmers CrimewareWeb App Attacks Denial-of- Service Attacks Physical Theft and Loss Insider and Privilege Misuse Miscellaneous Errors Cyber- espionage
  • 45. Verizon 2016 Data Breach Investigations Report 41 shed light on availability issues caused by non-malicious spikes in traffic. Those capacity shortage errors lead the way this year, followed by worker bees either sending emails or documents to the wrong recipients. Classified as Misdelivery errors, these events have seen many a person curse the existence of autocomplete in their Outlook To: field. Publishing information where an unintended audience (e.g., the entire internet) is able to view it remains in the top five. As does misconfiguration—mistyping a firewall rule allowing access to a sensitive file server from all internal networks instead of a specific pool of hosts would be a fine example. Rounding out the top five is disposal errors. These are primarily documents, which is concerning, since that data is in human-readable format—look Ma, no controls! While not as common in our dataset this year, proper wiping of hard drives on decommissioned devices must also be standard operating procedure for organizations. 61 40 18 15 10 3 2 2 1 1Omission Data entry error Programming error Other Gaffe Disposal error Misconfiguration Publishing error Misdelivery Capacity shortage Incident count Figure 31. Top 10 threat action varieties within Miscellaneous Errors, excluding Public, (n=153) A note on data disclosure—for the VERIS field name data_disclosure to be “Yes,” there must be some indication that data was actually viewed or accessed by an unauthorized individual. The following are example scenarios and guidance on how this variable is set: • Unencrypted stolen or lost device: Potentially • Encrypted stolen or lost device: No • Improperly disposed documents or devices: Potentially • Accidentally publishing private data to a public website (no evidence that anyone viewed it): Potentially • Misaddressed envelope that was never traced or recovered: Potentially • Misaddressed envelope that was opened by the incorrect recipient: Yes • Scenarios not marked No or Potentially will change to Yes if discovered by an outside party. For instance, if an external party notifies the victim of a publishing error, the data is, by definition, disclosed. Point-of-Sale Intrusions Payment Card Skimmers CrimewareWeb App Attacks Denial-of- Service Attacks Physical Theft and Loss Insider and Privilege Misuse Miscellaneous Errors Cyber- espionage
  • 46. Verizon 2016 Data Breach Investigations Report 42 When errors lead to data spills, it is still more common to find out from the customers affected by the mistake. One or several of the recipients of someone else’s PII or medical information will reach back out to the organization to clue them into the off-by-one error. Figure 32 shows the top discovery methods for breaches in the Miscellaneous Error pattern. Recommended Controls There is perhaps an element of absurdity in recommending controls for the Error section. One can’t really say “don’t screw up again”, or “pay attention to what you are doing for Pete’s sake”. Nevertheless, there are some common sense practices that can be implemented to help keep errors to a minimum. After all, with all the crooks trying to ruin us, the least we can do is try not to help them. Learn from your mistakes! Keeping a record of common errors that have plagued your organization can be used for something other than to mock fellow employees at the company Christmas party. Collecting this information can be used to implement new training materials for security awareness. Did Jim in accounting cc: everyone in to his latest rant again? Talk about it. Just don’t mention Jim by name. Incorporate frequent “Oops moments” into security training. “I’m the map, I’m the map, I’m the map, I’m the map, I’m the map!” Now that you are keeping a record of wrongs (love may not do it, but wise IT departments do), use that data to map the most common errors to effective controls that can help to minimize the frequency with which they occur, and mitigate the damage they do when they do take place. Stop trash talking! When assets are ready for disposal, make sure that there is a documented procedure for wiping all assets before they are trashed or resold. Ensure that any and all assets go through a rigorous process of check and recheck by the IT department before they can be decommissioned and disposed of. Our dataset is rife with examples of assets being sold to a third party while chock- full of PII and other sensitive data. 43 27 8 7 6 3 2 1 1 1Other Internal - IT review External - suspicious traffic External - audit External - actor disclosure External - found documents Internal - reported by employee External - customer Internal External Breach count Figure 32. Discovery methods of breaches within Miscellaneous Error excluding Public, (n=52) Ensure that all assets go through a rigorous check by the IT department before they can be decommissioned or disposed of. Point-of-Sale Intrusions Payment Card Skimmers CrimewareWeb App Attacks Denial-of- Service Attacks Physical Theft and Loss Insider and Privilege Misuse Miscellaneous Errors Cyber- espionage
  • 47. Verizon 2016 Data Breach Investigations Report 43 Humans, what are you gonna do? If you have young children, the next time you are in their school take a gander at the horror show known as Lost and Found. You will see what appears to be at least 2.5 articles of clothing per student shoved in a bin and left there long enough to form a single brick of coats, hats, gloves and unidentifiable pieces of fabric that entered—but like Charlie on the MTA—never returned home. People lose things all the time—this is not new or particularly newsworthy. It is, however, a real-world pain in the neck for organizations that are at best replacing Scooter’s laptop, or at worse scrambling around to figure out if there was PII on the device and whether encryption had been implemented. And if the fallibility of Scooter weren’t enough, there are still people that want something and don’t wanna pay for it. So to sum this pattern up in haiku form: Same old story, same old song and dance We defined more specific guidelines on data disclosure in the sidebar featured in the Miscellaneous Error pattern. For non-encrypted devices, the Physical Theft and Loss For non-encrypted devices, the determination of a breach can be tough, given that you no longer have custody. Employees lose things Bad guys also steal your stuff Full disk encryption At a glance Description Pretty much what it sounds like—any incident where an information asset went missing, whether through misplacement or malice. Top industries Public, Healthcare Frequency 9,701 total incidents, 56 with confirmed data disclosure. Key findings When we look at all incidents, laptops are the top asset affected by this pattern. However, for confirmed breaches, it is the documents, with their lack of controls, which result in the most confirmed disclosures. Lost assets were over 100 times more prevalent than theft. Point-of-Sale Intrusions Payment Card Skimmers CrimewareWeb App Attacks Denial-of- Service Attacks Physical Theft and Loss Insider and Privilege Misuse Miscellaneous Errors Cyber- espionage
  • 48. Verizon 2016 Data Breach Investigations Report 44 determination of a breach can be tough, given that you no longer have custody of the computer in question. Is the data on that system at risk? Certainly, since it is trivial to bypass the sole control—the password. Still, we cannot by our definition, in most cases of lost computing devices, label them as a confirmed data breach. This discrepancy between the number of confirmed breaches and the number of incidents in this pattern shows that there is quite a bit more data in the at-risk category than the number of confirmed breaches implies. Based on all the incidents in this pattern, laptops are the most common target. However, when we narrowed our research to confirmed breaches, documents are in the lead due to the ability to infer that the finder or thief can read the language in which the information is written. Physical theft is a problem that we have seen time and again, and these incidents most commonly occur in the victim’s own work area (39%) or from the personal vehicle of the employee (33.9%). That said, these items are being lost far more often than they are being stolen. In this year’s data, an asset is lost over 100 times more frequently than it is stolen. At the end of the day, the impact is the same—the laptop is gone and likely wasn’t turned into Lost and Found. Recommended controls Just do it. Full disk encryption on all mobile devices and removable media—make it part of the standard build. Changes in attitudes Keep hope alive that security and situational awareness will become ingrained in your users. Include physical security of corporate assets as part of their orientation and ongoing training. Reiterate that cars are not an appropriate place to leave laptops. Cars have windows which thieves have proven that they can not only see through, but also break to get what they want. Dead trees Rein in the paper as much as feasible given your business. Establish data classification and make it a policy violation, with potential consequences, to print and transport sensitive data. Consider tokenizing to replace sensitive information with an alternate unique identifier when printed copies are required. In this year’s data, an asset is lost over 100 times more frequently than it is stolen. Point-of-Sale Intrusions Payment Card Skimmers CrimewareWeb App Attacks Denial-of- Service Attacks Physical Theft and Loss Insider and Privilege Misuse Miscellaneous Errors Cyber- espionage
  • 49. Verizon 2016 Data Breach Investigations Report 45 Since the expansion of our data contributors and the advent of the patterns, Crimeware has historically been generous in the number of cases, but not so rich in detail. The majority of the incidents found in this neck of the woods come (in bulk) from CERT/CSIRT organizations, who receive them from a wide variety of organizations. These are typically high-frequency, low-impact annoyances that will not receive a full forensics investigation and/or be documented and categorized. We focus on the smaller subset of incidents where the fidelity is higher and use those as predictors into the nature of the rest. This year we also will be delving into malware data received from our security vendor contributors (many thanks to Cylance, Fortinet, ICSA Labs, Palo Alto Networks and Tenable) to shed some light on certain areas. When the functionality of the malware was known, C2, ransomware, spyware/ keylogger, and backdoor and export data were the top five functionalities (see Figure 33). Notably absent is malware designed to DoS another target— these were culled with the secondary motive filter discussed on page 8. Over Crimeware Typically, these are high-frequency, low- impact annoyances that will not receive a full forensics investigation. At a glance Description Any incident involving malware that did not fit into a more specific pattern. The majority of the incidents that comprise this pattern are opportunistic in nature and have a financial motivation behind them. This pattern frequently affects consumers and is where “typical” malware infections will land. Top industries Public, Information, Finance Frequency 7,951 total incidents (6,858 additional with secondary motivation), 49 with confirmed data disclosure. Key findings The Crimeware pattern continues to be driven by external organized criminal groups that are financially motivated. Establishment of control over a device using C2 malware followed by ransomware, then the targeting of credentials or enrollment into a botnet accounts for the majority of the incidents. Point-of-Sale Intrusions Payment Card Skimmers CrimewareWeb App Attacks Denial-of- Service Attacks Physical Theft and Loss Insider and Privilege Misuse Miscellaneous Errors Cyber- espionage
  • 50. Verizon 2016 Data Breach Investigations Report 46 6,800 instances of identified devices launching traffic at unknown victims would have dominated the numbers in such a way that it would deter from the usability of the data. Ransomware, in the number two spot, realized the biggest jump in our data and this will continue to be an element that we track. In case you missed it, ransomware is malware that encrypts files resident on the infected device and, in worst cases, attached file shares. Extortion demands follow, leveraging the need for availability of the data. This is cut from the same cloth as denial- of-service extortion, but typically is opportunistic in nature and affects organizations and consumers alike. The rest of the top five draw out a very familiar pattern involving banking Trojans. The criminal groups behind these families of malware know that you need to control your infected minions (C2/backdoor), and you need to capture (keylogger) and send (export data) the banking credential information—so these are the tools of the trade. These functionalities are top-heavy this year, but are by no means new or indicative of an upward trend. Generally speaking, there are three major avenues for crimeware installation, either via emails with malicious attachments, websites serving up drive-by downloads with each visit, or a hybrid of the two—emails with links to pages with, you guessed it, drive-by code installs. 175 148 42 21 19Export data Backdoor Spyware/keylogger Ransomware C2 Incident count Figure 33. Top five malware varieties within Crimeware, (n=382) Figure 34. Top five malware vectors within Crimeware, (n=135) 63 61 39 10 10Network propagation Download by malware Email link Web drive-by Email attachment Incident count Point-of-Sale Intrusions Payment Card Skimmers CrimewareWeb App Attacks Denial-of- Service Attacks Physical Theft and Loss Insider and Privilege Misuse Miscellaneous Errors Cyber- espionage
  • 51. Verizon 2016 Data Breach Investigations Report 47 We look to non-incident data for the rest of this section to provide some more malware information. We first wanted to reaffirm what we found last year regarding the uniqueness of hashes. To hash or not to hash? Let’s not. Last year we burst many a bubble by calling out that a unique hash does not mean you have been targeted by an ultra-sophisticated group of nation state malware ninjas. This year, we compared hashes out of a total of 40 million records of malware from several contributors and noticed that again there was little overlap across organizations. When investigating for commonalities, we saw that about 20,000 MD5 hashes existed across multiple organizations out of almost 3.8 million unique hashes. And poof, he’s gone. We then looked at how long hashes were used for. Drumroll please … not long. When looking at the difference between when a hash was first seen versus when it was last seen, we saw that the count of hashes over this time difference was very much long-tailed (see Figure 36 below). The vast majority were used for a very short period of time and then dropped off the face of the network. Do you want ransomware? Because that’s how you get ransomware! We stated earlier that because run-of-the-mill malware does not always merit incident responders rappelling in through skylights and cloning drives, it is a bit light on details. We did however receive a group of ransomware cases where the vector was known (hooray!) and what was specifically exploited (Flash). Even better was that we had the version of Flash exploited and the current Flash version. We thought, “This could be interesting—how bad can people be at updating Flash?” The answer is, very bad. This is a small sample size, but the results were still eye-opening. We aren’t putting this here to ring the shame bell at anyone, but Figure 35 shows that over one half of these browsers were rocking Flash versions that were over a year older than the current revision. The speed of Lewis Hamilton was not required for the majority of these drive-by downloads; the pace of a horse- drawn carriage would have done just fine. It should be noted that some organizations with more togetherness in their act also fell victim, with one having a version that was current and another only two weeks older than the latest iteration. 0 1 2 Years Figure 35. Time from release date of exploited Flash version to release date of current version at time of exploitation (n=15) We then looked at how long hashes were used for. Drumroll please… not long. Point-of-Sale Intrusions Payment Card Skimmers CrimewareWeb App Attacks Denial-of- Service Attacks Physical Theft and Loss Insider and Privilege Misuse Miscellaneous Errors Cyber- espionage
  • 52. Verizon 2016 Data Breach Investigations Report 48 Analysis of one of our larger datasets showed that 99% of malware hashes are seen for only 58 seconds or less. In fact, most malware was seen only once. This reflects how quickly hackers are modifying their code to avoid detection. Recommended controls Where be me eye patch, matey? We know that malware droppers, in many cases, succeed by exploiting known vulnerabilities, so utilize those patches that your vendors release for your OS, applications (cough, browsers, cough) and security tools. Exes, stop calling! Defending against malicious executables ranges from not allowing programs to run scripts/macros (e.g., document-based programs) to having your email server strip/remove executables or other file extensions as attachments in emails. Less is more in this scenario, as you will be reducing the attack surface. Don’t monkey around. Don’t be like the three wise monkeys here. See, listen and discuss. As suggested in last year’s report, capture malware analysis data in your own environment; actually look into the different families of malware in your own organization and, if at all possible, the entry point. 0.5M 1M 1.5M 2M 0 200 400 Seconds Countofhashes 100 300 500 Figure 36. Count of hashes by lifespan in seconds, (n=2.3 million) The lifespan of malware hashes is short and not so sweet. Point-of-Sale Intrusions Payment Card Skimmers CrimewareWeb App Attacks Denial-of- Service Attacks Physical Theft and Loss Insider and Privilege Misuse Miscellaneous Errors Cyber- espionage