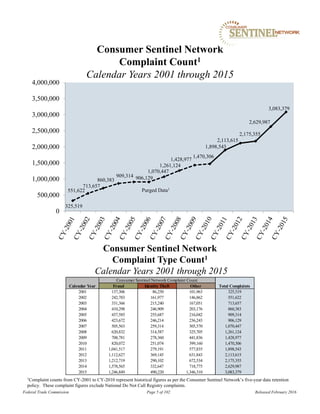
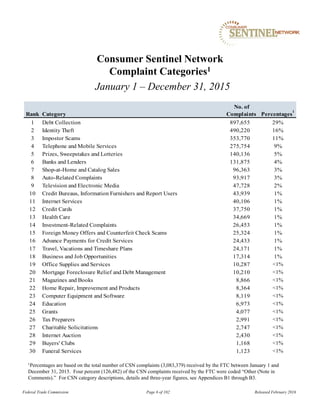
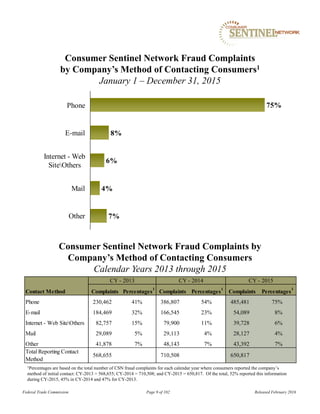
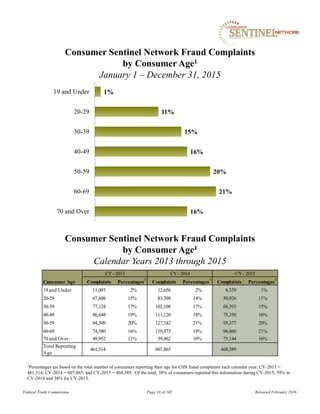
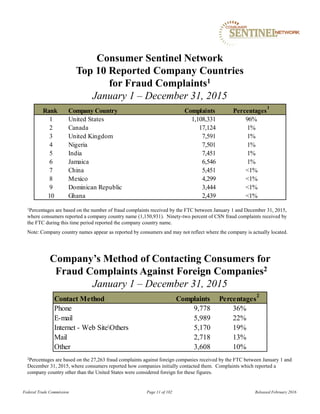
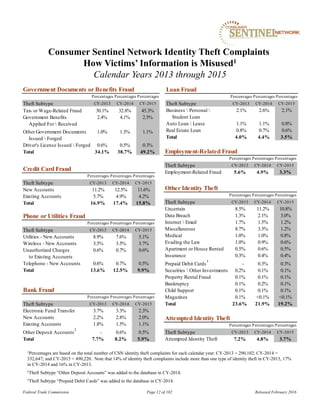
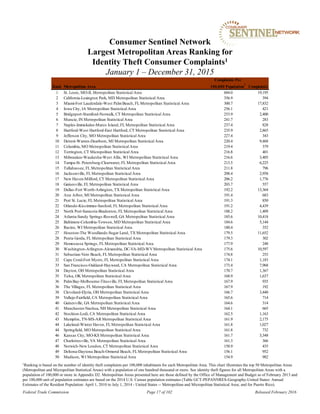
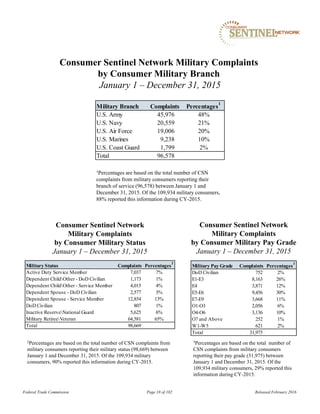
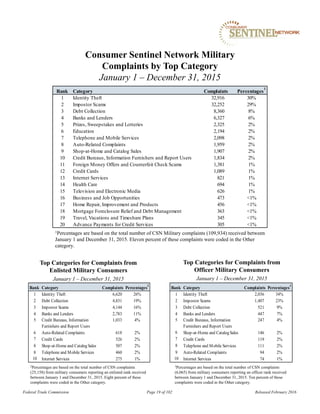
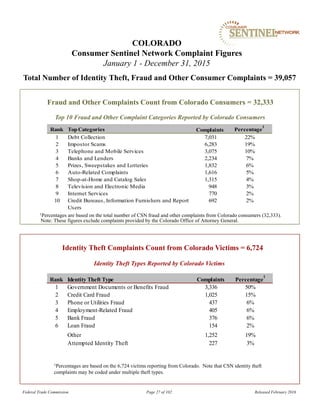
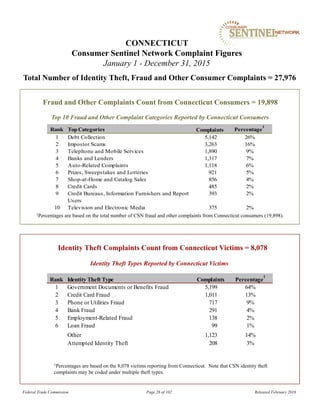
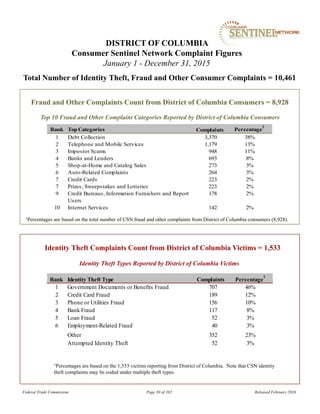
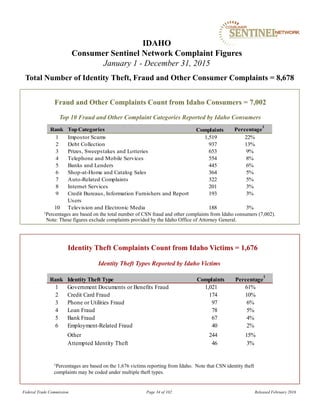
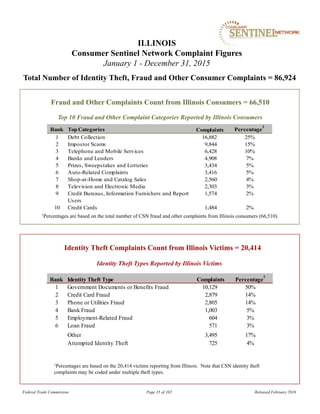
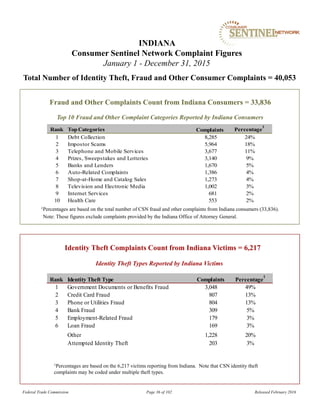
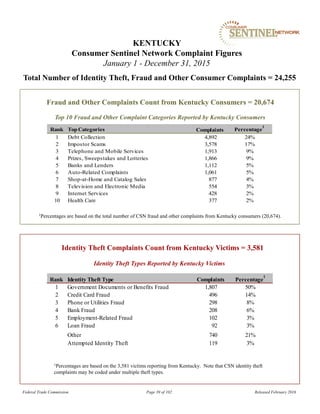
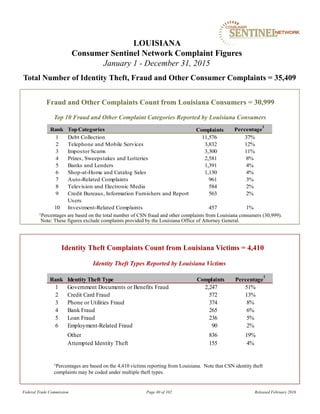
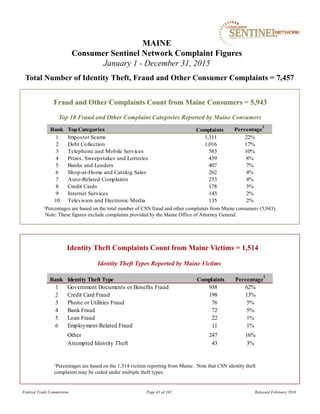
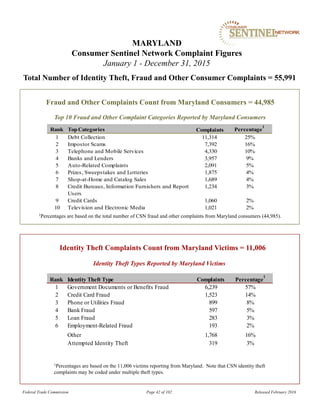
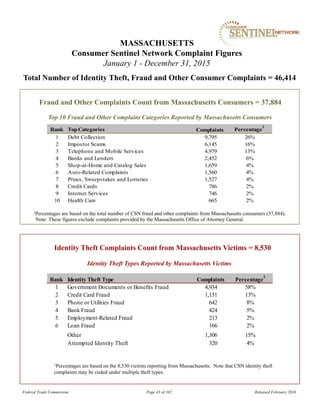
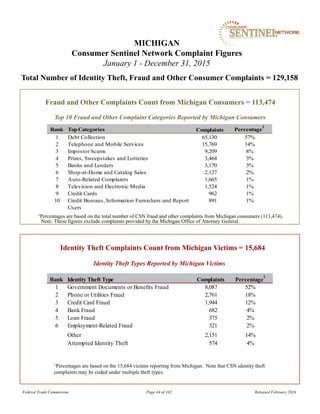
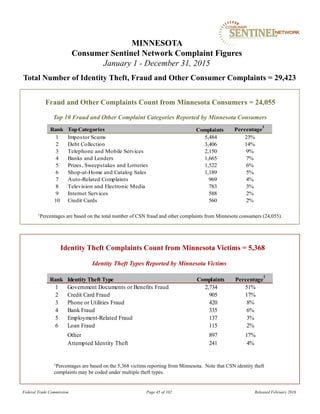
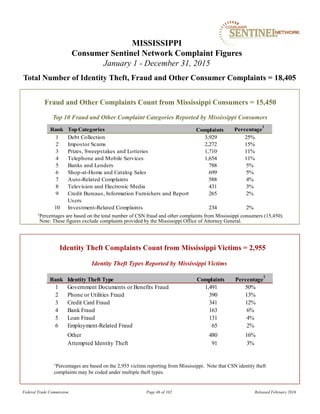
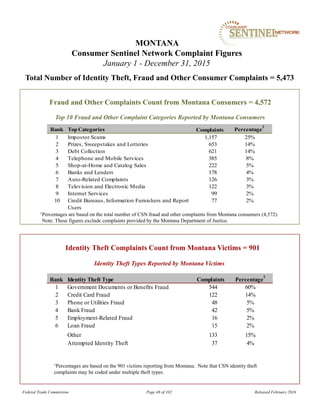
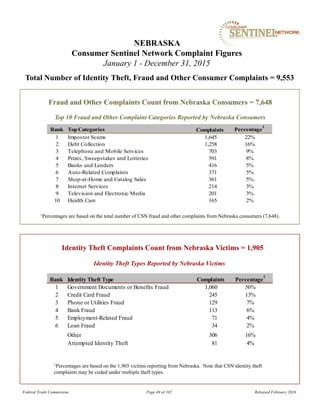
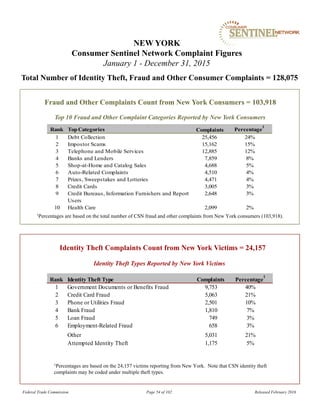
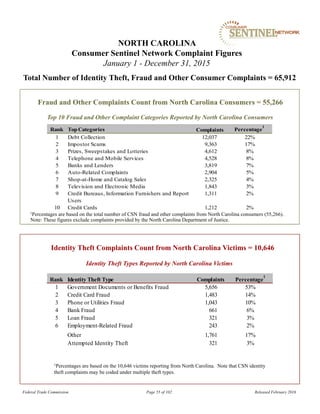
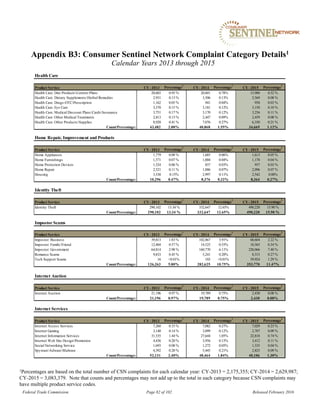
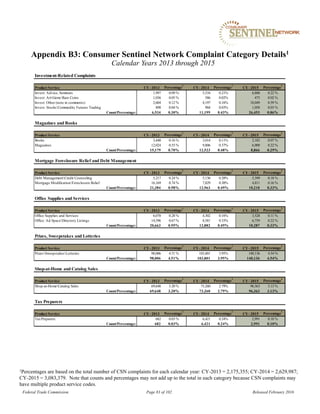
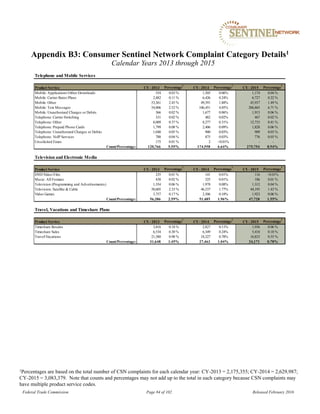
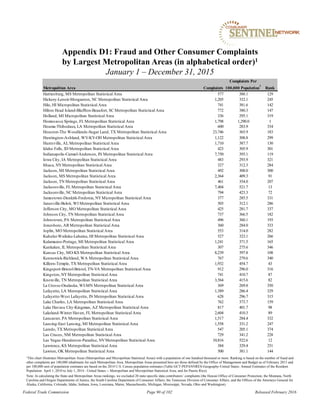
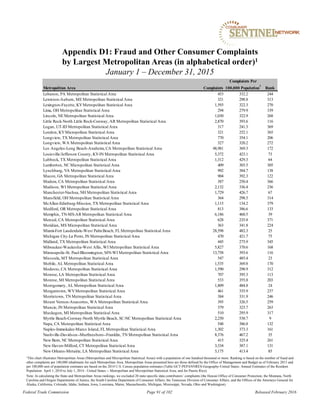
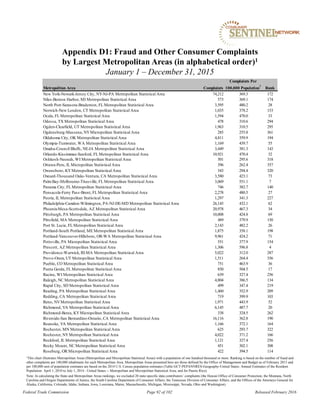
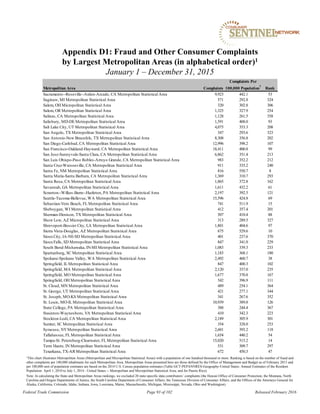
Download to read offline


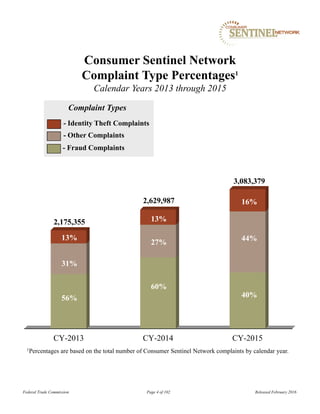
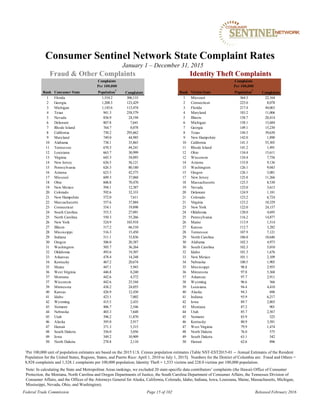
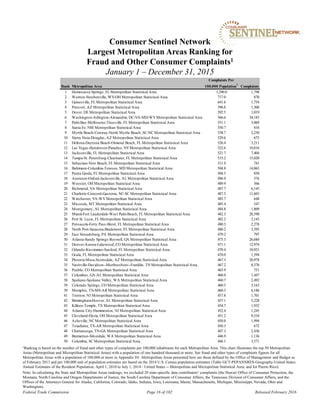


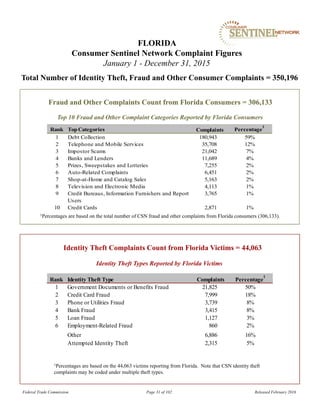


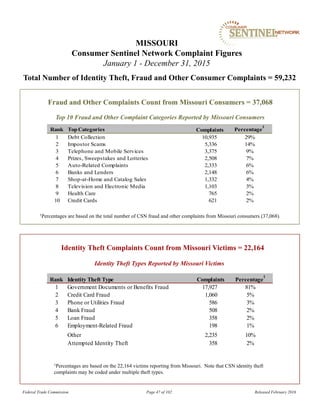


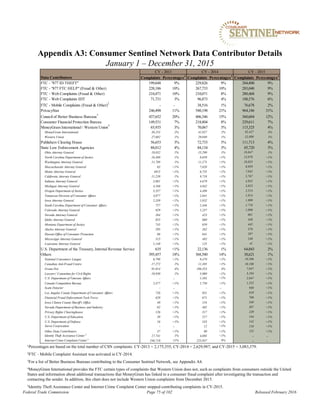

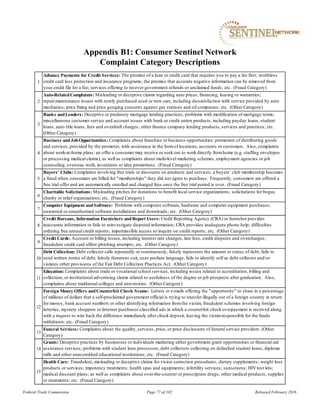


The Consumer Sentinel Network (CSN) report for 2015 indicates that over 3 million complaints were received, with debt collection being the most common type, followed by identity theft and fraud. Florida had the highest rate of reported fraud complaints per capita, while Missouri had the highest rate for identity theft. The CSN now contains nearly 12 million complaints, which are utilized by law enforcement to coordinate investigations and enhance consumer protection efforts.


