Download as PDF, PPTX
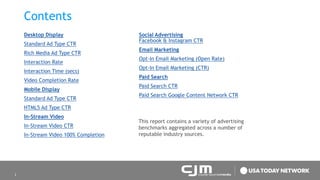
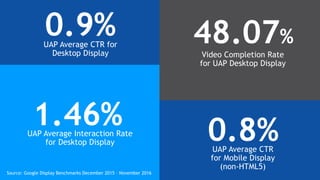
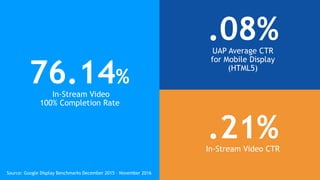
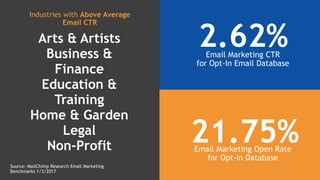

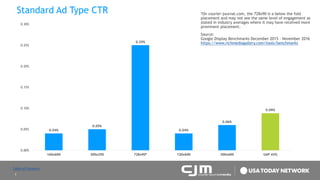
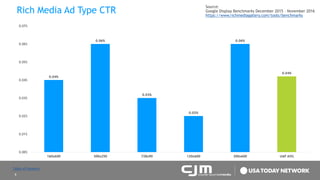
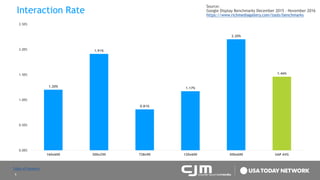
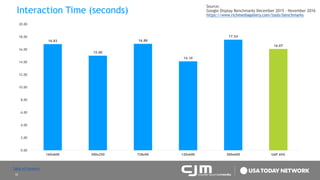
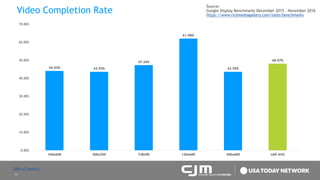

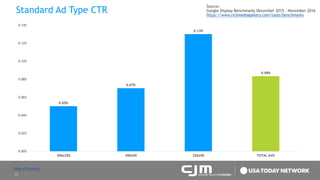
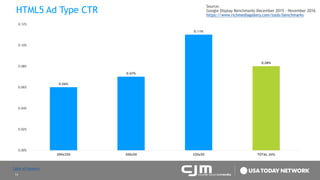

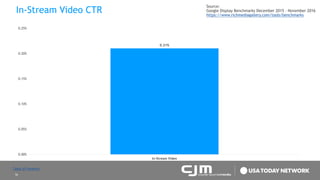
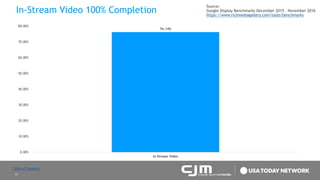

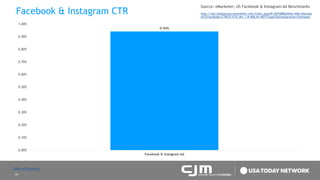

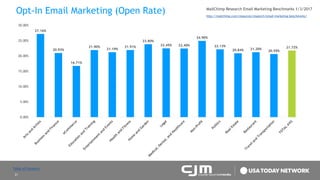
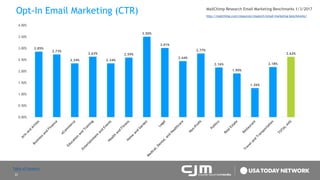

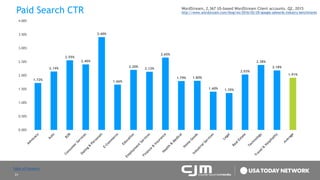
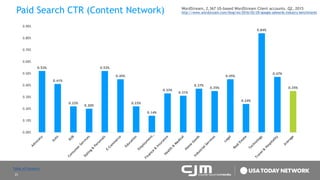

The document is a 2017 online advertising benchmarks report which aggregates data on various advertising types across different platforms, including desktop and mobile displays, video ads, and email marketing. Key performance indicators like click-through rates (CTR), interaction rates, and video completion rates are presented from reputable industry sources. The report aims to provide advertisers with insights into performance metrics to evaluate their own advertising strategies.


![[EN].CleverGroup Vietnam Profile 20251202](https://cdn.slidesharecdn.com/ss_thumbnails/en-260120091417-fe6f88ec-thumbnail.jpg?width=640&height=640&fit=bounds)


![[rokonz.com] Glossary of Semantic SEO Part-1.pdf](https://cdn.slidesharecdn.com/ss_thumbnails/rokonz-260123200456-440e4060-thumbnail.jpg?width=640&height=640&fit=bounds)


