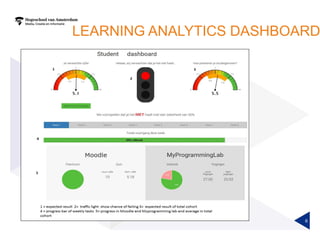
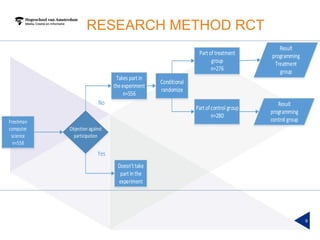
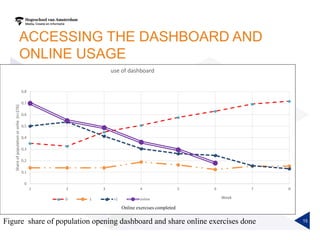
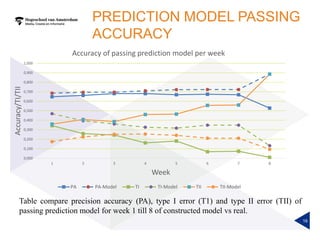
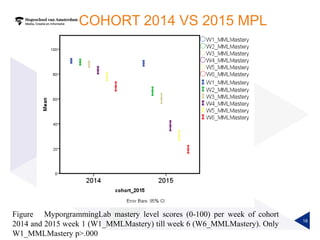
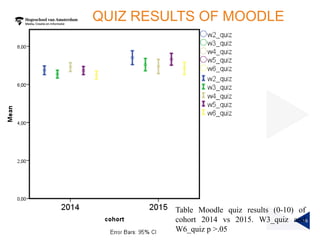
THE EFFECT OF A LEARNING ANALYTICS
DASHBOARD ON THE PASSING RATE OF A
PROGRAMMING COURSE.
A RANDOMIZED CONTROLLED EXPERIMENT.
Jan Hellings
J.F.HELLINGS@HVA.NL
Amsterdam University of applied science
COMPUTERSCIENCE DEPARTMENT
HBO-ICT
1
JOURNEY OF CLASSES OF JAVA
PROGRAMMING COURSE
2
HELP MY CLASSROOM IS FLIPPED !
3
4
CONFUSED COMPUTER SCIENCE
STUDENT
5
LEARNING ANALYTICS DASHBOARD
6
JAVA PROGRAMMING COURSE
• Introduction course of Java programming of 3 ECTS
• Freshman of computer science education University of applied
science
• 7 weeks 2 lessons of two hours a week
• Flip the classroom
• Two LMS
• Moodle quiz + practical assignment
• MyProgrammingLab of Pearson e-text tutorial
• Book: Introduction to Java Programming, Comprehensive, 10th Ed.
by Daniel Liang.
• Exam: writing a small Java program.
7
RESEARCH QUESTIONS
• Will the learning analytics dashboard
improve the passing rate and the grades
of the students participating in the Java
programming course?
• Will the learning analytics dashboard
increase the online activities of students?
8
RESEARCH METHOD RCT
9
Freshman
computer
science
n=558
Objection against
participation
Takes part in
theexperiment
n=556
Doesn t take
part in the
experiment
Conditional
randomize
Part of treatment
group
n=276
Part ofcontrol group
n=280
No
Yes
Result
programming
Treatment
group
Result
programming
control group
GENERATING DASHBOARDS
PREDICTION MODELS
10
Week 0 Week1
Dashboard
1
Demographic
data
Myproglab
#Attemps
Mastery
Moodle
Quiz
result
Pracitcal
Assignme
nt
Predic
tion
Model
1
week2
Dashboard
2
Myproglab
#Attemps
Mastery
Moodle
Quiz
result
Pracitcal
Assignme
nt
Predic
tion
Model
2
week3
Dashboard
3
Myproglab
#Attemps
Mastery
Moodle
Quiz
result
Pracitcal
Assignme
nt
Predic
tion
Model
3
week4
Dashboard
4
Myproglab
#Attemps
Mastery
Moodle
Quiz
result
Pracitcal
Assignme
nt
Predic
tion
Model
4
week5
Dashboard
5
Myproglab
#Attemps
Mastery
Moodle
Quiz
result
Pracitcal
Assignme
nt
Predic
tion
Model
5
week6
Dashboard
6
Myproglab
#Attemps
Mastery
Moodle
Quiz
result
Pracitcal
Assignme
nt
Predic
tion
Model
6
week7
Dashboard
7
Myproglab
#Attemps
Mastery
Moodle
Quiz
result
Pracitcal
Assignme
nt
Predic
tion
Model
6
week8
Dashboard
8
Myproglab
#Attemps
Mastery
Moodle
Quiz
result
Pracitcal
Assignme
nt
Predic
tion
Model
8
RESULTS PASSED
11
n=556. Missing =100. Passed: 332 Failed= 124
figure The mean of passing the exams of the treatment- and control group X
2
(1) ,5,
(1) ,28.
RESULTS GRADES
12
Figure the means and standard deviations of the grades for programming of the
treatment – and control group.
ONLINE USAGE
MYPROGRAMMINGLAB
13
Figure the mean and standard deviation of the Mastery Level (MMLmastery)
scores of the control – and treatment group extracted from MPL
*p< .10
Mastery level MMLmastery score MyProgrammingLab
per week
Week Mastery Mcontrol Mdashboard p
Week 4 34.928* 42.017* .074
Week 5 27.470* 34.118* .094
Week 6 16.546* 22.508* .051
QUIZ RESULTS OF MOODLE
14• Figure means of quiz results of week 1 till 6 extracted from Moodle. No
significant differences.
ACCESSING THE DASHBOARD AND
ONLINE USAGE
15
0
0,1
0,2
0,3
0,4
0,5
0,6
0,7
0,8
1 2 3 4 5 6 7 8
Shareofpopulationoronlie(n=276)
Week
use of dashboard
0 1 >1 online
Online exercises completed
Figure share of population opening dashboard and share online exercises done
PREDICTION MODEL PASSING
ACCURACY
16
Table compare precision accuracy (PA), type I error (T1) and type II error (TII) of
passing prediction model for week 1 till 8 of constructed model vs real.
0,000
0,100
0,200
0,300
0,400
0,500
0,600
0,700
0,800
0,900
1,000
1 2 3 4 5 6 7 8
Accuracy/TI/TII
Week
Accuracy of passing prediction model per week
PA PA-Model TI TI-Model TII TII-Model
PREDICTION MODEL GRADE (GPM)
Figure R2 for Grade Prediction Model (GPM) per week
1 Tempelaar, D. T., Rienties, B.,& Giesbers, B. (2014).
In search for the most informative data for feedback generation: Learning analytics in a data-rich context.
Computers in Human Behavior. http://doi.org/10.1016/j.chb.2014.05.038
0,000
0,100
0,200
0,300
0,400
0,500
0,600
0,700
0,800
1 2 3 4 5 6 7 8
R2
Week
Coefficient of determination R2 of grade prediction model compared to
literature1 and generated model
GPM Lit model
COHORT 2014 VS 2015 MPL
18
Figure MyporgrammingLab mastery level scores (0-100) per week of cohort
2014 and 2015 week 1 (W1_MMLMastery) till week 6 (W6_MMLMastery). Only
W1_MMLMastery p>.000
QUIZ RESULTS OF MOODLE
19
Table Moodle quiz results (0-10) of
cohort 2014 vs 2015. W3_quiz and
W6_quiz p >.05
COHORT 2014 VS 2015
20
Online behaviour 2014 2015
Practical assignment 54% 17%
Quiz Moodle 62% 25%
MyProgrammingLab 64% 7%
Table online behaviour week 6 Practical assignment and quiz
Moodle and MyProgrammingLab
FLIP THE CLASSROOM
21
CONCLUSIONS RESEARCH QUESTIONS
• Will the learning analytics dashboard improve the
passing rate and the grades of the students participating
in the Java programming course?
• Dashboard had no effect on the passing rate and grade
• Will the learning analytics dashboard increase the online
activities of students?
• Dashboard had a small effect on the online behaviour
about 5% more on p<.1
22
CONCLUSIONS
• RCT: differences outcomes between treatment and control
group attributed solely to intervention.
• Prediction models
• Prediction accuracy model passing .528 till .681 Lit :
.75-.863 or .972-.9792. Type II error real model >>
generated model.
• Coefficient of determination R2 of grade model: .152 till
.331. Lit: .4 -.71 Until week 6 better generated model.
• Online usage of cohort 2014 >> cohort 2015
• Flip the classroom make pre-class preparation compulsory or
summative.
23
2 Hu, Y.-H., Lo, C.-L., & Shih, S.-P. (2014). Developing early warning systems to predict students’ online learning performance. Computers in
Human Behavior, 36(0), 469–478. http://doi.org/http://dx.doi.org/10.1016/j.chb.2014.04.002
3 Lauría, E. J. M., Moody, E. W., Jayaprakash, S. M., Jonnalagadda, N., & Baron, J. D. (2013). Open Academic Analytics Initiative: Initial
Research Findings. In Proceedings of the Third International Conference on Learning Analytics and Knowledge (pp. 150–154). New York,
NY, USA: ACM. http://doi.org/10.1145/2460296.2460325
1 Tempelaar, D. T., Rienties, B.,& Giesbers, B. (2014).
In search for the most informative data for feedback generation: Learning analytics in a data-rich context.
Computers in Human Behavior. http://doi.org/10.1016/j.chb.2014.05.038
QUESTIONS?
24

20160423EdinburghPresentationV1

  • 1.
    THE EFFECT OFA LEARNING ANALYTICS DASHBOARD ON THE PASSING RATE OF A PROGRAMMING COURSE. A RANDOMIZED CONTROLLED EXPERIMENT. Jan Hellings J.F.HELLINGS@HVA.NL Amsterdam University of applied science COMPUTERSCIENCE DEPARTMENT HBO-ICT 1
  • 2.
    JOURNEY OF CLASSESOF JAVA PROGRAMMING COURSE 2
  • 3.
    HELP MY CLASSROOMIS FLIPPED ! 3
  • 4.
  • 5.
  • 6.
  • 7.
    JAVA PROGRAMMING COURSE •Introduction course of Java programming of 3 ECTS • Freshman of computer science education University of applied science • 7 weeks 2 lessons of two hours a week • Flip the classroom • Two LMS • Moodle quiz + practical assignment • MyProgrammingLab of Pearson e-text tutorial • Book: Introduction to Java Programming, Comprehensive, 10th Ed. by Daniel Liang. • Exam: writing a small Java program. 7
  • 8.
    RESEARCH QUESTIONS • Willthe learning analytics dashboard improve the passing rate and the grades of the students participating in the Java programming course? • Will the learning analytics dashboard increase the online activities of students? 8
  • 9.
    RESEARCH METHOD RCT 9 Freshman computer science n=558 Objectionagainst participation Takes part in theexperiment n=556 Doesn t take part in the experiment Conditional randomize Part of treatment group n=276 Part ofcontrol group n=280 No Yes Result programming Treatment group Result programming control group
  • 10.
    GENERATING DASHBOARDS PREDICTION MODELS 10 Week0 Week1 Dashboard 1 Demographic data Myproglab #Attemps Mastery Moodle Quiz result Pracitcal Assignme nt Predic tion Model 1 week2 Dashboard 2 Myproglab #Attemps Mastery Moodle Quiz result Pracitcal Assignme nt Predic tion Model 2 week3 Dashboard 3 Myproglab #Attemps Mastery Moodle Quiz result Pracitcal Assignme nt Predic tion Model 3 week4 Dashboard 4 Myproglab #Attemps Mastery Moodle Quiz result Pracitcal Assignme nt Predic tion Model 4 week5 Dashboard 5 Myproglab #Attemps Mastery Moodle Quiz result Pracitcal Assignme nt Predic tion Model 5 week6 Dashboard 6 Myproglab #Attemps Mastery Moodle Quiz result Pracitcal Assignme nt Predic tion Model 6 week7 Dashboard 7 Myproglab #Attemps Mastery Moodle Quiz result Pracitcal Assignme nt Predic tion Model 6 week8 Dashboard 8 Myproglab #Attemps Mastery Moodle Quiz result Pracitcal Assignme nt Predic tion Model 8
  • 11.
    RESULTS PASSED 11 n=556. Missing=100. Passed: 332 Failed= 124 figure The mean of passing the exams of the treatment- and control group X 2 (1) ,5, (1) ,28.
  • 12.
    RESULTS GRADES 12 Figure themeans and standard deviations of the grades for programming of the treatment – and control group.
  • 13.
    ONLINE USAGE MYPROGRAMMINGLAB 13 Figure themean and standard deviation of the Mastery Level (MMLmastery) scores of the control – and treatment group extracted from MPL *p< .10 Mastery level MMLmastery score MyProgrammingLab per week Week Mastery Mcontrol Mdashboard p Week 4 34.928* 42.017* .074 Week 5 27.470* 34.118* .094 Week 6 16.546* 22.508* .051
  • 14.
    QUIZ RESULTS OFMOODLE 14• Figure means of quiz results of week 1 till 6 extracted from Moodle. No significant differences.
  • 15.
    ACCESSING THE DASHBOARDAND ONLINE USAGE 15 0 0,1 0,2 0,3 0,4 0,5 0,6 0,7 0,8 1 2 3 4 5 6 7 8 Shareofpopulationoronlie(n=276) Week use of dashboard 0 1 >1 online Online exercises completed Figure share of population opening dashboard and share online exercises done
  • 16.
    PREDICTION MODEL PASSING ACCURACY 16 Tablecompare precision accuracy (PA), type I error (T1) and type II error (TII) of passing prediction model for week 1 till 8 of constructed model vs real. 0,000 0,100 0,200 0,300 0,400 0,500 0,600 0,700 0,800 0,900 1,000 1 2 3 4 5 6 7 8 Accuracy/TI/TII Week Accuracy of passing prediction model per week PA PA-Model TI TI-Model TII TII-Model
  • 17.
    PREDICTION MODEL GRADE(GPM) Figure R2 for Grade Prediction Model (GPM) per week 1 Tempelaar, D. T., Rienties, B.,& Giesbers, B. (2014). In search for the most informative data for feedback generation: Learning analytics in a data-rich context. Computers in Human Behavior. http://doi.org/10.1016/j.chb.2014.05.038 0,000 0,100 0,200 0,300 0,400 0,500 0,600 0,700 0,800 1 2 3 4 5 6 7 8 R2 Week Coefficient of determination R2 of grade prediction model compared to literature1 and generated model GPM Lit model
  • 18.
    COHORT 2014 VS2015 MPL 18 Figure MyporgrammingLab mastery level scores (0-100) per week of cohort 2014 and 2015 week 1 (W1_MMLMastery) till week 6 (W6_MMLMastery). Only W1_MMLMastery p>.000
  • 19.
    QUIZ RESULTS OFMOODLE 19 Table Moodle quiz results (0-10) of cohort 2014 vs 2015. W3_quiz and W6_quiz p >.05
  • 20.
    COHORT 2014 VS2015 20 Online behaviour 2014 2015 Practical assignment 54% 17% Quiz Moodle 62% 25% MyProgrammingLab 64% 7% Table online behaviour week 6 Practical assignment and quiz Moodle and MyProgrammingLab
  • 21.
  • 22.
    CONCLUSIONS RESEARCH QUESTIONS •Will the learning analytics dashboard improve the passing rate and the grades of the students participating in the Java programming course? • Dashboard had no effect on the passing rate and grade • Will the learning analytics dashboard increase the online activities of students? • Dashboard had a small effect on the online behaviour about 5% more on p<.1 22
  • 23.
    CONCLUSIONS • RCT: differencesoutcomes between treatment and control group attributed solely to intervention. • Prediction models • Prediction accuracy model passing .528 till .681 Lit : .75-.863 or .972-.9792. Type II error real model >> generated model. • Coefficient of determination R2 of grade model: .152 till .331. Lit: .4 -.71 Until week 6 better generated model. • Online usage of cohort 2014 >> cohort 2015 • Flip the classroom make pre-class preparation compulsory or summative. 23 2 Hu, Y.-H., Lo, C.-L., & Shih, S.-P. (2014). Developing early warning systems to predict students’ online learning performance. Computers in Human Behavior, 36(0), 469–478. http://doi.org/http://dx.doi.org/10.1016/j.chb.2014.04.002 3 Lauría, E. J. M., Moody, E. W., Jayaprakash, S. M., Jonnalagadda, N., & Baron, J. D. (2013). Open Academic Analytics Initiative: Initial Research Findings. In Proceedings of the Third International Conference on Learning Analytics and Knowledge (pp. 150–154). New York, NY, USA: ACM. http://doi.org/10.1145/2460296.2460325 1 Tempelaar, D. T., Rienties, B.,& Giesbers, B. (2014). In search for the most informative data for feedback generation: Learning analytics in a data-rich context. Computers in Human Behavior. http://doi.org/10.1016/j.chb.2014.05.038
  • 24.