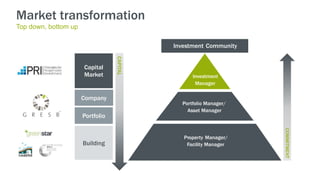
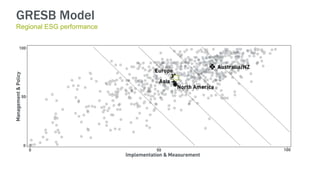
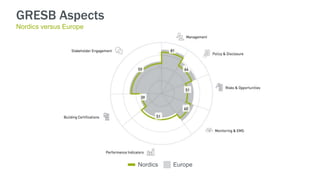
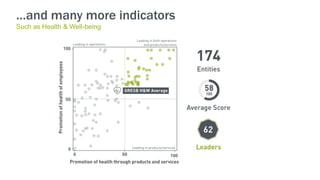
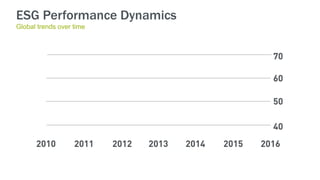
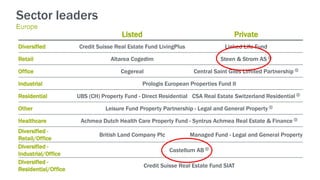
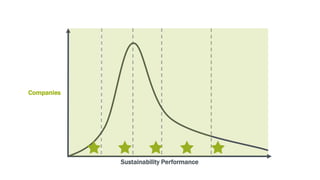
7.3
billion
USD73
trillion
9.8
GtC/year
+0.810C above 20th century average
Worldwide
GDP CO2
Population
ACTIAM
Aegon NV
Alberta Investment Management Corporation
(AIMCo)
Amundi
AMP Capital
AP1 First Swedish National Pension Fund
AP2 Second Swedish National Pension Fund
AP3 Third Swedish National Pension Fund
AP4 Fourth Swedish National Pension Fund
AP7 Seventh Swedish National Pension Fund
Archbishops' Council
Armstrong Asset Management
ATP
Australian Ethical Investment
AustralianSuper
Aviva Investors
AXA
AXA IM
Baldwin Brothers Inc.
Bank J. Safra Sarasin
Bayerische Versorgungskammer
Bedfordshire Pension Fund
BMO Global Asset Management
BNP Paribas Investment Partners
Brawn Capital
Brown University Sustainable Investment Fund
BT Pension Scheme
California Public Employees' Retirement System
California State Teachers' Retirement System
Cathay Financial Holding Co., Ltd.
Catholic Super CBRE Global Investors
Cbus Super
CCLA
Central Finance Board of the Methodist Church
Christian Brothers Investment Services
Christian Super
Christopher Reynolds Foundation
Church Commissioners for England
Church of England Pensions Board
Church of Sweden
Connecticut Retirement Plans and Trust Funds
Dana Investment Advisors
Danske Bank Asset Management
Danske Civil- og Akademiingeniørers
Pensionskasse
Deutsche Asset Management
Dragon Capital
EdenTree Investment Management Ltd.
Encourage Capital
Environment Agency Pension Fund
Epworth Investment Management Ltd
ERAFP
ESSSuper
ETF Partners
Eureka Funds Management
First Affirmative Financial Network
Friends Fiduciary Corporation
Friends Provident Charitable Foundation
FRR - Fonds de Réserve pour les Retraites
Greater Manchester Pension Fund
Henderson Global Investors
Hermes Investment Management
HESTA
HSBC Global Asset Management
IFM Investors
Impax Asset Management
Inflection Point Capital Management
Insight Investment
Jesuits in Britain
Juristernes og Økonomernes Pensionskasse
Kempen Capital Management
L&G Investment Management
Local Government Super
London Pensions Fund Authority
Mercer
Merseyside Pension Fund
Miller/Howard Investments, Inc.
Mirova MN Nanuk Asset Management Pty Ltd
Natixis Asset Management
NEI Investments
New York City Comptroller
New York State Common Retirement Fund
New Zealand Superannuation Fund
NextEnergy Capital
Nordea Wealth Management
North East Scotland Pension Fund
OFI
Ohman
Old Mutual Global Investors
OPTrust Oregon State Treasurer
OTTP
Pax World Management LLC
PensionDanmark
PGGM
PKA
Plater Trust
Railpen Investments
Rathbone Greenbank Investments
Representative Body of the Church of Ireland
Reynders, McVeigh Capital Management
Robeco
Russell Investments
Sisters of St. Dominic of Caldwell, New Jersey
Sonen Capital
South Yorkshire Pensions Authority
Stafford Sustainable Capital
Statewide Super
Tellus Mater Foundation
Temporis Capital LLP
The Barrow Cadbury Trust
The Joseph Rowntree Charitable Trust
The Pensions Trust
The Sustainability Group at Loring, Wolcott and
Coolidge
The United Reformed Church
Trillium Asset Management
Trustees of Amherst College
Unipension FAIF A/S
Unitarian Universalist Association
USS
Veris Wealth Partners
VicSuper
Vision Super Pty Ltd
Walden Asset Management
Wespath Benefits and Investments
West Midlands Pension Fund
West Yorkshire Pension Fund
WHEB
130
investors
INTRODUCING THE 11TH
GICS® SECTOR: REAL ESTATE
Buildings are (a big part of) the problem…
99TWh 27.9Mt 0.47km3 15.5Mt
Innovation in renewable energy
…but also part of the solution
Innovation in waste management
…but also the solution
Market
Transformation
Sustainability Performance
Building Stock
Leading
BREEAM Outstanding
LEED Platinum
Green Star Six Star
Etc.
Regulation
Market transformation
Top down, bottom up
Capital
Market
Company
Portfolio
Building
Investment Community
CAPITAL
Investment
Manager
Portfolio Manager/
Asset Manager
Property Manager/
Facility Manager
COMMITMENT
TRANSPARENCY RISKOPPORTUNITY
3.9x
The difference in overall
GRESB score between the
Top 10% and Bottom 10%
entities in 2016
73,988
Homes
Energy
LFL consumption (between 2014-2015)
90,197
passenger
cars
Carbon
LFL consumption (between 2014-2015)
1,200
Olympic
pools
Water
LFL consumption (between 2014-2015)
14,963
truck loads
Waste
LFL consumption (between 2014-2015)
The Assessment
REAL ESTATE PORTFOLIOS
PROPERTY
COMPANIES
CAPITAL
MARKET
BENCHMARK
SCORE
ASSESS
COMMUNICATE
DATA QUALITY
DATA PARTNERS (API)
GRESB ASSET DATA
FREE GRESB ASSET SPREADSHEETS
GRESB
SCORE
Management
Policy & Disclosure
Risks & Opportunities
Monitoring & EMS
Building Certification
Stakeholder
Engagement
Performance Indicators
8.8
%
9.5
%
12.4
% 25.2
%
24.5
%
10.9
%
8.8
%
GRESB Coverage
63 Countries 759 Entities 66,000 Assets
Response Rate Development
Global
Response Rate Development
Europe
Competitive Differentiation & Advantage
Risk & Uncertainty
USD 2.8 trillion
GRESB Coverage
GRESB Performance
GRESB Model
Global ESG performance
GRESB Model
Regional ESG performance
GRESB Model
Nordics versus Europe
GRESB Model
Sweden versus Europe
GRESB Aspects
Europe
2016 2015
GRESB Aspects
Nordics versus Europe
Nordics Europe
…and many more indicators
Such as Health & Well-being
ESG Performance Dynamics
Global trends over time
Sector leaders
Europe
Listed Private
Diversified Credit Suisse Real Estate Fund LivingPlus Linked Life Fund
Retail Altarea Cogedim Steen & Strom AS 🌐
Office Cegereal Central Saint Giles Limited Partnership 🌐
Industrial Prologis European Properties Fund II
Residential UBS (CH) Property Fund - Direct Residential CSA Real Estate Switzerland Residential 🌐
Other Leisure Fund Property Partnership - Legal and General Property 🌐
Healthcare Achmea Dutch Health Care Property Fund - Syntrus Achmea Real Estate & Finance 🌐
Diversified -
Retail/Office
British Land Company Plc Managed Fund - Legal and General Property
Diversified -
Industrial/Office
Castellum AB 🌐
Diversified -
Residential/Office
Credit Suisse Real Estate Fund SIAT
What drives
performance?
PLAN
DO
CHECK
ACT INDICATOR
Carbon Management
Global
1. ESG policy includes carbon emissions
2. Carbon emissions target in place
3. Due diligence process includes carbon
emissions
4. Risk assessments include carbon emissions
5. Data management system in place
6. Reporting carbon emissions data
7. Offsetting carbon emissions
8. Reporting carbon intensity data
9. External review of carbon emissions data
1.
2.
3.
4.
5.
6.
7.
8.
9.
Intensities – carbon emissions
Input versus output
Road Ahead
Sustainability Performance
Building Stock
Leading
BREEAM Outstanding
LEED Platinum
Green Star Six Star
Etc.
Regulation
Regulation drives radical innovation
…in products and services
Sustainability Performance
Companies
So, what is your GRESB Rating?
“U.S. REITs with higher
GRESB ratings deliver higher
returns per unit of risk”
“2.75% return spread between
the Top 10% and Bottom 10%
European non-listed GRESB
entities”

2016 GRESB Real Estate Swedish Results

  • 2.
    7.3 billion USD73 trillion 9.8 GtC/year +0.810C above 20thcentury average Worldwide GDP CO2 Population
  • 4.
    ACTIAM Aegon NV Alberta InvestmentManagement Corporation (AIMCo) Amundi AMP Capital AP1 First Swedish National Pension Fund AP2 Second Swedish National Pension Fund AP3 Third Swedish National Pension Fund AP4 Fourth Swedish National Pension Fund AP7 Seventh Swedish National Pension Fund Archbishops' Council Armstrong Asset Management ATP Australian Ethical Investment AustralianSuper Aviva Investors AXA AXA IM Baldwin Brothers Inc. Bank J. Safra Sarasin Bayerische Versorgungskammer Bedfordshire Pension Fund BMO Global Asset Management BNP Paribas Investment Partners Brawn Capital Brown University Sustainable Investment Fund BT Pension Scheme California Public Employees' Retirement System California State Teachers' Retirement System Cathay Financial Holding Co., Ltd. Catholic Super CBRE Global Investors Cbus Super CCLA Central Finance Board of the Methodist Church Christian Brothers Investment Services Christian Super Christopher Reynolds Foundation Church Commissioners for England Church of England Pensions Board Church of Sweden Connecticut Retirement Plans and Trust Funds Dana Investment Advisors Danske Bank Asset Management Danske Civil- og Akademiingeniørers Pensionskasse Deutsche Asset Management Dragon Capital EdenTree Investment Management Ltd. Encourage Capital Environment Agency Pension Fund Epworth Investment Management Ltd ERAFP ESSSuper ETF Partners Eureka Funds Management First Affirmative Financial Network Friends Fiduciary Corporation Friends Provident Charitable Foundation FRR - Fonds de Réserve pour les Retraites Greater Manchester Pension Fund Henderson Global Investors Hermes Investment Management HESTA HSBC Global Asset Management IFM Investors Impax Asset Management Inflection Point Capital Management Insight Investment Jesuits in Britain Juristernes og Økonomernes Pensionskasse Kempen Capital Management L&G Investment Management Local Government Super London Pensions Fund Authority Mercer Merseyside Pension Fund Miller/Howard Investments, Inc. Mirova MN Nanuk Asset Management Pty Ltd Natixis Asset Management NEI Investments New York City Comptroller New York State Common Retirement Fund New Zealand Superannuation Fund NextEnergy Capital Nordea Wealth Management North East Scotland Pension Fund OFI Ohman Old Mutual Global Investors OPTrust Oregon State Treasurer OTTP Pax World Management LLC PensionDanmark PGGM PKA Plater Trust Railpen Investments Rathbone Greenbank Investments Representative Body of the Church of Ireland Reynders, McVeigh Capital Management Robeco Russell Investments Sisters of St. Dominic of Caldwell, New Jersey Sonen Capital South Yorkshire Pensions Authority Stafford Sustainable Capital Statewide Super Tellus Mater Foundation Temporis Capital LLP The Barrow Cadbury Trust The Joseph Rowntree Charitable Trust The Pensions Trust The Sustainability Group at Loring, Wolcott and Coolidge The United Reformed Church Trillium Asset Management Trustees of Amherst College Unipension FAIF A/S Unitarian Universalist Association USS Veris Wealth Partners VicSuper Vision Super Pty Ltd Walden Asset Management Wespath Benefits and Investments West Midlands Pension Fund West Yorkshire Pension Fund WHEB 130 investors
  • 5.
    INTRODUCING THE 11TH GICS®SECTOR: REAL ESTATE
  • 6.
    Buildings are (abig part of) the problem… 99TWh 27.9Mt 0.47km3 15.5Mt
  • 7.
    Innovation in renewableenergy …but also part of the solution
  • 8.
    Innovation in wastemanagement …but also the solution
  • 10.
  • 11.
    Sustainability Performance Building Stock Leading BREEAMOutstanding LEED Platinum Green Star Six Star Etc. Regulation
  • 12.
    Market transformation Top down,bottom up Capital Market Company Portfolio Building Investment Community CAPITAL Investment Manager Portfolio Manager/ Asset Manager Property Manager/ Facility Manager COMMITMENT
  • 13.
  • 14.
    3.9x The difference inoverall GRESB score between the Top 10% and Bottom 10% entities in 2016
  • 15.
  • 16.
  • 17.
  • 18.
  • 19.
  • 20.
  • 21.
    DATA PARTNERS (API) GRESBASSET DATA FREE GRESB ASSET SPREADSHEETS
  • 22.
    GRESB SCORE Management Policy & Disclosure Risks& Opportunities Monitoring & EMS Building Certification Stakeholder Engagement Performance Indicators 8.8 % 9.5 % 12.4 % 25.2 % 24.5 % 10.9 % 8.8 %
  • 23.
  • 24.
    63 Countries 759Entities 66,000 Assets
  • 27.
  • 28.
  • 29.
    Competitive Differentiation &Advantage Risk & Uncertainty USD 2.8 trillion GRESB Coverage
  • 30.
  • 31.
  • 32.
  • 33.
  • 34.
  • 35.
  • 36.
    GRESB Aspects Nordics versusEurope Nordics Europe
  • 37.
    …and many moreindicators Such as Health & Well-being
  • 38.
  • 39.
    Sector leaders Europe Listed Private DiversifiedCredit Suisse Real Estate Fund LivingPlus Linked Life Fund Retail Altarea Cogedim Steen & Strom AS 🌐 Office Cegereal Central Saint Giles Limited Partnership 🌐 Industrial Prologis European Properties Fund II Residential UBS (CH) Property Fund - Direct Residential CSA Real Estate Switzerland Residential 🌐 Other Leisure Fund Property Partnership - Legal and General Property 🌐 Healthcare Achmea Dutch Health Care Property Fund - Syntrus Achmea Real Estate & Finance 🌐 Diversified - Retail/Office British Land Company Plc Managed Fund - Legal and General Property Diversified - Industrial/Office Castellum AB 🌐 Diversified - Residential/Office Credit Suisse Real Estate Fund SIAT
  • 40.
  • 41.
  • 42.
    Carbon Management Global 1. ESGpolicy includes carbon emissions 2. Carbon emissions target in place 3. Due diligence process includes carbon emissions 4. Risk assessments include carbon emissions 5. Data management system in place 6. Reporting carbon emissions data 7. Offsetting carbon emissions 8. Reporting carbon intensity data 9. External review of carbon emissions data 1. 2. 3. 4. 5. 6. 7. 8. 9.
  • 43.
    Intensities – carbonemissions Input versus output
  • 44.
  • 46.
    Sustainability Performance Building Stock Leading BREEAMOutstanding LEED Platinum Green Star Six Star Etc. Regulation
  • 47.
    Regulation drives radicalinnovation …in products and services
  • 48.
  • 49.
    So, what isyour GRESB Rating?
  • 50.
    “U.S. REITs withhigher GRESB ratings deliver higher returns per unit of risk” “2.75% return spread between the Top 10% and Bottom 10% European non-listed GRESB entities”

Editor's Notes

  • #3 7.3 billion people, of which most live in cities. This was only 14% a century ago. Annual worldwide GDP output is massive: 73 trillion USD per year This also translates to a considerable carbon footprint, of almost 10 Gigatonne of carbon per year – 400ppm
  • #4 New global commitment to reduce emissions First ever legally-binding climate agreement The Paris Agreement on climate change provides a clear signal to investors that the transition to the low-carbon, clean energy economy is inevitable and already underway. Governments have a responsibility to work with the private sector to ensure that this transition happens fast enough to catalyse the significant investment required to achieve the Paris Agreement’s goals including: Holding the increase in the global average temperature to well below 2°C above pre-industrial levels, and pursuing efforts to limit the temperature increase to 1.5°C above pre-industrial levels, and Achieving net zero greenhouse gas emissions (“a balance between anthropogenic emissions by sources and removals by sinks of GHGs”) in the second half of the century."
  • #5 More responsible investors (130 investors respresenting USD 13 trillion) More focus than ever on environmental, social, and governance performance across all asset classes They urge to: Increase pace of transition Increase green investments I short: carrots & sticks are needed List of investors that signed G20 letter from: http://www.igcc.org.au/resources/Documents/FinalWebInvestorG20Letter24Aug1223pm.pdf
  • #7 4 months electricity supply in the UK 4% of all global carbon emissions from ailrine sector XXXX Olympic pools 2.5 times the Great Pyramid of Gaza
  • #8 Prologies produces one third of on-site renewables in GRESB 2015: 190GWh 2014: 179GWh https://www.greenbiz.com/article/65-billion-real-estate-titan-second-only-walmart-solar Add GRESB Green Star logo/GRESB Green Star rating
  • #9 Link REIT case study - https://www.gresb.com/insights/2016/08/fresh-market-waste-separation-pilot-scheme/?preview_id=11966&preview_nonce=2c17e598f7&preview=true A joke here can be...”Yes this is innovation”
  • #10 But how to differentiate between leading and lagging? GRESB provides unique insight for real estate, and real estate only GRESB provides a global “yardstick”/business intelligence tool to define and recognize leadership Assess Score Benchmark Communicate
  • #11 How can the real estate sector contribute to solving climate issues
  • #12 Regulation provides minimum performance requirements Leaders are in the right tail, however, the bulk is still in the “bell” So, how to move the bell forward (= transformation to net-zero buildings that are safe, healthy, comfortable, connected, socially engaged etc.)
  • #13 We’ve seen that the capital market provides a very effective top down push towards bottom up commitment PRI currently meeting in Singapore – 1,500 asset owners
  • #14 Transparency  companies and funds vary significantly in their environmental, social, and governance performance Opportunity  leadership, quality, competitive advantage, resilience, superior returns, lower operating costs, mitigation of social and environmental impacts Risk  regulation, compliance, obsolesce, competitive disadvantage, physical damage, material impact, lower returns, higher operating costs, excessive social and environmental impacts
  • #15 Almost 4x The difference in overall GRESB score between the Top 10% and Bottom 10% entities in 2016 Message: there is a great differentiation amongst GRESB reporters. Our aim is to provide transparency to the bottom performers in terms of how the top performers are managing risks and utilizing opportunities, so they can close the gap. Top 10% average score: 86.6 Bottom 10% average score: 21.9
  • #16 What does current market transformation look like in terms of reducing the built environment’s footprint? Less energy consumption
  • #17 Less carbon emissions
  • #18 Less water consumption…
  • #19 …and less waste streams
  • #21 Our process to connect industry stakeholders Central in this process is data quality, both at the company/fund level and at the portfolio level
  • #22 But increasingly, also at the asset level. Our API and asset-level spreadsheet provided GRESB participants to report on building data for about 1/3 of all assets that are (indirectly) covered by the benchmark.
  • #24 Something different: highlight GRESB leaders
  • #25 This map shows the countries asset count based on asset level data
  • #26 Listed: 201 Private: 558
  • #28 No need to show these (already included in previous slides)
  • #30 Transparency on ESG provides competitive differentiation & advantage. The opposite is true for lack of transparency.
  • #38 I thought there were 43 leaders?
  • #39 Conclusion: transparency leads to improved performance/leadership
  • #43 ESG policy includes carbon emissions Carbon emissions target in place Due diligence process includes carbon emissions Risk assessments include carbon emissions Data management system in place Reporting carbon emissions data Offsetting carbon emissions Reporting carbon intensity data External review of carbon emissions data
  • #44 Drilling down deeper, companies and funds are also differentiated in terms of carbon output Looking at intensities, this differentiation provides interesting insights into sector types and their impact Looking at intensities per unit of invested capital, it becomes clear where the opportunities for improvement are, and how “green investments” might actually have the most positive impact
  • #46 New global commitment to reduce emissions First ever legally-binding climate agreement The Paris Agreement on climate change provides a clear signal to investors that the transition to the low-carbon, clean energy economy is inevitable and already underway. Governments have a responsibility to work with the private sector to ensure that this transition happens fast enough to catalyse the significant investment required to achieve the Paris Agreement’s goals including: Holding the increase in the global average temperature to well below 2°C above pre-industrial levels, and pursuing efforts to limit the temperature increase to 1.5°C above pre-industrial levels, and Achieving net zero greenhouse gas emissions (“a balance between anthropogenic emissions by sources and removals by sinks of GHGs”) in the second half of the century."
  • #47 Regulation provides minimum performance requirements Leaders are in the right tail, however, the bulk is still in the “bell” So, how to move the bell forward (= transformation to net-zero buildings that are safe, healthy, comfortable, connected, socially engaged etc.)
  • #50 Add real numbers
  • #51 There is an increasing amount of evidence that backs the correlation between financial performance and ESG performance. Studies using GRESB data clearly show that market transformation also makes business sense.