This document summarizes a study on the aggregation behavior of 1-decyl-3-methylimidazolium chloride (C10MeImCl), a surface active ionic liquid, in aqueous solutions both in the absence and presence of sodium carboxymethylcellulose (NaCMC). The aggregation was investigated using techniques like surface tension, conductivity, vapor pressure osmometry and fluorescence measurements. Two characteristic concentrations were identified - critical aggregation concentration and polymer saturation concentration, below which free C10MeImCl micelles do not appear in C10MeImCl-NaCMC solutions. The effects of temperature, NaCMC concentration and bulk solution properties on C10MeImCl self-aggregation were discussed to understand C10MeIm

![256 D. Ray et al. / Carbohydrate Polymers 125 (2015) 255–264
a b
dc
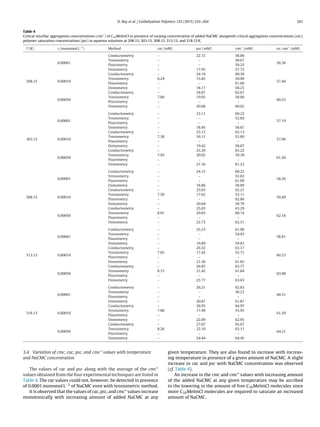
Fig. 1. (a) Surface tension ( ) vs. log[C10MeImCl] profiles in water, (b) surface tension ( ) vs. log[C10MeImCl] profiles in presence of 0.0005 monomol L−1
NaCMC (aq),
(c) specific conductance (Ä) vs. [C10MeImCl] profiles in water and (d) specific conductance (Ä) vs. [C10MeImCl] profiles in presence of 0.0005 monomol L−1
NaCMC (aq) at
298.15 K ( ), 303.15 K ( ), 308.15 K ( ), 313.15 K (᭹), and 318.15 ( ). The tensiograms have been shifted vertically by 10 mN m−1
from each other for clarity. Lines at selected
temperatures are used to guide the eye.
possible role of PEs in modulating the known antimicrobial activity
of SAILs (Łuczak, Jungnickel, Łacka, Stolte, & Hupka, 2010).
In the present contribution, we investigated the aggregation
phenomena and their thermodynamics of a cationic SAIL 1-decyl-
3-methylimidazolium chloride (C10MeImCl) in aqueous solutions
in absence as well as in presence of an ionic PE sodium car-
boxymethylcellulose (NaCMC) as a function of temperature as
probed by tensiometry, conductometry, vapor pressure osmom-
etry, and spectrofluorimetry.
NaCMC is a chemically modified cellulose derivative with high
water solubility, broadly used in food industry, cosmetics, pharma-
ceuticals, suspension agents, formulation agents in controlled
release of drugs and pesticides, papers and paper products, adhe-
sives, ceramics, etc. due to its low cost, lack of toxicity, and
biodegradability (Just & Majewicz, 1985). It would, therefore, be
interesting to study its interacting features with a SAIL.
2. Experimental
NaCMC with an average molecular weight (MW) of 90,000 a
degree of substitution (DS) of 0.7 was obtained from Aldrich Chem-
icals. The average molecular weight of the sample was estimated
from the intrinsic viscosity value (198 mL g−1 in 0.2 M NaCl aque-
ous solution at 25 ◦C) using the Mark–Houwink equation with the
constants obtained from the literature (Eremeeva & Bykova, 1998).
DS was determined by a conductometric procedure as described
by Eyler, Klug, and Diephuis (1947). These values (MW = 89,200
and DS = 0.71) agree well with those declared by the producer.
C10MeImCl (Acros Organics), was used as received.
Triply distilled water with a specific conductance of less than
10−6 S cm−1 at 298.15 K was used for the preparation of solutions.
The surface tension ( ) measurements were performed on a
Krüss (Germany) K9 tensiometer by the platinum ring detach-
ment method (uncertainty = ±0.01 mN m−1). The tensiometer was
connected to a water-flow cryostat in order to maintain the temper-
ature equilibration. Before each measurement, the ring was briefly
heated above a Bunsen burner until glowing. For relatively viscous
solutions in presence of 0.0005 monomol L−1 NaCMC particularly
at low SAIL concentrations, care was taken to ensure equilibra-
tion. The vs. log[C10MeImCl] profiles for NaCMC-free solution and
those for a NaCMC-containing solution are shown, respectively, in
Fig. 1(a) and (b).
The specific conductances (Ä) were measured on a Thermo Sci-
entific conductivity meter with a dip-type cell in a water thermostat
maintained within 0.01 K of the desired temperature. Corrections
were made for the specific conductance of solvents at all tem-
peratures. The Ä vs. [C10MeImCl] profiles for NaCMC-free solution
and that for a representative NaCMC-containing solution with a
concentration of 0.0005 monomol L−1 are depicted, respectively, in
Fig. 1(c) and (d).
The vapor pressure osmometery was performed on an Osmomat
K-7000 (Knauer Inc., Germany) vapor pressure osmometer. Here,
the vapor pressure is measured indirectly by using two thermistors
to measure voltage change caused by changes in temperature. The
measuring chamber contains a reservoir of solvent and paper wicks
to provide a saturated solvent atmosphere. At first, a drop of pure
solvent is attached to each thermistor with the help of a syringe
and after 5 min of equilibration, the reading is adjusted to zero.
Then the pure solvent on one thermistor is replaced by the experi-
mental solution and condensation of solvent from the vapor phase
onto the solution at the thermistor takes place. Due to the heat
of condensation, the thermistor will be warmed up and the vapor
pressure rises. Condensation continues until the vapor pressure of
the solution becomes equal that of the pure solvent. Generally, a
time of 5–10 min was found to be sufficient to reach this steady
state.
First the instrument was calibrated using NaCl (aq) solutions in
the concentration range 0.001–1.5 mol kg−1, yielding a calibration](https://image.slidesharecdn.com/9029c60b-0d00-4ec1-b4e8-401630ca11f5-160219062438/85/2015_CP-2-320.jpg)
![D. Ray et al. / Carbohydrate Polymers 125 (2015) 255–264 257
curve which correlates the osmometer readings to the correspond-
ing concentrations of the NaCl solution. Then the measurements
for the different solutions were carried out. Special care was taken
to keep the drop size and shape as constant as possible and equal
on both thermistors. For each solution, at least five determinations
(zero point adjustment and new solution) were performed and the
mean value is reported. Generally, the deviations from the mean
value were less than 1%. For the surfactant solution with molality
m, the osmotic coefficient was obtained according to
= NaClmNaCl NaCl
m
(1)
where mNaCl is the molality of a NaCl solution showing the same
osmometer reading as the C10MeImCl or C10MeImCl–NaCMC solu-
tion, which means an equality of the vapor pressures in both
solutions. The stoichiometric numbers and NaCl in Eq. (1) are
set equal to 2. NaCl is the respective osmotic coefficient of NaCl
solution at mNaCl and has been calculated as:
The osmotic coefficients of NaCl solutions as a function of
molality at the experimental temperatures were obtained from
the literature (Clarke & Glew, 1985) in the concentration range
of 0.001–1.5 mol kg−1. These were then fitted to the Pitzer ion-
interaction equation (Pitzer & Mayorga, 1973) for the osmotic
coefficient of an electrolyte MX:
= 1 − |zMzX |A
√
I
1 + 1.2
√
I
+ m
2 M X
ˇ
(0)
MX
+ ˇ
(1)
MX
e−2
√
I
+ m
2( M X )3/2
CMX
(2)
where and M and M are the numbers of ions in the formula and
zM and zX give their respective charges in electronic units; also
= M + X, also m is the molality, I the ionic strength and A the
Debye–Hückel coefficient for the osmotic function (Archer & Wang,
1990). The Pitzer parameters, ˇ
(0)
MX
, ˇ
(0)
MX
, and C
( )
MX
, obtained by the
method of least-squares fit of the NaClvs. mNaCl data (Clarke & Glew,
1985) to Eq. (2) along with the literature A values at the experi-
mental temperatures are listed in Table 1. These parameters have
been used for the calculation of osmotic coefficients of NaCl (aq)
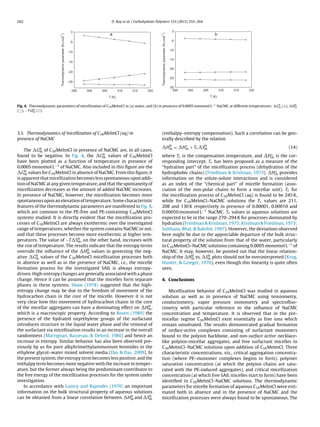
solutions. The m vs. m profiles for C10MeImCl (aq) solutions in the
absence and in presence of NaCMC at 313.15 K are shown in the
representative Fig. 2.
Steady-state fluorescence measurements were carried out on a
Hitachi Model F-7000 spectrofluorimeter equipped with a 150 W
xenon lamp at the desired temperatures within 1 K using a stop-
pered cell of 1 cm path length with pyrene as the fluorescence
probe. The excitation wavelength was selected at 335 nm using a
10 nm band pass, and, while the emission spectra were scanned
from 350 to 450 nm with a band pass of 1 nm.
Table 1
Pitzer ion-interaction parameters and Debye–Hückel coefficient for the osmotic
function of Eq. (1) for NaCl (aq) solutions at 298.15, 303.15, 308.15, 313.15, and
318.15 K.
T (K) A (kg mol−1/2
) ˇ
(0)
MX
(kg mol−1
) ˇ
(1)
MX
(kg mol−1
) 104
CMX
(kg mol−1
)
298.15 0.39148 0.0764 0.274 16.70
303.15 0.39492 0.0804 0.277 9.04
308.15 0.39852 0.0838 0.280 2.36
313.15 0.40228 0.0869 0.283 −3.21
318.15 0.40620 0.0895 0.286 −8.31
Fig. 2. Osmotic coefficient ( ) multiplied by molality (m) vs. m of C10MeImCl
(aq) at 313.15 K in water ( ), and in presence of 0.00001 ( ), 0.0001 ( ), and
0.0005 monomol L−1
(᭹) of NaCMC (aq). The osmograms have been shifted vertically
by 0.05 unit from each other for clarity.
3. Results and discussion
3.1. Ion-association behavior of pure aqueous C10MeImCl in the
pre-micellar regime
Conductometric study provided important information as to the
ion-association behavior of C10MeImCl below its critical micellar
concentration (cmc) where it behaves as a 1–1 electrolyte. Such a
knowledge would help understand its aggregation behavior past
cmc.
The molar conductance ( ) vs. concentration data below cmc
have been analyzed by the Fuoss conductance equation (Fuoss,
1978a, 1978b). For any given set of values (cj, j; j = 1, . . ., n),
three adjustable parameters, namely the limiting molar conductiv-
ity ( 0), association constant (KA), and the association diameter (R)
are derived from a solution of the following set of equations:
= [1 − ˛(1 − )][ 0
(1 + RX) + EL] (3)
KA = KR(1 + KS) =
(1 − )
c 2f 2
(4)
− ln f =
e2Ä
2εkBT(1 + kR)
(5)
where RX and EL are the relaxation and hydrodynamic terms
respectively, and the other symbols have their usual significance.
The initial 0 values for the iteration procedure were obtained from
Fuoss–Shedlovsky extrapolation (Fuoss & Shedlovsky, 1949) of the
data.
Calculations were made to find out 0 and ˛ values minimizing
the standard deviation, ,
=
[ j(calcd) − j(obsd)]
2
(n − 2)
1/2
(6)
for a sequence of R values and then plotting vs. R; the best-fit R
corresponds to the minimum of the curve. However, since a rough
scan using unit increment of R values from 4 to 20 gave no signif-
icant minima in the vs. R curves, the R values were preset at the
Bjerrum length.
Table 2 lists the 0, KA, and R values along with the limiting
equivalent conductances of Cl−
( 0
Cl− ) and Na+ ions ( 0
Na+ ) at the
experimental temperatures. The 0
Cl− and 0
Na+ values at 298.15,
308.15, and 318.15 K have been taken from the literature (Robinson](https://image.slidesharecdn.com/9029c60b-0d00-4ec1-b4e8-401630ca11f5-160219062438/85/2015_CP-3-320.jpg)
![258 D. Ray et al. / Carbohydrate Polymers 125 (2015) 255–264
Table 2
Conductance parameters of C10MeImCl in the premicellar regime along with the 0
Cl− , 0
C10MeIm+ , and 0
Na+ values in water at 298.15, 303.15, 308.15, 313.15, and 318.15 K.
T (K) 0
(S cm2
equiv.−1
) KA (dm3
mol−1
) 108
R (cm) (%) 0
Cl− (S cm2
equiv.−1
) 0
C10MeIm+ (S cm2
equiv.−1
) 0
Na+ (S cm2
equiv.−1
)
298.15 98.47 6.97 7.16 0.14 76.35 22.12 50.10
303.15 109.58 3.66 7.20 0.02 84.38 25.20 55.80
308.15 119.56 3.49 7.25 0.02 92.21 27.35 61.54
313.15 128.20 3.46 7.30 0.07 100.42 27.78 67.61
318.15 137.08 3.11 7.35 0.04 108.92 28.16 73.73
& Stokes, 1959). Since the values at 303.15 and 313.15 K are not
available, these were obtained by regressing the available litera-
ture (Robinson & Stokes, 1959). 0
Cl− or 0
Na+ values as a function
of temperature. The very low KA values of C10MeImCl (aq) indicate
the existence of C10MeImCl essentially as free ions over the temper-
ature range investigated. A comparison of the 0
C10MeIm+ and 0
Na+
values reveals that the Na+ ions are approximately 2.2–2.6 times
more mobile that the C10MeIm+ ions within the investigated tem-
perature range. The 0
C10MeIm+ values are found to be greater than
the 0
C16MeIm+ values reported earlier (Das, Ray, & De, 2014), indi-
cating that the Stokes’ radius of the former is smaller than that of
the later. This demonstrated that these cations remain unsolvated
in aqueous solutions.
3.2. Aggregation processes in pure C10MeImCl and their
thermodynamics
Aggregation behavior of pure C10MeImCl (aq) was investigated
by four experimental techniques, viz., tensiometry, conductometry,
vapor pressure osmometry, and spectrofluorimetry.
Tensiometry records the threshold surfactant concentration
required to saturate the air/solution interface as the cmc, which
is obtained from a sharp break in the vs. log[surfactant] profiles
as shown in Fig. 1(a). This type of tensiometric behavior is also
reported earlier for other aqueous SAIL solutions (Garcia, Ribosa,
Perez, Manresa, & Comelles, 2014; Goodchild et al., 2007).
An inflection in the specific conductance (Ä) vs. [C10MeImCl]
isotherm corresponds to the onset of micellization in the bulk solu-
tion as shown in Fig. 1(c), the corresponding concentration being
the cmc of the surfactant.
Using the measured osmotic coefficients of C10MeImCl solutions
( ) as a function of molal concentration (m), we plotted the prod-
uct m vs. m (cf. Fig. 2). The intersection of the linear segments
below and above cmc provides a measure of the cmc of C10MeImCl
solutions.
Steady-state fluorescence measurements using pyrene as a
probe were performed to determine the cmc of C10MeImCl (aq)
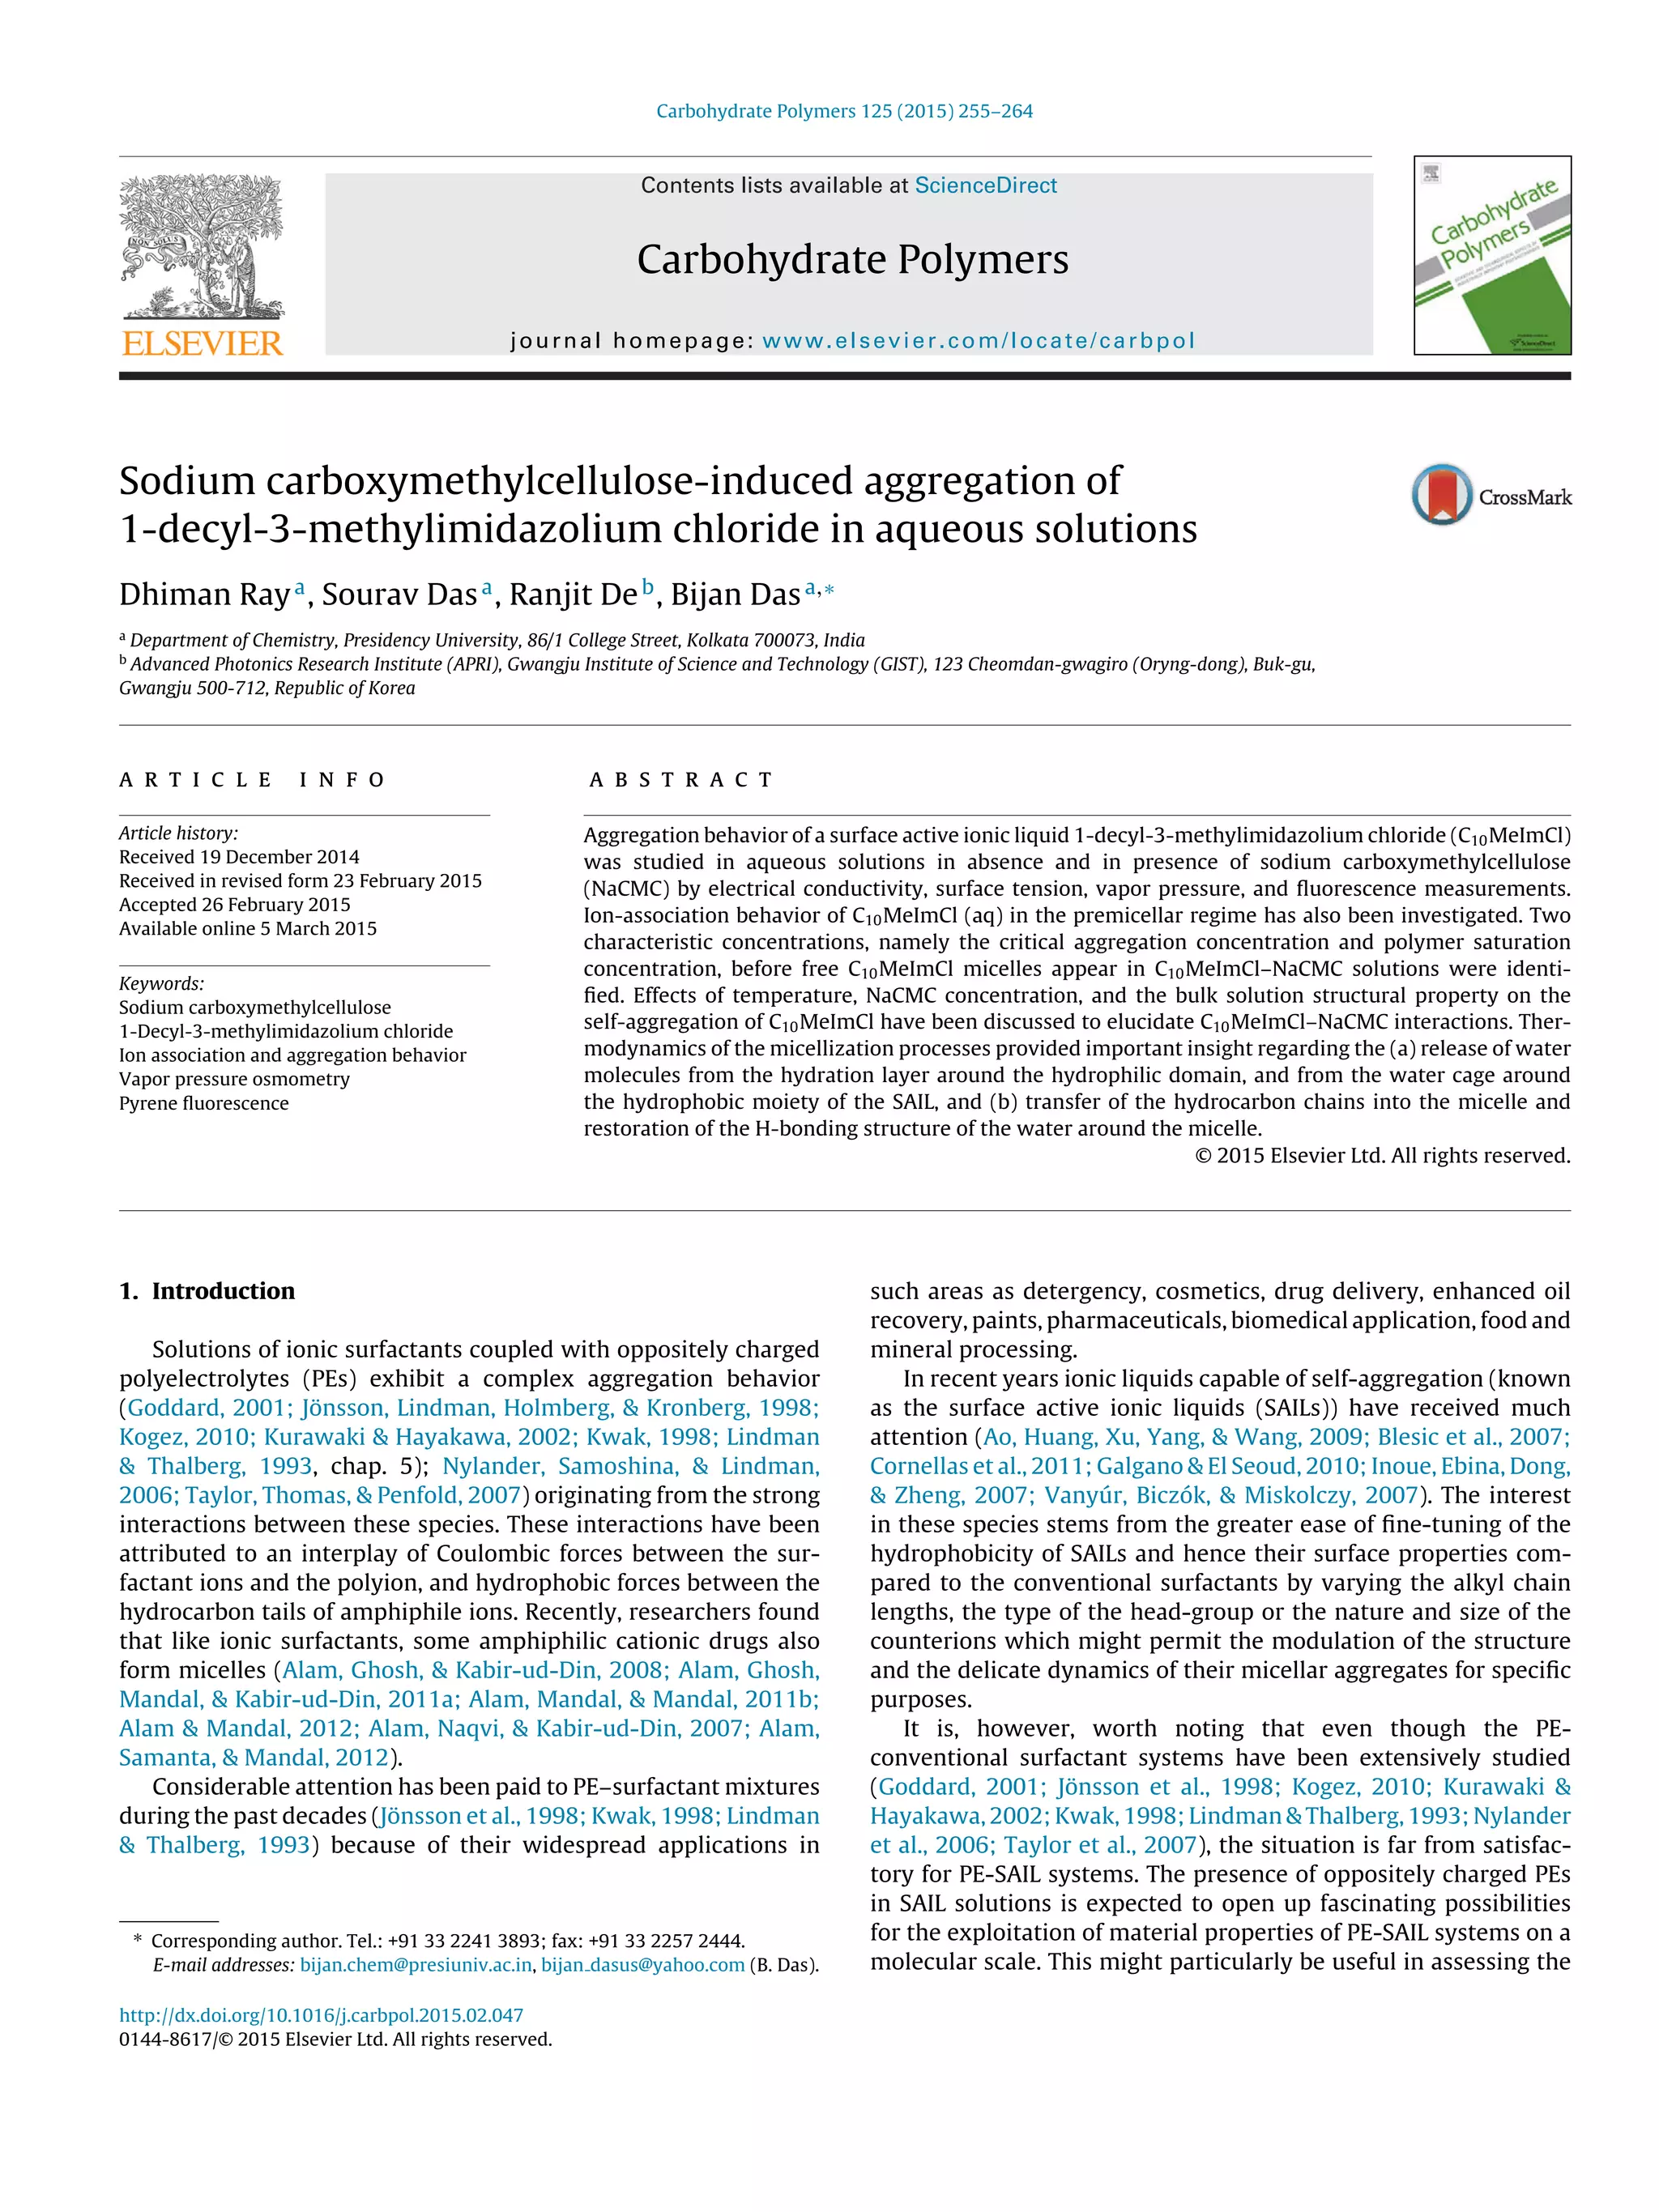
solution. Pyrene is a strongly hydrophobic probe and its fluores-
cence emission spectrum exhibits five characteristic vibronic peaks
in region 370–400 nm (Fig. 3(a)). The first and the third vibronic
peaks of pyrene appear at 375 and 385 nm, respectively. The ratio
of the intensity of the first vibronic peak to that of the third (I1/I3) is
highly sensitive to the polarity of the environment. A representative
plot (Fig. 3(b)) displays the variation of the ratio of the intensities
of the first to third peaks (I1/I3) as a function of log[C10MeImCl]
in NaCMC-free and in NaCMC-containing solutions at 308.15 K.
The abrupt sigmoidal decrease in I1/I3 with increasing surfac-
tant concentration indicates the formation of surfactant aggregates
and preferential incorporation of the probe into the hydrophobic
microenvironment of the aggregates relative to water. The cmc can
be taken as the concentration corresponding to the intersection of
the rapidly varying portion of the curve and the relatively steady
portion at higher concentration.
The cmc values of C10MeImCl in aqueous solutions at differ-
ent temperatures obtained using these four different experimental
Table 3
Critical micellar concentrations (cmc) and related thermodynamic parameters
for pure C10MeImCl in aqueous solutions at 298.15, 303.15, 308.15, 313.15, and
318.15 K.
T (K) 298.15 303.15 308.15 313.15 318.15
cmc (mM)
Tensiometry 49.19 49.89 50.02 51.20 52.73
Conductometry 58.03 58.87 59.03 60.85 61.25
Fluorimetry 57.09 – 58.05 – –
Osmometry 54.27 55.69 56.06 57.87 58.89
Average 54.65 54.82 55.79 56.64 57.62
cmc (mN m−1
) 34.81 34.28 33.96 33.68 33.22
max × 106
(mol m−2
) 2.01 1.78 1.72 1.48 1.42
Amin × 1018
(m2
) 0.826 0.933 0.965 1.122 1.169
ˇ 0.52 0.51 0.50 0.48 0.47
G0
m (kJ mol−1
) −26.12 −26.27 −26.41 −26.39 −26.59
H0
m (kJ mol−1
) −1.70 −2.64 −3.62 −4.61 −5.69
T S0
m (kJ mol−1
) 24.41 23.64 22.80 21.78 20.91
methods are listed in Table 3 and there is a very good agreement
among these values. It is observed that the cmc of pure C10MeImCl
increases with increasing temperature within the investigated
temperature interval.
The values upon complete air/solution interfacial saturation
( cmc) of pure C10MeImCl are also listed in Table 3; cmc values are
found to decrease slightly with temperature elevation.
The values of Gibbs surface excess ( max), which provide a mea-
sure of the efficacy of adsorption of C10MeImCl molecules at the
interface as compared to the bulk phase, were calculated using the
following equation (Rosen, 1989):
max = −
1
nRT
Lt
[C10MeImCl]≈cmc
∂
∂ ln[C10MeImCl] T,p
(7)
where n is the number of species per surfactant monomer in solu-
tion, R the gas constant, and T the absolute temperature. The max
values thus obtained are reported in Table 3. A decrease in the max
values with the rise in the temperature manifests an enhancement
of the efficacy of the surfactant monomers to populate the inter-
face at lower temperatures. A comparison of the max values of
C10MeImCl solutions with those of C16MeImCl solutions reported
earlier (Das et al., 2014), demonstrates a greater efficiency of accu-
mulation of the interface for the later case.
The area of exclusion per surfactant monomer was calculated
assuming complete monolayer formation at cmc using the follow-
ing equation:
Amin =
1018
NA max
(8)
in m2 molecule−1, where NA is the Avogadro’s number. The values
of Amin are also listed in Table 3. The increase in the Amin values
with temperature may be ascribed to the greater kinetic motion
of the monomers populating the air/water interface. The Amin val-
ues for aqueous C10MeImCl are always found to be greater than
the corresponding literature values (Das et al., 2014), for aque-
ous C16MeImCl. This observation supports our earlier conclusion
concerning the unsolvation of the SAIL cations reached from con-
ductivity study. From Table 3 it may be noticed that the values of](https://image.slidesharecdn.com/9029c60b-0d00-4ec1-b4e8-401630ca11f5-160219062438/85/2015_CP-4-320.jpg)
![D. Ray et al. / Carbohydrate Polymers 125 (2015) 255–264 259
a b
Fig. 3. Representative (a) pyrene fluorescence emission spectra in C10MeImCl (aq) solution at concentrations 0.0050, 0.0120, 0.0520, 0.0540, 0.0592, 0.0620, 0.0690 and
0.0750 mol L−1
(bottom to top) in presence of 0.00001 monomol L−1
NaCMC at 298.15 K. Excitation wavelength: 335 nm. The spectrum at cmc (0.0592 mol L−1
) is indicated,
and (b) I1/I3 ratio of pyrene vs. log[C10MeImCl] in aqueous solution ( ) and in 0.00001 ( ) and 0.0001 monomol L−1
( ) NaCMC (aq) at 308.15 K.
max decrease and those of Amin increase, when the temperature
of the system increases. It shows that the higher the temperature
is, the weaker is the tendency of those molecules to escape from
the solvent to the air/solvent, resulting in a less packed surface at
elevated temperatures.
The degree of counterion binding (ˇ) onto the self-aggregated
assemblies was obtained from the slopes of the Ä vs. [C10MeImCl]
isotherm in the premicellar region (S1) and the postmicellar region
(S2) using the following relationship:
ˇ = 1 −
S2
S1
(9)
The ˇ values, recorded in Table 3, decreased slightly with tem-
perature.
Free energy change of the micellization process ( G0
m) was cal-
culated using the equation:
G0
m = (1 + ˇ)RT ln xcmc (10)
where xcmc is the cmc of C10MeImCl in mole fraction scale. The
ˇ factor includes the fraction of free energy required to con-
dense the counterions on the aggregate to reduce the repulsion
between the adjacent monomer head groups (Gunnarsson, Jönsson,
& Wennerström, 1980).
The corresponding standard enthalpy change ( H0
m) is given by
H0
m = −RT2
(1 + ˇ)
∂ ln xcmc
∂T p
− ln xcmc
∂ˇ
∂T p
(11)
Since the temperature derivative of ˇ for aqueous C10MeImCl
is found to be small over the temperature range investigated here,
and Eq. (11) can then be simplified to
H0
m = −(1 + ˇ)RT2 ∂ ln xcmc
∂T p
(12)
The standard entropy of micellization ( S0
m) was calculated
from:
G0
m = H0
m − T S0
m (13)
The G0
m, H0
m and T S0
m, values for aqueous solutions of
C10MeImCl are listed in Table 3.
A reduction in the H0
m values on increasing temperature
implies the less enthalpy-controlled system at elevated temper-
atures.
The G0
m values are found to be negative over the entire range of
the temperatures studied for aqueous C10MeImCl. This observation
indicates that the process of micellization of C10MeImCl in aque-
ous solution is spontaneous. A comparison of the G0
m values of
aqueous C10MeImCl with those of aqueous C16MeImCl reveals that
the process of micellization is more spontaneous in the later case
(Das et al., 2014). The H0
m and T S0
m values contribute oppositely
to G0
m, so the value of G0
m is dependent on relative changes of
enthalpy and entropy in the system. It is seen that the variations
of enthalpy and entropy of micellization nearly compensate each
other, and hence G0
m is found to be only slightly dependent on
temperature.
The S0
m values are positive over the whole temperature range
of measurement and decrease with the rise of temperature. The
positive entropy values indicate that the process of micellization of
pure aqueous SAIL is entropically driven. Entropy of micellization
– the principal driving force toward micelle formation – is initiated
by the highly ordered arrangement of the water molecules around
the hydrophobic domain of the ionic liquid. The contributing fac-
tors to T S0
m, are (a) release of a substantial fraction of the water
molecules “frozen” around the hydrophobic surfactant chains, (b)
readjustment of the head-group in response to the charge den-
sity on the micellar surface caused by monomer association and
counterion binding, (c) increase in the degrees of freedom of the
surfactant molecules in the micelle, and (d) decrease in the degrees
of freedom of the head-groups at the interface. The present results
indicate an increase in the degrees of freedom of the system. With
the increase in temperature, there is an attenuation in the contri-
bution of entropy of micellization, because at higher temperatures
water molecules around the hydrophobic core of the molecules
become less organized.
Chiefly, three factors contribute to the value of H0
m. These
include (a) a positive contribution associated with the release of
structural water molecules from the hydration layer around the
hydrophilic domain, (b) an additional positive contribution arising
from the release of water molecules from the water cage around
the hydrophobic moiety of the SAIL, and (c) a negative contribu-
tion associated with the transfer of the hydrocarbon chains into
the micelle and restoration of the H-bonding structure of the water
around the micelle. With increasing temperature the degree of
H-bonding around the SAIL molecules decreases, and therefore
the energy required to break it also diminishes. The experimen-
tal values indicate that the negative contribution predominates in
aqueous solutions of C10MeImCl over the investigated range of tem-
perature, i.e., micellization of C10MeImCl in the aqueous solution is
exothermic.
Table 3 reveals that while the H0
m value is negative and
becomes more negative as temperature increases, the T S0
m val-
ues are, in general, positive and becomes less positive with
increasing temperature. It is, thus, obvious, that the micelli-
zation of C10MeImCl in aqueous solution is governed by the
entropy–enthalpy compensation effect, and that it is driven by the](https://image.slidesharecdn.com/9029c60b-0d00-4ec1-b4e8-401630ca11f5-160219062438/85/2015_CP-5-320.jpg)
![260 D. Ray et al. / Carbohydrate Polymers 125 (2015) 255–264
positive entropy. Similar behavior has also been observed previ-
ously by us for pure alkyltrimethylammonium bromides in the
ethylene glycol-water mixed solvent media (Das & Das, 2009).
3.3. Influence of NaCMC on the aggregation behavior of
C10MeImCl (aq)
NaCMC(aq) has been shown to be surface inactive below 7 g L−1
(Guillot, Delsanti, Desert, & Langevin, 2003). The maximum con-
centration of NaCMC employed in this study (ca. 0.16 g L−1) was
much lower than the critical concentration above which NaCMC
becomes surface active. Hence, surface activity of NaCMC has
nothing to do with the observed complexity in the tensiograms
of C10MeImCl–NaCMC systems. Moreover, at such low NaCMC
concentrations, complexity arising out of the polyion–polyion
interactions was also considered to be absent.
The presence of NaCMC in C10MeImCl solutions greatly modi-
fies the tensiometric behavior of the surfactant in solution. Typical
surface tension profiles for the present C10MeImCl–NaCMC sys-
tem as surfactant concentration varies are complex in nature, as
shown in the representative tensiogram, Fig. 1(b), in presence of
0.0005 monomol L−1 NaCMC, and clearly show the existence of a
hump in the profile. In all cases, there is a marked lowering of
surface tension at lower surfactant concentrations when NaCMC
is initially introduced compared to the NaCMC-free case. It appears
that adsorption of NaCMC–surfactant complexes occurs at surfac-
tant concentrations well below the concentration at which the
surfactant molecules on their own are expected to adsorb apprecia-
bly. The NaCMC–surfactant complexes are formed by cooperative
binding of surfactant monomers onto the NaCMC backbone due to
strong electrostatic forces of attraction among themselves. Because
of the adsorption of the monomers on the polyions, the hydropho-
bicity of the complexes increases, and the complexes occupy the
Langmuirian interface. The initial decrease in the surface tension
may, therefore, be attributed to the gradual formation of a surface-
active complex consisting of surfactant monomers bound to the
polyion backbone. The mimima in the tensiograms indicate the
characteristic concentration (critical aggregation concentration,
cac) beyond which are formed the non-surface active PE-micellar
aggregates where the surfactant molecules cooperatively adsorb on
the polyion strand in the form of micelles to form a necklace-like
structure. The formation of these complexes dislodges the surface-
active PE–surfactant monomer complex to sink into the bulk from
the interface; consequently the interface was stripped off the sur-
face active species with an increase in the surface tension until
the formation of the necklace-like structures was complete. Upon
completion of this process, there is monomer build-up at the inter-
face with further increase in the concentration of C10MeImCl. This
is associated with a decline in surface tension until free micelles
started to form at a surfactant concentration referred to as the
apparent critical micellar concentration (cmc*) after which surface
tension increases again. The maximum in a tensiogram repre-
sents the concentration at which the polyion chains are saturated
with the PE-induced aggregates and is referred to as the poly-
mer saturation concentration (psc). Similar tensiometric behavior
of surfactants in presence surfactants was also observed by other
groups (Dan, Ghosh, & Moulik, 2012; Prasad, Palepu, & Moulik,
2006; Singh, Boral, Bohidar, & Kumar, 2010). The values of cac, psc,
and cmc* values obtained from tensiometry are recorded in Table 4.
The polymer shrinkage as observed from the drop in the viscosity
value is very extensive above cac, and the viscosity of the solu-
tion reaches a plateau close to psc (reduced viscosity is found to
plunge by a factor of ca. 0.33 from its value at cac) indicating a sat-
uration of chain coiling. Appreciable coiling of the macromolecular
chains in presence of conventional surfactants beyond cac probed
by viscosity has also been reported earlier (Kogez & Skerjanc, 1999a,
1999b).
The conductometric profiles for C10MeImCl (aq) in presence
of 0.0005 monomol L−1 NaCMC as a function of C10MeImCl con-
centration are depicted in Fig. 1(d). The curves show a sharp
change in slope at the critical micellization concentration of
C10MeImCl in presence of NaCMC (cmc*). The values of psc have
also been identified although the inflections are not as sharp
as those for cmc*. The conductometric psc and cmc* values are
listed in Table 4. It may be pointed out here that conductiv-
ity isotherms manifesting two linear sections with one inflection
have also been reported earlier in aqueous alkyltrimethylam-
monium bromide–NaPSS (Kogez & Skerjanc, 1999a, 1999b) and
in dodecylpyridinium chloride–sodium dextran sulfate systems
(Anghel et al., 2007) and those with higher-complexity show-
ing up four linear sections with three inflections (e.g., in aqueous
cetyltrimethylammonium bromide–NaCMC solution (Chakraborty,
Chakraborty, & Ghosh, 2006) are also available in the literature.
It may, however, be noted that for aqueous cetyltrimethylammo-
nium bromide–NaCMC solution, where three-break conductivity
isotherm was reported, the slopes of the straight lines before and
after the psc differ negligibly from each other. The cac could, how-
ever, not be detected by this experimental method. The lower
complexity in the conductivity profiles of the C10MeImCl–NaCMC
(aq) system observed here may be attributed to the predominance
of the electrostatic interactions over the hydrophobic effect in pres-
ence of the highly charged polyions.
Although osmotic coefficient data on pure surfactants are avail-
able (Attwood, Dickinson, Mosquera, & Villar, 1987; Ballesteros,
Coronel, & Galera-Gomez, 1999; Dearden & Wooley, 1987; Ruso
et al., 1999; Widera, Neuder, & Kunz, 2003), those on PE-SAIL solu-
tions have, to the best of our knowledge, not been reported so
far. Here, we have employed vapor pressure osmometry to under-
stand the interactions prevailing in C10MeImCl–NaCMC solutions.
The product of the C10MeImCl molality (m) and the measured
osmotic coefficient of C10MeImCl–NaCMC solutions ( ) for a given
NaCMC concentration when plotted against m manifest three lin-
ear segments with two intersections. The first intersection has been
identified as the psc and the second as the cmc*. The representative
profile (Fig. 3) displays the variation of m vs. m for a selected sys-
tem. Like conductivity study, here also the cac could not be detected.
The variation of I1/I3 was measured for aqueous solutions
containing fixed concentrations of the PE and variable concen-
trations of C10MeImCl. The results of C10MeImCl–NaCMC system
are shown in Fig. 3(b). It is interesting to note that the medium
polarity decreases with increasing amount of the added NaCMC to
C10MeImCl solutions. This may be ascribed to greater condensation
of counter and surfactant ions onto the polyion backbone.
Ideally the I1/I3 vs. [surfactant] profiles of PE–surfactant
systems should give rise to three regions where I1/I3 values
are almost independent of the surfactant concentration with
two breaks (Turro, Baretz, & Kuo, 1984). The first inflection
corresponds to the formation of minimicelles bound to the poly-
mer chains and hence gives a measure of the cac, whereas
the second to the formation free surfactant micelles and pro-
vides a measure of the cmc*. These three regions are not
always detectable through fluorescence study (Turro et al., 1984).
Sodium dodecylsulfate–poly(N-vinylpyrrolidone) system reveals
three regions very nicely although the later break is not sharp
at higher polymer concentrations (Turro et al., 1984). Sodium
dodecylsulfate–poly(ethylene oxide), on the other hand, shows
only one sharp break when the concentration of the polymer
employed was very small (Turro et al., 1984). In the present study,
only one very sharp break has been identified, and hence only the
cmc* values could be determined. The cac and psc could, however,
not be detected by fluorescence studies.](https://image.slidesharecdn.com/9029c60b-0d00-4ec1-b4e8-401630ca11f5-160219062438/85/2015_CP-6-320.jpg)