This document reports on a study investigating the influence of sodium carboxymethylcellulose (NaCMC) on the aggregation behavior of aqueous solutions of 1-hexadecyl-3-methylimidazolium chloride (C16MeImCl), a cationic surface active ionic liquid (SAIL). Electrical conductivity and surface tension measurements were used to study C16MeImCl aggregation in the presence of NaCMC. Two characteristic concentrations were identified before free C16MeImCl micelles form: the critical aggregation concentration and the polymer saturation concentration. The effects of temperature, NaCMC concentration, and NaCMC charge density on C16MeImCl self-aggregation were analyzed. Thermodynamic parameters of C16MeImCl mic

![B. Das et al. / Carbohydrate Polymers 113 (2014) 208–216 209
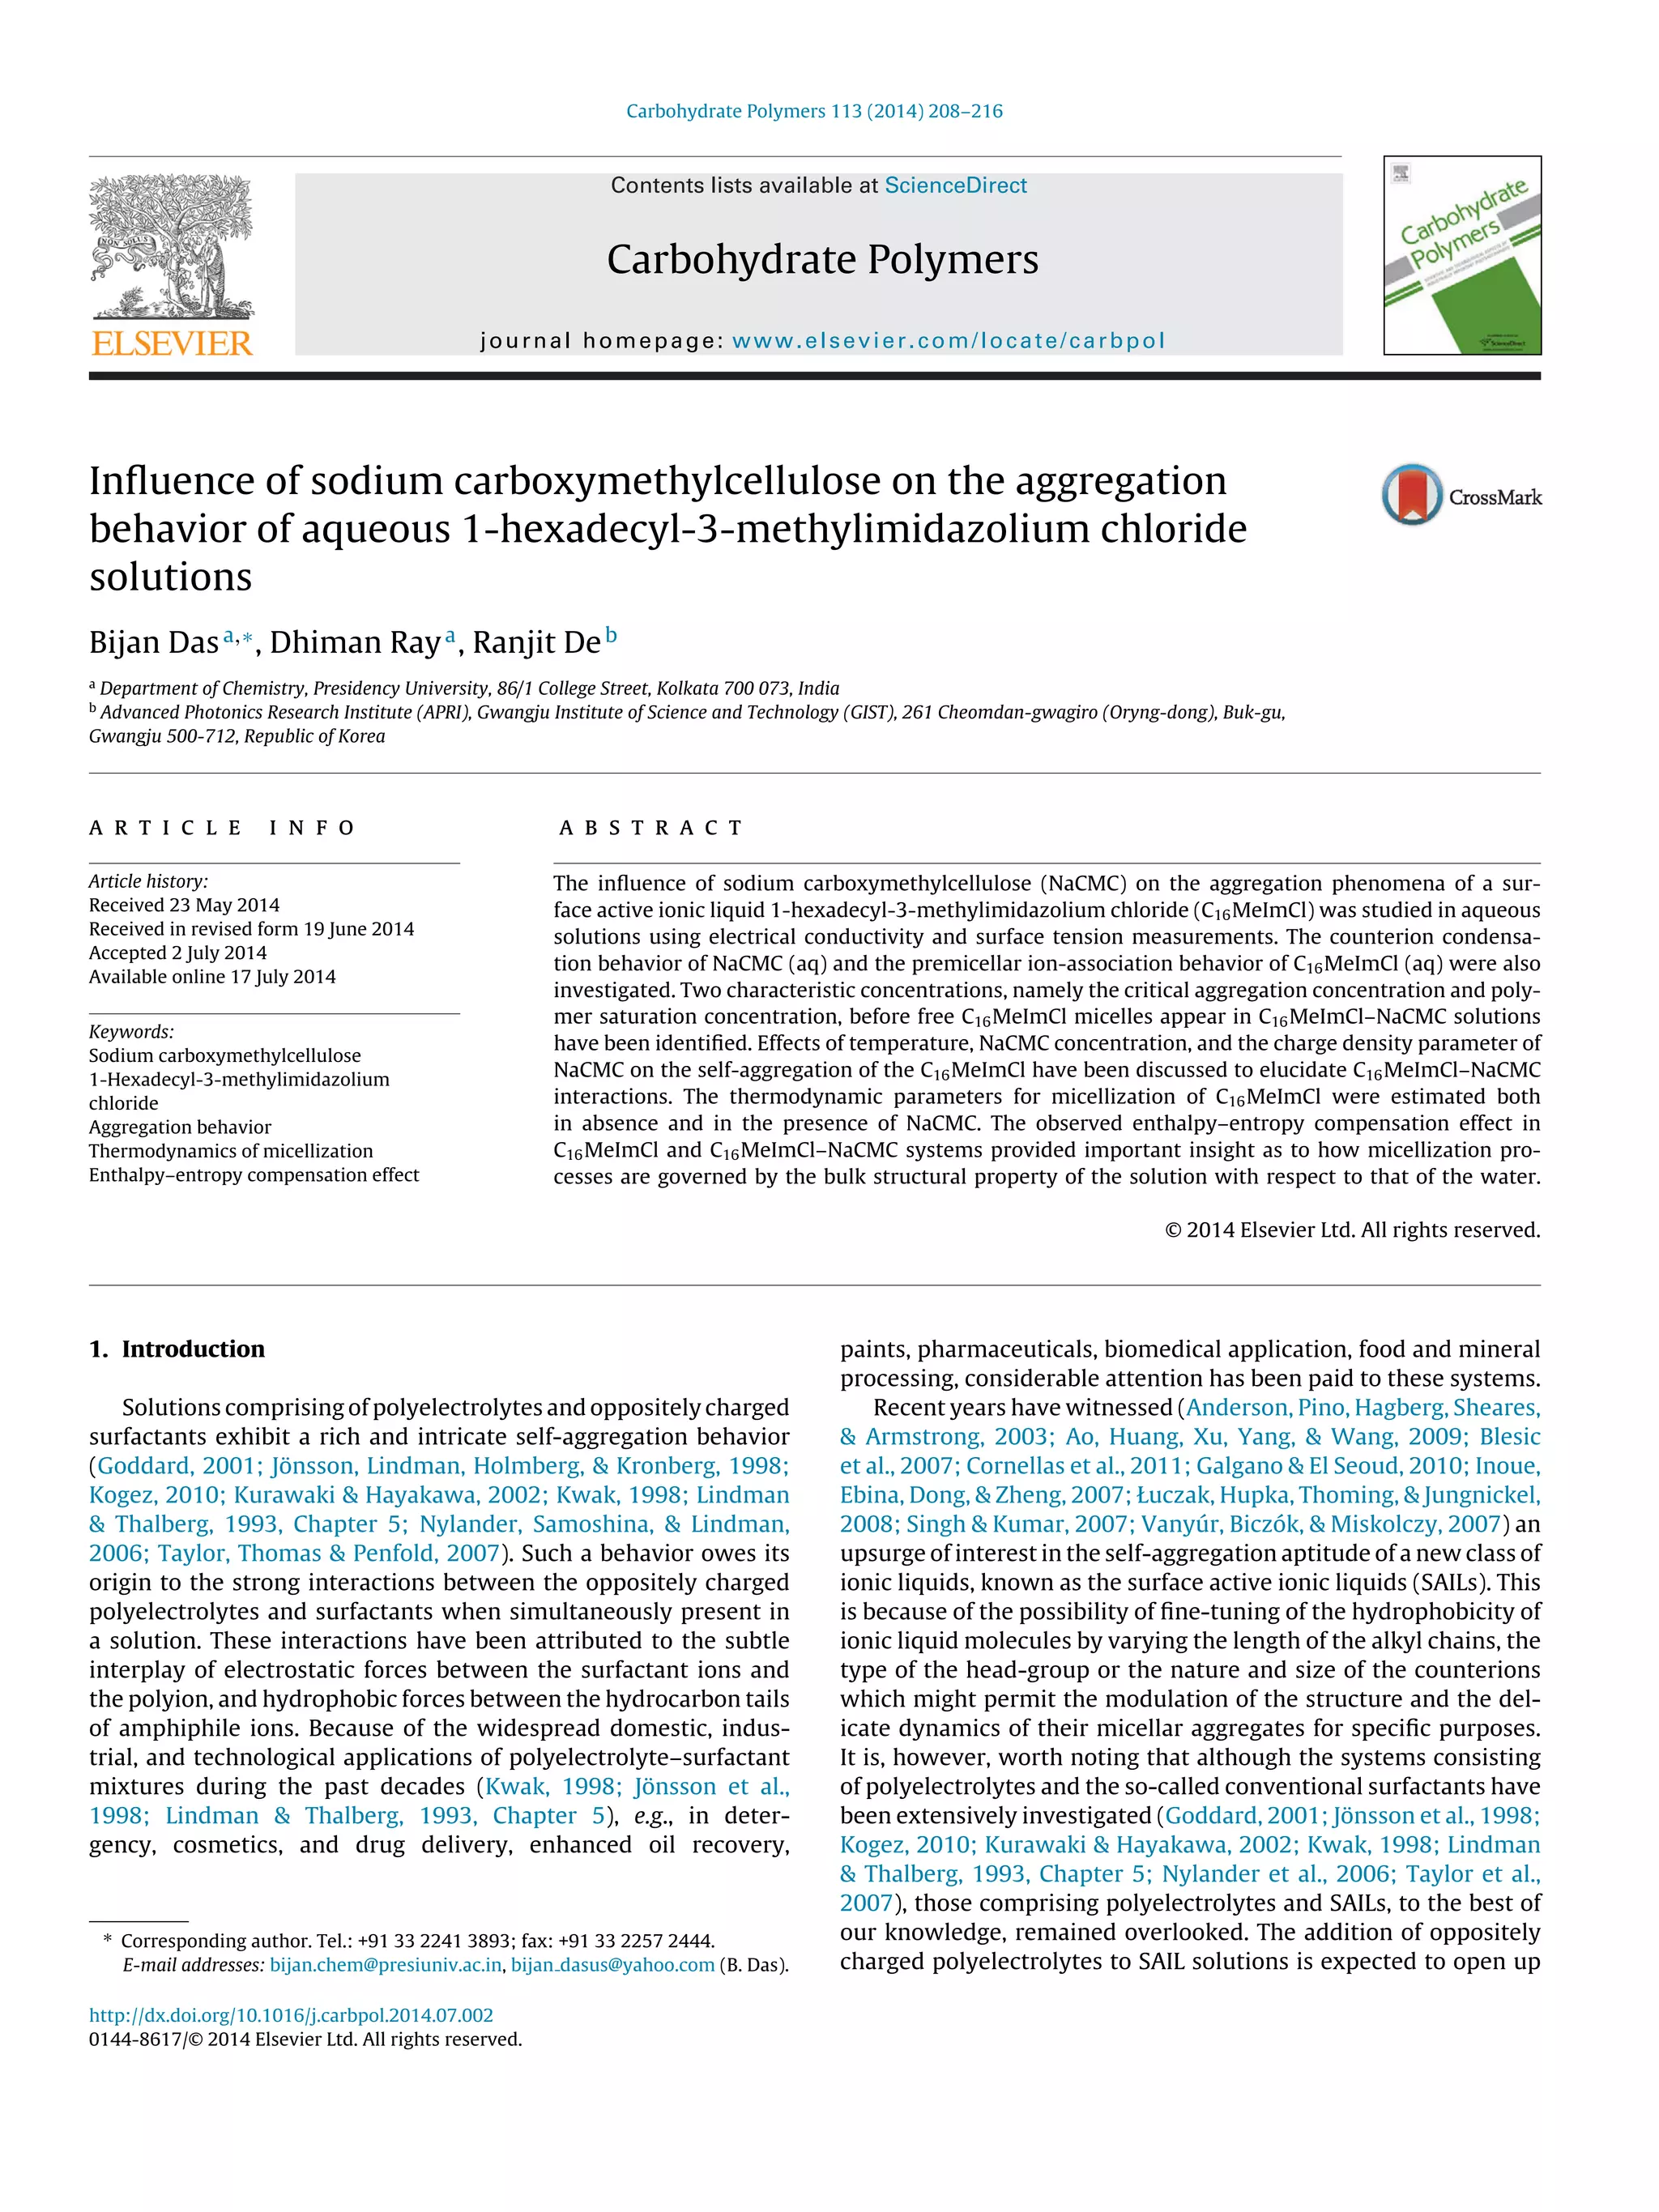
Fig. 1. (a) Chemical structure and the XRD pattern of NaCMC, and (b) Chemical structure and the XRD pattern of C16MeImCl.
fascinating possibilities in the manipulation of material properties
of PE–SAIL systems on a molecular scale. This might be particularly
useful in assessing the possible role of PEs in modulating the known
antimicrobial activity of SAILs (Łuczak, Jungnickel, Łacka, Stolte, &
Hupka, 2010).
In this communication, we present a comprehensive micel-
lar and thermodynamic study on the interaction between an
anionic polyelectrolyte sodium carboxymethylcellulose (NaCMC)
and a cationic SAIL 1-hexadecyl-3-methylimidazolium chloride
(C16MeImCl) in aqueous media as a function of temperature as
well as in presence of varying concentrations of NaCMC as probed
by tensiometry and conductometry. The counterion condensa-
tion behavior of aqueous NaCMC in absence of C16MeImCl, and
the electrolyte and micellar behavior of C16MeImCl in absence
of NaCMC will also be investigated to unravel the nature of
C16MeImCl–NaCMC interactions. Although the surface and micel-
lar behavior in conventional cationic surfactant–NaCMC systems is
now well understood (Chakraborty, Chakraborty, & Ghosh, 2006;
Guillot, Delsanti, Desert, & Langevin, 2003; Jain et al., 2004), that of
C16MeImCl–NaCMC system has not been investigated yet. Because
of the greater ease of fine-tuning of the hydrophobicity of SAIL
molecules compared to their conventional counterparts, the inter-
actions in SAIL–NaCMC systems could be modulated conveniently
in comparison with the conventional surfactant–NaCMC systems.
NaCMC is a chemically modified cellulose derivative with large
water solubility, broadly used due to its low cost, lack of toxicity,
and biodegradability. Food industry, cosmetics, pharmaceuticals,
suspension agents, formulation agents in controlled release of
drugs and pesticides, papers and paper products, adhesives, and
ceramics provide a brief list of the numerous areas where car-
boxymethylcellulose is used in the acid or in the sodium salt form
(Just & Majewicz, 1985). It would, therefore, be interesting to study
its interacting features with a SAIL.
2. Experimental
NaCMC was purchased from Aldrich Chemicals. The average
molecular weight of the sample was 90,000 with a degree of
substitution of 0.7. These values agree well with those obtained
from physicochemical characterization in the present study.
Fig. 1(a) presents the structure of the NaCMC sample used in this
study. The NaCMC X-ray diffraction (XRD) pattern, also shown
in this figure, displays a broad peak at 20◦ associated with low
crystallinity of NaCMC structure that has been previously observed
(Shang, Shao, & Chen, 2008). C16MeImCl, was purchased from Acros
Organics and was used without further purification. Its purity was
checked from tensiometric measurements as a function of con-
centration, and no minimum (Blesic et al., 2007) was observed
within the concentration range used in this work. The structure
of C16MeImCl is shown in Fig. 1(b). Also included in this figure
is the XRD pattern of this sample. The diffractogram is similar to
that of another ionic liquid sample 1-butyl-3-methylimidazolium
chloride reported earlier (Kadokawa, Murakami, Takegawa, &
Kaneko, 2009) which also shows broad and small diffraction peaks.
Triply distilled water with a specific conductance of less than
10−6 S cm−1 at 298.15 K was used for the preparation of solutions.
XRD measurements were carried out on a computer-controlled
Rikagu diffractometer with a copper K␣ radiation ( = 0.15406 nm)
which was run at 40 kV and 40 mA.
The specific conductances (Ä) were measured on a Thermo
Scientific conductivity meter with a dip-type cell in a water
thermostat maintained within 0.01 K of the desired temperature.
Corrections were made for the specific conductance of solvents
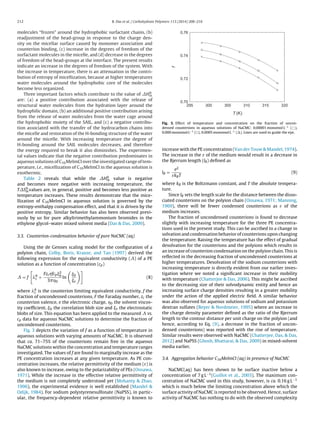
at all temperatures. The Ä vs. [C16MeImCl] profile for NaCMC-free
solution and that for a representative NaCMC-containing (concen-
tration = 0.0005 monomol L−1) solution are depicted, respectively,
in Fig. 2(a) and (b).
The surface tensions of the solutions ( ) were measured with
a Krüss (Germany) K9 tensiometer by the platinum ring detach-
ment method (uncertainty = ±1 × 10⁻³ N m−1). The tensiometer
was connected to a water-flow cryostat in order to maintain the
temperature equilibration. Prior to each measurement, the ring
was briefly heated by holding it above a Bunsen burner until glow-
ing. The vs. [C16MeImCl] profiles for PE-free solution and those
for a PE-containing (NaCMC concentration = 0.0001 monomol L−1)
solution are shown, respectively, in Fig. 2(c) and (d).](https://image.slidesharecdn.com/7b0e8344-1860-42fb-9690-bffdbcbc0345-160219062224/85/2014_CP-2-320.jpg)
![210 B. Das et al. / Carbohydrate Polymers 113 (2014) 208–216
40
80
120
160
10
-6
10
-5
10
-4
10
-3
10
-2
[C16
MeImCl] (mol L
-1
)
γ(mNm
-1
)
40
60
80
100
120
0.00001 0.0001 0.001 0.01
[C16
MeImCl] (mol L
-1
)
γ(mNm
-1
)
0
50
100
150
200
250
0 0.0005 0.0010 0.0015 0.0020 0.0025
[C16
MeImCl] (mol L
-1
)
κ(μScm
-1
)
0
50
100
150
200
0 0.0005 0.0010 0.0015 0.0020
[C16
MeImCl] (mol L
-1
)
κ(μScm
-1
)
a b
c d
Fig. 2. (a) Specific conductance (Ä) vs. [C16MeImCl] profiles for C16MeImCl in water, (b) specific conductance (Ä) versus [C16MeImCl] profiles for C16MeImCl in presence of
0.0005 monomol L−1
of aqueous NaCMC, (c) Surface tension ( ) versus [C16MeImCl] profiles for C16MeImCl in water, and (d) surface tension ( ) versus [C16MeImCl] profiles
for C16MeImCl in presence of 0.0001 monomol L−1
NaCMC. Symbols: 298.15 K ( ), 303.15 K ( ), 308.15 K ( ), 313.15 K (᭹), and 318.15 ( ). The tensiometric isotherms have
been offset vertically by 20 mN m−1
for clarity.
3. Results and discussion
3.1. Ion-association behavior of pure C16MeImCl (aq) in the
pre-micellar regime
Conductometry provided important information on the ion-
association behavior of C16MeImCl below its critical micellar
concentration (cmc) where it behaves as a 1–1 electrolyte. Such
an knowledge would help understand its aggregation properties
beyond cmc.
The molar conductance vs. concentration data below cmc have
been analyzed by the Fuoss conductance-concentration equation
(Fuoss, 1978) to derive the limiting molar conductivity ( 0), asso-
ciation constant (KA), and the association diameter (R). Table 1 lists
the 0, KA, and R values along with the limiting equivalent conduc-
tances of Cl− 0
Cl− and Na+ ions 0
Na+ at the experimental tem-
peratures. The 0
Cl− and 0
Na+ values at 298.15, 308.15, and 318.15 K
have been taken from the literature (Robinson & Stokes, 1959).
Since the values at 303.15 and 313.15 K are not available, these
were obtained by regressing the available literature (Robinson &
Stokes, 1959) 0
Cl− or 0
Na+ values as a function of temperature. The
low KA values of aqueous C16MeImCl indicates that a preponderant
proportion of C16MeImCl remains as free ions over the temperature
range investigated. A comparison of the 0
C16MeIm+ and 0
Na+ values
reveals that the Na+ ions are approximately 2.7–2.8 times more
mobile that the C16MeIm+ ions within the investigated tempera-
ture range. It may, however, be pointed out that the 0
C16MeIm+ value
at 298.15 K was also reported earlier by Vanyúr et al. (2007). But,
their value (32 S cm2 mol−1) does not at all agree with that obtained
here. As a check, we computed the 0
C16MeIm+ value by subtracting
the literature value (Robinson & Stokes, 1959) of 0
Br− from the 0
of C16MeImBr in water at 298.15 K obtained as the intercept of the
vs.
√
cdata of aqueous C16MeImBr reported by Inoue et al. (2007).
The agreement of this computed value (ca. 16 S cm2 mol−1) with
that obtained in the present work is very good.
3.2. Aggregation behavior of pure C16MeImCl and its
thermodynamics
3.2.1. Tensiometry
Tensiometry records the threshold surfactant concentration
required to saturate the air/solution interface as the cmc which is
obtained from a sharp break in the versus [surfactant] profiles (cf.
Fig. 2(c)). The cmc values of C16MeImCl in aqueous solutions at dif-
ferent temperatures are listed in Table 2. It is observed that the cmc
of pure C16MeImCl increases with increasing temperature within
the investigated temperature interval. The values upon complete
air/solution interfacial saturation ( cmc) of pure C16MeImCl are also
listed in Table 2; cmc values are found to decrease slightly with
temperature elevation.](https://image.slidesharecdn.com/7b0e8344-1860-42fb-9690-bffdbcbc0345-160219062224/85/2014_CP-3-320.jpg)
![B. Das et al. / Carbohydrate Polymers 113 (2014) 208–216 211
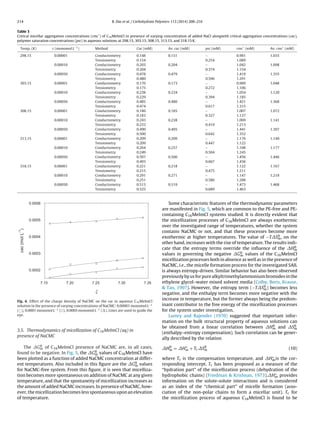
Table 1
Conductance parameters of C16MeImCl in the premicellar regime along with the 0
Cl− , 0
C16MeIm+ , and 0
Na+ values in water at 298.15, 303.15, 308.15, 313.15, and 318.15 K.
Temp. (K) 0
(S cm2
eqv−1
) KA (dm3
mol−1
) 108
R (cm) % 0
Cl− (S cm2
eqv−1
) 0
C16MeIm+ (S cm2
eqv−1
) 0
Na+ (S cm2
eqv−1
)
298.15 95.16 26.71 7.16 0.14 76.35 18.81 50.10
303.15 104.82 26.50 7.20 0.35 84.38 20.44 55.80
308.15 115.00 26.48 7.25 0.65 92.21 22.79 61.54
313.15 123.47 26.44 7.30 0.30 100.42 23.05 67.61
318.15 135.01 27.02 7.35 0.39 108.92 26.09 73.73
The values of Gibbs surface excess ( max), governing the effi-
cacy of C16MeImCl molecules to be adsorbed at the interface as
compared to the bulk phase, were calculated using the following
equation (Rosen, 1989):
max = −
1
nRT
Lt
[C16MeImCl]≈cmc
∂
∂ ln [C16MeImCl] T,p
(1)
where n is the number of species per surfactant monomer in solu-
tion, R the universal gas constant, and T the temperature in absolute
scale. The max values thus obtained are reported in Table 2. A
decrease in the max values with the rise in the temperature man-
ifests an enhancement of the efficacy of the surfactant monomers
to populate the interface at lower temperatures. The area of exclu-
sion per surfactant monomer was calculated assuming complete
monolayer formation at cmc using the following equation:
Amin =
1018
NA max
(2)
in m2 molecule−1, where NAis the Avogadro’s number. The values
of Aminare also listed in Table 2. The increase in the Amin values with
temperature may be ascribed to the greater kinetic motion of the
monomers populating the air/water interface. From Table 2 one can
notice that the values of maxdecrease and those of Aminincrease,
when the temperature of the system increases. It shows that the
higher the temperature is, the weaker is the tendency of those
molecules to escape from the solvent to the air/solvent, resulting
in a less packed surface at elevated temperatures.
3.2.2. Conductometry
A sharp break in the Ä vs. [C16MeImCl] isotherm corresponds to
the onset of micellization in the bulk solution as shown in Fig. 2(a).
Conductometric cmc values agree well with those obtained from
tensiometry (cf. Table 2). Both conductometric and tensiometric
cmcs are found to increase monotonically with temperature.
The degree of counterion binding (ˇ) onto the self-aggregated
assemblies was obtained from the slopes of the Ä versus
[C16MeImCl] isotherm in the premicellar region (S1) and the post-
micellar region (S2) using the following relationship:
ˇ = 1 −
S2
S1
(3)
The ˇ values, recorded in Table 2, decreased slightly with tem-
perature.
The free energy change of the micellization process ( G0
m) was
calculated using the equation:
G0
m = (1 + ˇ)RT ln xcmc (4)
where xcmc is the cmc of C16MeImCl in mole fraction scale. The
ˇ factor includes the fraction of free energy required to con-
dense the counterions on the aggregate to reduce the repulsion
between the adjacent monomer head groups (Gunnarsson, Jönsson,
& Wennerström, 1980).
The corresponding standard enthalpy change ( H0
m) is given by
H0
m = −RT2
(1 + ˇ)
∂ ln xcmc
∂T p
− ln xcmc
∂ˇ
∂T p
(5)
Since the temperature derivative of ˇ for aqueous C16MeImCl
is found to be small over the temperature range investigated here,
and Eq. (5) can then be simplified to
H0
m = −(1 + ˇ)RT2 ∂ ln xcmc
∂T p
(6)
The standard entropy of micellization ( S0
m) was calculated
from:
G0
m = H0
m − T S0
m (7)
The G0
m, H0
m and T S0
m values for aqueous solutions of
C16MeImCl are listed in Table 2.
The decrease in the H0
m values on increasing temperature
implies the less enthalpy–controlled system at elevated temper-
atures.
The G0
m values are found to be negative over the entire range of
the temperatures studied for aqueous C16MeImCl. This observation
indicates a spontaneous process of micelle formation of this SAIL in
aqueous solution. The H0
m and T S0
mvalues contribute oppositely
to G0
m, so the value of G0
mis dependent on relative changes of
enthalpy and entropy in the system. It is seen that the variations
of enthalpy and entropy of micellization nearly compensate each
other, and hence G0
m is only slightly dependent on temperature.
The S0
mvalues are positive over the whole temperature range
of measurement and decrease with the rise of temperature. The
positive entropy values indicate that the process of micellization of
pure aqueous SAIL is entropically driven. Entropy of micellization
– the principal driving force toward micelle formation – is initiated
by the highly ordered arrangement of the water molecules around
the hydrophobic domain of the ionic liquid. The contributing fac-
tors to T S0
m, are: (a) release of a substantial fraction of the water
Table 2
Critical micellar concentrations (cmc) and related thermodynamic parameters for pure C16MeImCl in aqueous solutions at 298.15, 303.15, 308.15, 313.15, and 318.15 K.
Temp. (K) cmc (mM) cmc
(mN m−1
)
max × 106
(mol m−2
)
Amin × 1018
(m2
)
ˇ G0
m
(kJ mol−1
)
H0
m
(kJ mol−1
)
T S0
m
(kJ mol−1
)
Surf. Cond. Av.
298.15 0.955 0.876 0.916 45.96 2.04 0.814 0.50 −40.94 −6.94 34.00
303.15 0.971 0.942 0.957 45.78 2.04 0.814 0.49 −41.16 −9.40 31.76
308.15 1.017 0.949 0.983 44.80 1.99 0.834 0.48 −41.48 −11.99 29.49
313.15 1.093 0.995 1.044 44.38 1.92 0.865 0.47 −41.60 −14.69 26.91
318.15 1.167 1.063 1.115 43.60 1.80 0.922 0.46 −41.75 −17.52 24.23](https://image.slidesharecdn.com/7b0e8344-1860-42fb-9690-bffdbcbc0345-160219062224/85/2014_CP-4-320.jpg)
![B. Das et al. / Carbohydrate Polymers 113 (2014) 208–216 213
in the tensiometric profiles of NaCMC–C16MeImCl systems. Fur-
thermore, at such low NaCMC concentrations, complexity arising
out of the polyion–polyion interactions was also considered to be
absent.
The presence of NaCMC in C16MeImCl solutions greatly modi-
fies the tensiometric behavior of the surfactant in solution. Typical
surface tension profiles for the present NaCMC–C16MeImCl sys-
tem as surfactant concentration varies are complex in nature, as
shown in the representative tensiogram, Fig. 2(d), in presence of
0.0001 monomol L−1 NaCMC, and clearly show the existence of a
hump in the profile. In all cases, there is a pronounced lowering of
surface tension at lower surfactant concentrations when the PE is
initially introduced as compared with the PE-free case. It appears
that adsorption of PE–surfactant complexes occurs at surfactant
concentrations well below the concentration at which the surfac-
tant molecules on their own are expected to adsorb appreciably.
The PE–surfactant complexes are formed by cooperative binding of
surfactant monomers onto the PE backbone due to the existence
of strong electrostatic forces among themselves. Because of the
monomeric adsorption on the PE charged sites, the hydrophobicity
of the complex increases as a whole, and the complexes populate
the Langmuirian interface. The initial drop in the surface tension
may, therefore, be attributed to the gradual formation of a surface-
active complex consisting of surfactant monomers bound to the
polyion backbone. The mimima in the profiles indicate the char-
acteristic concentration (critical aggregation concentration, cac)
beyond which a non-surface active PE–micellar aggregate where the
surfactant molecules cooperatively adsorb on the polyion backbone
in the form of micelles to form a necklace-like structure. The forma-
tion of these complexes dislodges the surface-active PE–surfactant
monomer complex to sink into the bulk from the interface; con-
sequently the interface was stripped off the surface active species
with an increase in the surface tension until the formation of the
necklace-like structures was complete. Upon completion of this
process, there is monomer build-up at the interface with further
increase in the concentration of C16MeImCl. This is associated with
a decline in surface tension until free micelles started to form
at a surfactant concentration referred to as the apparent critical
micellar concentration (cmc*) after which surface tension reaches
a final constant value close to or slightly lower than the surface
tension values attained after cmc in pure C16MeImCl systems indi-
cating minor improvement of the surface activity of C16MeImCl in
the presence of NaCMC beyond cmc. A similar behavior was also
reported earlier (Anghel, 2007; Staples et al., 2002; Taylor, Thomas,
Li & Penfold, 2003). The maximum in a tensiogram represents the
concentration at which the polyion chains are saturated with the
PE-induced aggregates which will be referred to as the polymer sat-
uration concentration (psc). The values of cac, psc, and cmc* values
obtained from tensiometry are recorded in Table 3.
The conductometric profiles for C16MeImCl (aq) in presence of
0.0005 monomol L−1 NaCMC as a function of C16MeImCl concen-
tration are shown in Fig. 2(b). Initially, there is a distinct ascending
part with a lower slope (regime I) in the Ä vs. [C16MeImCl] plot.
Analysis of the conductivity of aqueous NaCMC solutions indicated
that ca. 73–75% of the counterions would remain free at a con-
centration of 0.0005 monomol L−1 NaCMC, Fig. 2(a). The addition
of C16MeImCl, which is almost fully dissociated (cf. Table 1), to
NaCMC solution causes the C16MeIm+ ions to bind (a) to the free
polyionic sites of NaCMC, and (b) to the polyionic sites with con-
densed counterions causing further counterion dissociation. The
concentrations of free Na+ and Cl− ions in solution would thereby
increase with increasing added surfactant concentration causing
an increase in the solution conductivity. This initial ascending part
of the conductometric profile is followed by a relatively steep rise
(regime II) upon further addition of C16MeImCl. The inflection rep-
resents the critical aggregation concentration (cac) beyond which
PE-induced surfactant aggregates are formed. In regime II, smaller
surfactant micelles upon binding to the polyion chains release more
Na+ counterions as compared to regime I thus increasing the spe-
cific conductance gradient in the post-cac regime. The Na+ ions
alongwith the dissociated fraction of the Cl− ions of the PE-induced
micelles conduct electricity in this regime. After the complexa-
tion is over, build-up of the monomer concentration takes place as
indicated by a drop in the surface tension value after psc in our ten-
siometric study. But, this region of monomer-accumulation could
not be identified from conductivity measurements. This indicates
that the value of dÄ/d[C16MeImCl] during complexation is approx-
imately the same as that during the accumulation of the monomer
in solution. In regime II after psc, the free C16MeIm+ and Cl− ions
are responsible for current conduction. When the concentration
of C16MeImCl reaches its cmc in presence of NaCMC, free micelles
started forming and we obtain regime III with a lower slope than
regime II. In this regime the unbound Cl− ions, whose concentra-
tions are increasing upon addition of C16MeImCl, carry electricity.
Similar specific conductance versus surfactant concentration pro-
files for DNA–cationic surfactant systems exhibiting three linear
segments with gradually decreasing slopes where two distinct
breaks are discernible have also been reported earlier (Dias et al.,
2008). Conductivity isotherms with lower complexity manifesting
two linear sections with one inflection (e.g., in aqueous NaPSS-
alkyltrimethylammonium bromide (Kogez & Skerjanc, 1999) or
in sodium dextran sulfate–dodecylpyridinium chloride system
(Anghel et al., 2007) and those with higher complexity show-
ing up four linear portions with three inflections (e.g., in aqueous
NaCMC–cetyltrimethylammonium bromide solution (Chakraborty
et al., 2006) are also available in the literature. It may, however, be
noted that for aqueous NaCMC–cetyltrimethylammonium bromide
solution, where three-break conductivity isotherm was reported,
the slopes of the straight lines before and after the psc differ neg-
ligibly from each other. The lower complexity in the conductivity
profiles of the NaCMC–C16MeImCl (aq) system observed here may
be attributed to the predominance of the electrostatic interac-
tions over the hydrophobic effect in presence of the highly charged
polyions.
The values of cac and cmc* obtained from conductometry are
listed in Table 3. It is observed that the values of cac (both from
tensiometry and conductometry), psc (only from tensiometry), and
cmc* (both from tensiometry and conductometry), values increase
monotonically with increasing added NaCMC concentration at any
given temperature. They are also found to increase with increasing
temperature in presence of a given amount of NaCMC.
A slight increase in cac and psc with NaCMC concentration was
observed (cf. Table 3).
The cmc and cmc* values are found to increase with increasing
amount of the added NaCMC at any given experimental temper-
ature. This may be ascribed to the lowering in the concentration
of free C16MeImCl molecules since more C16MeImCl molecules are
required to saturate an increased amount of NaCMC.
The influence of temperature on the critical aggregation con-
centration (cac) can be interpreted on the basis of the temperature
dependence of the charge density of the PE. Although the influ-
ence of of NaCMC at different temperatures on the cac values is
small, it is clearly discernible from Fig. 4 where cac values mea-
sured at different temperatures have been plotted as a function of
of NaCMC in presence of three different PE concentrations. The
profiles demonstrate a slow rise in the cac values with the PE charge
density for each NaCMC concentration. The observation can be
accounted for in terms of electrostatics: an increase in the temper-
ature causes an increase in the value of . At elevated temperatures,
the local cmc, needed for self-aggregation of the amphiphile on the
polyion, is thus reached at a somewhat higher surfactant concen-
tration, leading to an increased cac.](https://image.slidesharecdn.com/7b0e8344-1860-42fb-9690-bffdbcbc0345-160219062224/85/2014_CP-6-320.jpg)


![Preparation of pyrimido[4,5 b][1,6]naphthyridin-4(1 h)-one derivatives](https://cdn.slidesharecdn.com/ss_thumbnails/preparationofpyrimido45-b16naphthyridin-41h-onederivatives-210602193308-thumbnail.jpg?width=640&height=640&fit=bounds)


![Role of ionic liquid [BMIMPF6] in modifying the](https://cdn.slidesharecdn.com/ss_thumbnails/eb9c3db6-1e32-4afe-8d5b-517cb97ba021-150401041415-conversion-gate01-thumbnail.jpg?width=640&height=640&fit=bounds)


