2015 10-05 CoreLogic RP Data Property Pulse Article of Interest via @ljgrealestate.com; The proportion of loss-making resales in Brisbane was recorded at 9.8% over the June 2015 quarter

The proportion of loss-making resales in Brisbane was recorded at 9.8% over the June 2015 quarter. Most regions of the city are seeing the proportion of loss-making resales trending lower however, Inner City and North Brisbane have seen a noticeable jump. Again this is probably in part due to the large injection of new units in these areas. It is also noticeable how much lower the proportion of lossmaking resales are in those regions closer to the city centre CoreLogic RP Data Property Pulse Monday 5 October, 2015 The % of loss-making resales across the capitals Earlier this week the CoreLogic RP Data Pain & Gain Report for June 2015 was released, in this week’s Property Pulse we look at the results across regions within the capital cities during the current value growth phase. Source: CoreLogic RP Data (East, North, South West and Inner City) relative to the other areas further away from the Brisbane CBD. It should be noted that the proportion of loss-making resales is generally trending lower in these outer regions.
Recommended

Recommended
More Related Content
What's hot
What's hot (20)
Viewers also liked
Viewers also liked (16)
Similar to 2015 10-05 CoreLogic RP Data Property Pulse Article of Interest via @ljgrealestate.com; The proportion of loss-making resales in Brisbane was recorded at 9.8% over the June 2015 quarter
Similar to 2015 10-05 CoreLogic RP Data Property Pulse Article of Interest via @ljgrealestate.com; The proportion of loss-making resales in Brisbane was recorded at 9.8% over the June 2015 quarter (20)
More from LJ Gilland Real Estate Pty Ltd
More from LJ Gilland Real Estate Pty Ltd (20)
Recently uploaded
Recently uploaded (20)
2015 10-05 CoreLogic RP Data Property Pulse Article of Interest via @ljgrealestate.com; The proportion of loss-making resales in Brisbane was recorded at 9.8% over the June 2015 quarter
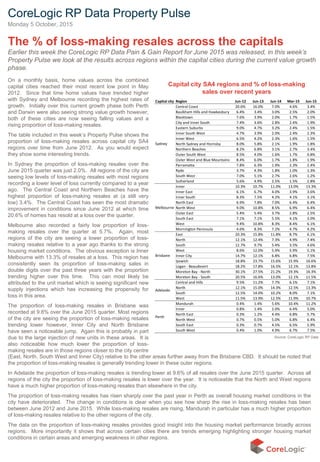
- 1. Capital city Region Jun-12 Jun-13 Jun-14 Mar-15 Jun-15 Central Coast 20.6% 16.0% 7.0% 4.6% 3.4% Baulkham Hills and Hawkesbury 6.4% 3.4% 3.0% 2.5% 2.0% Blacktown 7.6% 3.9% 2.0% 1.7% 1.5% City and Inner South 7.4% 3.6% 2.8% 2.4% 1.9% Eastern Suburbs 9.0% 4.7% 3.2% 2.4% 1.5% Inner South West 4.7% 3.9% 2.0% 2.4% 2.3% Inner West 6.5% 4.2% 2.3% 1.6% 1.5% North Sydney and Hornsby 8.0% 5.8% 2.1% 1.9% 1.8% Northern Beaches 8.2% 6.8% 3.1% 2.7% 3.4% Outer South West 8.5% 4.0% 1.6% 1.7% 0.8% Outer West and Blue Mountains 8.4% 6.0% 1.7% 1.8% 1.9% Parramatta 7.8% 6.3% 1.9% 2.3% 2.4% Ryde 3.7% 4.3% 1.8% 1.0% 1.3% South West 7.0% 5.1% 2.7% 2.6% 1.2% Sutherland 5.6% 4.9% 2.5% 1.5% 2.8% Inner 10.3% 10.7% 11.0% 13.0% 13.3% Inner East 6.1% 6.7% 4.0% 3.9% 3.6% Inner South 8.3% 7.5% 4.2% 4.1% 3.1% North East 6.9% 7.8% 7.0% 6.4% 6.4% North West 9.0% 10.8% 8.5% 6.9% 6.4% Outer East 5.4% 5.4% 3.7% 2.8% 2.5% South East 7.1% 7.1% 5.5% 4.1% 3.0% West 9.4% 10.8% 8.3% 8.4% 6.1% Mornington Peninsula 4.6% 8.3% 7.2% 4.7% 4.2% East 20.3% 15.8% 11.8% 8.7% 6.1% North 12.1% 12.4% 7.3% 4.9% 7.4% South 12.7% 9.7% 5.4% 3.5% 4.6% West 8.6% 12.0% 5.9% 5.9% 5.1% Inner City 14.7% 12.1% 6.8% 6.8% 7.5% Ipswich 18.8% 23.7% 15.6% 15.9% 16.6% Logan - Beaudesert 18.2% 17.8% 16.5% 12.1% 13.8% Moreton Bay - North 30.1% 27.5% 21.2% 19.3% 16.3% Moreton Bay - South 20.5% 16.6% 13.0% 12.1% 11.5% Central and Hills 9.5% 11.2% 7.7% 6.1% 7.1% North 12.1% 15.0% 14.3% 12.5% 13.3% South 12.5% 14.0% 10.2% 8.0% 7.1% West 11.5% 13.9% 12.5% 11.9% 10.7% Mandurah 0.4% 1.4% 5.6% 10.4% 11.2% Inner 0.8% 1.4% 2.0% 6.4% 5.0% North East 0.3% 1.2% 4.4% 6.8% 5.7% North West 0.7% 0.5% 5.0% 6.8% 6.4% South East 0.3% 0.7% 4.5% 6.5% 5.9% South West 0.4% 1.0% 4.9% 6.7% 7.5% Adelaide Perth Sydney Melbourne Brisbane Capital city SA4 regions and % of loss-making sales over recent years On a monthly basis, home values across the combined capital cities reached their most recent low point in May 2012. Since that time home values have trended higher with Sydney and Melbourne recording the highest rates of growth. Initially over this current growth phase both Perth and Darwin were also seeing strong value growth however, both of these cities are now seeing falling values and a rising proportion of loss-making resales. The table included in this week’s Property Pulse shows the proportion of loss-making resales across capital city SA4 regions over time from June 2012. As you would expect they show some interesting trends. In Sydney the proportion of loss-making resales over the June 2015 quarter was just 2.0%. All regions of the city are seeing low levels of loss-making resales with most regions recording a lower level of loss currently compared to a year ago. The Central Coast and Northern Beaches have the highest proportion of loss-making resales at (a still very low) 3.4%. The Central Coast has seen the most dramatic improvement in conditions since June 2012 at which time 20.6% of homes has resold at a loss over the quarter. Melbourne also recorded a fairly low proportion of loss- making resales over the quarter at 5.7%. Again, most regions of the city are seeing a lower proportion of loss- making resales relative to a year ago thanks to the strong housing market conditions. The obvious exception is Inner Melbourne with 13.3% of resales at a loss. This region has consistently seen its proportion of loss-making sales in double digits over the past three years with the proportion trending higher over this time. This can most likely be attributed to the unit market which is seeing significant new supply injections which has increasing the propensity for loss in this area. The proportion of loss-making resales in Brisbane was recorded at 9.8% over the June 2015 quarter. Most regions of the city are seeing the proportion of loss-making resales trending lower however, Inner City and North Brisbane have seen a noticeable jump. Again this is probably in part due to the large injection of new units in these areas. It is also noticeable how much lower the proportion of loss- making resales are in those regions closer to the city centre CoreLogic RP Data Property Pulse Monday 5 October, 2015 The % of loss-making resales across the capitals Earlier this week the CoreLogic RP Data Pain & Gain Report for June 2015 was released, in this week’s Property Pulse we look at the results across regions within the capital cities during the current value growth phase. Source: CoreLogic RP Data (East, North, South West and Inner City) relative to the other areas further away from the Brisbane CBD. It should be noted that the proportion of loss-making resales is generally trending lower in these outer regions. In Adelaide the proportion of loss-making resales is trending lower at 9.6% of all resales over the June 2015 quarter. Across all regions of the city the proportion of loss-making resales is lower over the year. It is noticeable that the North and West regions have a much higher proportion of loss-making resales than elsewhere in the city. The proportion of loss-making resales has risen sharply over the past year in Perth as overall housing market conditions in the city have deteriorated. The change in conditions is clear when you see how sharp the rise in loss-making resales has been between June 2012 and June 2015. While loss-making resales are rising, Mandurah in particular has a much higher proportion of loss-making resales relative to the other regions of the city. The data on the proportion of loss-making resales provides good insight into the housing market performance broadly across regions. More importantly it shows that across certain cities there are trends emerging highlighting stronger housing market conditions in certain areas and emerging weakness in other regions.