CoreLogic National Home Value Index: Housing values rose across every capital city in January despite slower growth
•
0 likes•62 views

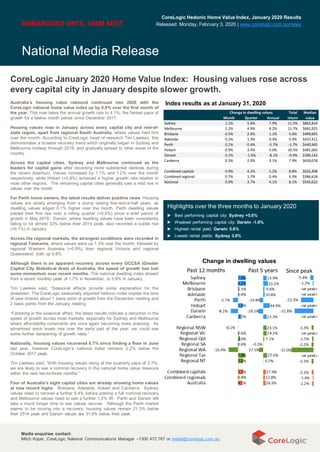
Housing values rose across Australian cities and regions in January 2020, according to CoreLogic's Hedonic Home Value Index. Sydney and Melbourne saw the strongest gains of 1.1% and 1.2% respectively. Overall the national index was up 0.9% in January, bringing the annual growth rate to 4.1%. While the recovery is broad-based, slowing growth signals affordability pressures are rising in large cities like Sydney and Melbourne.

Recommended
Recommended
More Related Content
What's hot
What's hot (20)
Similar to CoreLogic National Home Value Index: Housing values rose across every capital city in January despite slower growth
Similar to CoreLogic National Home Value Index: Housing values rose across every capital city in January despite slower growth (20)
More from LJ Gilland Real Estate Pty Ltd
More from LJ Gilland Real Estate Pty Ltd (18)
Recently uploaded
Recently uploaded (20)
CoreLogic National Home Value Index: Housing values rose across every capital city in January despite slower growth
- 1. National Media Release Media enquiries contact: Mitch Koper, CoreLogic National Communications Manager –1300 472 767 or media@corelogic.com.au Media enquiries contact: Mitch Koper, CoreLogic National Communications Manager –1300 472 767 or media@corelogic.com.au Highlights over the three months to January 2020 ▶ Best performing capital city: Sydney +5.6% ▶ Weakest performing capital city: Darwin -1.6% ▶ Highest rental yield: Darwin 5.8% ▶ Lowest rental yields: Sydney 3.0% Index results as at January 31, 2020 EMBARGOED UNTIL 10AM AEDT Australia’s housing value rebound continued into 2020 with the CoreLogic national home value index up by 0.9% over the first month of the year. This now takes the annual growth rate to 4.1%; the fastest pace of growth for a twelve month period since December 2017. Housing values rose in January across every capital city and rest-of- state region, apart from regional South Australia, where values held firm over the month. According to CoreLogic head of research Tim Lawless, this demonstrates a broader recovery trend which originally began in Sydney and Melbourne midway through 2019, and gradually spread to other areas of the country. Across the capital cities, Sydney and Melbourne continued as the leaders for capital gains after recording more substantial declines during the recent downturn. Values increased by 1.1% and 1.2% over the month respectively, while Hobart (+0.9%) achieved a higher growth rate relative to most other regions. The remaining capital cities generally saw a mild rise in values over the month. For Perth home owners, the latest results deliver positive news. Housing values are slowly emerging from a slump lasting five-and-a-half years, as dwelling values edged 0.1% higher over the month. Perth dwelling values posted their first rise over a rolling quarter (+0.4%) since a brief period of growth in May 2018. Darwin, where dwelling values have been consistently falling to be almost 32% below their 2014 peak, also recorded a subtle rise (+0.1%) in January. Across the regional markets, the strongest conditions were recorded in regional Tasmania, where values were up 1.3% over the month, followed by regional Western Australia (+0.9%) then regional Victoria and regional Queensland, both up 0.8% Although there is an apparent recovery across every GCCSA (Greater Capital City Statistical Area) of Australia, the speed of growth has lost some momentum over recent months. The national dwelling index slowed from a recent monthly peak of 1.7% in November, to 0.9% in January. Tim Lawless said, “Seasonal effects provide some explanation for the slowdown. The CoreLogic seasonally adjusted hedonic index implies the time of year shaves about 1 basis point of growth from the December reading and 2 basis points from the January reading. “Factoring in the seasonal affect, the latest results indicate a reduction in the speed of growth across most markets, especially for Sydney and Melbourne where affordability constraints are once again becoming more pressing. As advertised stock levels rise over the early part of the year, we could see some further dampening of growth rates.” Nationally, housing values recovered 6.7% since finding a floor in June last year, however CoreLogic’s national index remains 2.2% below the October 2017 peak. Tim Lawless said, “With housing values rising at the quarterly pace of 3.7%, we are likely to see a nominal recovery in the national home value measure within the next two-to-three months.” Four of Australia’s eight capital cities are already showing home values at new record highs: Brisbane, Adelaide, Hobart and Canberra. Sydney values need to recover a further 5.4% before posting a full nominal recovery and Melbourne values need to see a further 1.2% lift. Perth and Darwin will take a much longer time to see values recover. Although the Perth market seems to be moving into a recovery, housing values remain 21.3% below their 2014 peak and Darwin values are 31.8% below their peak. CoreLogic January 2020 Home Value Index: Housing values rose across every capital city in January despite slower growth. CoreLogic Hedonic Home Value Index, January 2020 Results Released: Monday, February 3, 2020 | www.corelogic.com.au/news Change in dwelling values Month Quarter Annual Sydney 1.1% 5.6% 7.9% 11.5% $862,814 Melbourne 1.2% 4.9% 8.2% 11.7% $681,925 Brisbane 0.5% 2.0% 1.1% 5.6% $499,691 Adelaide 0.2% 1.3% 0.4% 4.9% $437,411 Perth 0.1% 0.4% -5.7% -1.7% $440,965 Hobart 0.9% 3.4% 5.0% 10.5% $481,665 Darwin 0.1% -1.6% -8.1% -0.4% $390,143 Canberra 0.3% 2.0% 3.1% 7.9% $630,078 Combined capitals 0.9% 4.2% 5.2% 8.8% $632,408 Combined regional 0.7% 1.7% 0.4% 5.3% $386,618 National 0.9% 3.7% 4.1% 8.1% $545,622 Change in dwelling values Total return Median value
- 2. National Media Release Media enquiries contact: Mitch Koper, CoreLogic National Communications Manager –1300 472 767 or media@corelogic.com.au Media enquiries contact: Mitch Koper, CoreLogic National Communications Manager –1300 472 767 or media@corelogic.com.au Thirty-four of the forty-six capital city SA4 sub-regions have recorded an annual rise in dwelling values over the twelve months ending January with the top performing sub-regions once again confined to areas of Melbourne and Sydney. The weakest conditions have generally been across Perth and Darwin, as well as Sydney’s Central Coast region and two sub- regions in Adelaide. Melbourne’s Inner East, with a median dwelling value of $1.179 million, is leading the charge, with values up 16.2% over the year. Despite the significant gains over the past year, values remain 2.9% below their August 2017 peak. However, Tim Lawless said, “with such a rapid rate of growth, housing values in this area are likely to reach a new record high over the coming months.” On a quarterly basis, the vast majority of capital city sub-regions have moved back into positive growth. Only five of the capital city sub-regions have recorded a decline in home values over the past three months, comprising Darwin, Perth’s North West and South East, Mandurah and Brisbane’s Moreton Bay North. Regional markets have recorded a relatively soft performance. Broadly, regional housing values are up 0.4% over the twelve months ending January compared with a 5.2% rise across the combined capitals. Across the forty-two non capital city sub-regions, twenty-five areas have recorded a rise in values over the past twelve months. The best performing regional areas were mixed. Areas of regional Tasmania, which remain extremely affordable for interstate buyers, dominated the top three positions with annual growth of more than 6%. Several coastal lifestyle markets and rural service centres also featured within the top ten best performing regional locations. On a quarterly basis, thirty-eight of the non-capital city sub-regions recorded a rise in housing values, with only four regions recording a drop in values over the past three months. The weakest regional housing markets continue to be located within the broader ‘outback’ regions of Queensland and across southern Western Australia, where housing demand remains low due to the persistent drought and weaker economic conditions. Top ten and bottom ten sub-regions for annual change in dwelling values, Non capital city SA4 regions Top ten and bottom ten sub-regions for annual change in dwelling values, Capital city SA4 regions Rolling three month change across broad valuation cohorts, combined capitals The strongest gains continue to be recorded across properties in the upper quartile value range. Across the combined capitals, the value of properties in the upper quartile rose by 1.2% in January compared with a 0.2% lift in value across the lower quartile. On an annual basis, upper quartile property values are 8.5% higher while lower quartile property values are down 0.2%. The trend towards a stronger performance across premium markets is most evident in Sydney and Melbourne, and to a lesser extent, Brisbane. Sydney’s top quartile market has recorded a 10.0% lift in dwelling values over the past twelve months compared with a 3.4% rise across the lower quartile. Similarly, Melbourne's top quartile is up 11.5% in value over the past year compared with a 5.6% rise in lower quartile values. Brisbane’s upper quartile values are 1.3% higher over the year and lower quartile values are up 0.3%. The stronger performance across the more expensive end of the market comes after a larger correction during the downturn, but also may reflect a rise in borrowing capacity following the changes from APRA in July last year, as well as the dominance of owner occupier buyers (rather than investors) through the recovery phase to date. EMBARGOED UNTIL 10AM AEDT
- 3. National Media Release Media enquiries contact: Mitch Koper, CoreLogic National Communications Manager –1300 472 767 or media@corelogic.com.au Media enquiries contact: Mitch Koper, CoreLogic National Communications Manager –1300 472 767 or media@corelogic.com.au Nationally rents were up half a percent in January taking the annual change in rental rates to 1.3%. Rental growth generally remains weak across most markets, however the recent trend has been towards a subtle rise in rental appreciation. A year ago the national rental index was rising at an annual rate of just 0.4%. The improvement in rental rates can be attributed to a tightening in rental supply. Housing finance data shows investor participation in the housing market is near record lows and new supply additions are tapering. Hobart remains the tightest rental market, with rents up 5.8% over the past twelve months, followed by Adelaide (+2.0%) and Perth (+1.9%), while rents are still trending lower on an annual basis in Darwin (-1.9%) and Sydney (-0.6%). With housing values rising more rapidly than rental rates, gross rental yields are swiftly compressing. Across the combined capital cities the gross yield was tracking at 3.50% in January; the lowest yield reading since March 2018 and only eleven basis points away from record lows. Gross rental yields According to Tim Lawless, January can be a hard month to read the housing market. He said, “Seasonal factors deliver a reduction in sales activity, auction markets become quieter and listing numbers drop sharply. Through February we will receive a much better feel for housing market trends as activity returns to normal. “Despite the seasonality, there is evidence to suggest that housing value growth rates are tapering in Sydney and Melbourne, although with values rising at more than 1% month-on-month, this pace is still unsustainable considering household income growth is sluggish and housing affordability challenges are worsening.” The ratio of housing values to household incomes, based on data to September last year, has risen to 8.5 in Sydney and 7.4 in Melbourne (up from a recent low in the June quarter of 8.2 and 7.2 respectively). Since September, the ratio of dwelling values to household incomes is likely to have increased further. Housing remains more affordable relative to the highs of 2017, however it’s clear that affordability remains a significant barrier to higher buyer participation in Australia’s largest cities. Tim Lawless said, “Smaller cities, including key affordable regional markets where economic and demographic trends are healthy may offer some insulation from these affordability constraints. “Looking ahead, interest rates are expected to see further reductions, which, along with consistently strong population growth, is likely to continue to support housing demand. From a supply perspective, new housing construction remains in decline, despite the uplift in dwelling approvals over the past few months. This may lead to undersupply pressures across the new housing sector later this year, providing support for housing prices through the year.” “A big test for the market will be advertised supply levels. As the market moves out of the festive season slow down, we are expecting more home owners to take advantage of the strong selling conditions and recovery in housing prices. “Advertised listing numbers remained below average through most of 2019. We’re expecting the number of homes available for sale to also rise in 2020, which may result in a wider range of choice. The knock-on effect could dampen the sense of urgency to purchase housing, and could mitigate more rapid growth.” EMBARGOED UNTIL 10AM AEDT Gross rental yields in Sydney, where housing values have surged higher against a backdrop of falling rents, remain at record lows, tracking at just 3.0% in January. Higher rental yields can be found in cities where rental conditions have been stronger relative to housing values. Despite overall weak housing market conditions, Darwin gross rental yields are the highest of any capital city at 5.8%, which is a reflection of housing values falling more than rental rates. The healthiest yield dynamic is in Hobart where overall tight housing conditions have pushed gross rental yields to 5.0%, providing a total return (gross yield plus annual capital gain) of 10.5%. Although gross rental yields are trending lower, so too are mortgage rates. At the end of December, the average three-year fixed rate for an investor mortgage was 3.48%. This is still slightly lower than capital city gross rental yields, implying that more properties will be showing a positive cash flow for investors, and paying off a mortgage may be more affordable than paying rent in many areas.
- 4. National Media Release Media enquiries contact: Mitch Koper, CoreLogic National Communications Manager –1300 472 767 or media@corelogic.com.au Media enquiries contact: Mitch Koper, CoreLogic National Communications Manager –1300 472 767 or media@corelogic.com.au CoreLogic Home Value Index tables CoreLogic is the largest independent provider of property information, analytics and property-related risk management services in Australia and New Zealand. Methodology: The CoreLogic Hedonic Home Value Index is calculated using a hedonic regression methodology that addresses the issue of compositional bias associated with median price and other measures. In simple terms, the index is calculated using recent sales data combined with information about the attributes of individual properties such as the number of bedrooms and bathrooms, land area and geographical context of the dwelling. By separating each property into its various formational and locational attributes, observed sales values for each property can be distinguished between those attributed to the property’s attributes and those resulting from changes in the underlying residential property market. Additionally, by understanding the value associated with each attribute of a given property, this methodology can be used to estimate the value of dwellings with known characteristics for which there is no recent sales price by observing the characteristics and sales prices of other dwellings which have recently transacted. It then follows that changes in the market value of the entire residential property stock can be accurately tracked through time. The detailed methodological information can be found at: https://www.corelogic.com.au/research/rp-data-corelogic- home-value-index-methodology/ CoreLogic is able to produce a consistently accurate and robust Hedonic Index due to its extensive property related database, which includes transaction data for every home sale within every state and territory. CoreLogic augments this data with recent sales advice from real estate industry professionals, listings information and attribute data collected from a variety of sources. * The median value is the middle estimated value of all residential properties derived through the hedonic regression methodology that underlies the CoreLogic Hedonic Home Value Index. EMBARGOED UNTIL 10AM AEDT Sydney Melbourne Brisbane Adelaide Perth Hobart Darwin Canberra Regional NSW Regional Vic Regional Qld Regional SA Regional WA Regional Tas Regional NT Combined capitals Combined regional National Month 1.1% 1.2% 0.5% 0.2% 0.1% 0.9% 0.1% 0.3% 0.5% 0.8% 0.8% 0.0% 0.9% 1.3% na 0.9% 0.7% 0.9% Quarter 5.6% 4.9% 2.0% 1.3% 0.4% 3.4% -1.6% 2.0% 1.4% 2.3% 2.1% 0.8% 0.0% 3.6% na 4.2% 1.7% 3.7% YTD 1.1% 1.2% 0.5% 0.2% 0.1% 0.9% 0.1% 0.3% 0.5% 0.8% 0.8% 0.0% 0.9% 1.3% na 0.9% 0.7% 0.9% Annual 7.9% 8.2% 1.1% 0.4% -5.7% 5.0% -8.1% 3.1% -0.1% 0.6% 2.0% 0.6% -10.4% 7.4% na 5.2% 0.4% 4.1% Total return 11.5% 11.7% 5.6% 4.9% -1.7% 10.5% -0.4% 7.9% 4.7% 5.6% 7.1% 6.5% -5.0% 13.5% n a 8.8% 5.3% 8.1% Gross yield 3.0% 3.2% 4.5% 4.5% 4.3% 5.0% 5.8% 4.7% 4.6% 4.5% 5.3% 5.8% 6.2% 5.3% na 3.5% 5.0% 3.8% Median value $862,814 $681,925 $499,691 $437,411 $440,965 $481,665 $390,143 $630,078 $456,173 $375,802 $377,994 $233,491 $306,439 $310,570 na $632,408 $386,618 $545,622 Month 1.5% 1.4% 0.7% 0.2% 0.1% 0.9% 0.6% 0.3% 0.5% 0.7% 0.8% -0.3% 0.9% 1.3% 0.8% 1.1% 0.6% 1.0% Quarter 6.7% 5.6% 2.3% 1.3% 0.4% 2.9% -1.4% 2.1% 1.5% 2.3% 2.4% 0.4% -0.2% 3.7% 1.2% 4.6% 1.8% 4.0% YTD 1.5% 1.4% 0.7% 0.2% 0.1% 0.9% 0.6% 0.3% 0.5% 0.7% 0.8% -0.3% 0.9% 1.3% 0.8% 1.1% 0.6% 1.0% Annual 9.3% 8.0% 1.4% 0.3% -5.6% 5.1% -9.7% 4.0% 0.2% -0.1% 2.7% 0.5% -10.3% 6.3% 1.6% 5.2% 0.5% 4.1% Total return 12.8% 11.0% 5.6% 4.6% -1.7% 10.6% -2.5% 8.5% 5.1% 4.9% 7.6% 6.4% -4.9% 11.9% 9.9% 8.7% 5.3% 7.9% Gross yield 2.7% 2.8% 4.3% 4.3% 4.2% 5.0% 5.4% 4.3% 4.6% 4.5% 5.2% 5.7% 6.1% 5.3% 6.7% 3.3% 4.9% 3.6% Median value $994,300 $798,671 $547,860 $474,273 $456,803 $512,899 $469,834 $701,561 $468,354 $396,614 $386,073 $237,004 $317,961 $321,233 $406,687 $663,844 $397,479 $557,403 Month 0.3% 0.7% -0.6% 0.5% 0.3% 0.8% -1.1% 0.1% 0.3% 1.3% 0.7% 6.1% 1.6% 1.6% na 0.4% 0.8% 0.4% Quarter 3.2% 3.5% 0.4% 1.3% 0.7% 5.4% -2.1% 1.6% 0.6% 2.4% 1.2% 9.1% 3.5% 3.1% na 2.9% 1.3% 2.6% YTD 0.3% 0.7% -0.6% 0.5% 0.3% 0.8% -1.1% 0.1% 0.3% 1.3% 0.7% 6.1% 1.6% 1.6% na 0.4% 0.8% 0.4% Annual 4.9% 8.7% -0.3% 1.0% -5.9% 4.8% -4.9% 0.0% -2.0% 5.2% -0.3% 5.6% -8.1% 17.4% na 4.9% -0.1% 4.2% Total return 9.0% 12.9% 5.3% 6.8% -1.4% 10.4% 3.3% 5.8% 2.9% 10.6% 5.7% 8.4% -2.9% 24.4% n a 9.3% 5.4% 8.7% Gross yield 3.6% 4.0% 5.3% 5.5% 5.2% 5.1% 6.8% 5.8% 4.7% 4.7% 5.6% 6.0% 7.5% 5.5% na 4.0% 5.3% 4.2% Median value $750,116 $580,805 $383,573 $324,617 $352,556 $398,205 $275,636 $441,400 $396,403 $290,510 $359,454 $184,464 $212,808 $255,406 na $572,374 $346,545 $514,229 Units Rest of state regions Aggregate indicesCapitals DwellingsHouses