CoreLogic-home-value-index-FEB-23-FINAL.pdf
•
1 like•14 views

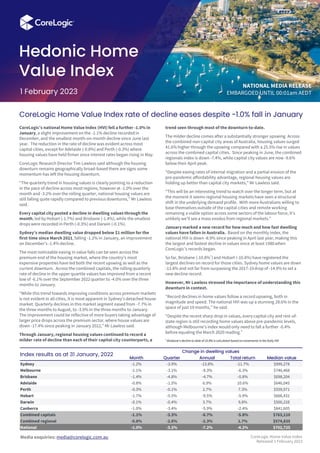
January marked a new record for how much and how fast dwelling values have fallen in Australia. Based on the monthly index, the national HVI is down -8.9% since peaking in April last year, making this the largest and fastest decline in values since at least 1980 when CoreLogic’s records began. So far, Brisbane (-10.8%* ) and Hobart (-10.8%) have registered the largest declines on record for those cities. Sydney home values are down -13.8% and not far from surpassing the 2017-19 drop of -14.9% to set a new decline record.

Recommended
Recommended
More Related Content
Similar to CoreLogic-home-value-index-FEB-23-FINAL.pdf
Similar to CoreLogic-home-value-index-FEB-23-FINAL.pdf (20)
More from LJ Gilland Real Estate Pty Ltd
More from LJ Gilland Real Estate Pty Ltd (18)
Recently uploaded
Recently uploaded (20)
CoreLogic-home-value-index-FEB-23-FINAL.pdf
- 1. Media enquiries: media@corelogic.com.au Hedonic Home Value Index Change in dwelling values Month Quarter Annual Total return Median value Sydney -1.2% -3.9% -13.8% -11.7% $999,278 Melbourne -1.1% -3.1% -9.3% -6.3% $746,468 Brisbane -1.4% -4.8% -4.7% -0.8% $698,204 Adelaide -0.8% -1.5% 6.9% 10.6% $646,045 Perth -0.3% -0.1% 2.7% 7.3% $559,971 Hobart -1.7% -5.5% -9.5% -5.9% $666,431 Darwin -0.1% -0.4% 3.7% 9.8% $500,228 Canberra -1.0% -3.4% -5.9% -2.4% $841,605 Combined capitals -1.1% -3.3% -8.7% -5.8% $763,110 Combined regional -0.8% -2.6% -2.3% 1.7% $574,835 National -1.0% -3.2% -7.2% -4.2% $702,725 CoreLogic Home Value Index rate of decline eases despite -1.0% fall in January CoreLogic’s national Home Value Index (HVI) fell a further -1.0% in January, a slight improvement on the -1.1% decline recorded in December, and the smallest month-on-month decline since June last year. The reduction in the rate of decline was evident across most capital cities, except for Adelaide (-0.8%) and Perth (-0.3%) where housing values have held firmer since interest rates began rising in May. CoreLogic Research Director Tim Lawless said although the housing downturn remains geographically broad-based there are signs some momentum has left the housing downturn. “The quarterly trend in housing values is clearly pointing to a reduction in the pace of decline across most regions, however at -1.0% over the month and -3.2% over the rolling quarter, national housing values are still falling quite rapidly compared to previous downturns,” Mr Lawless said. Every capital city posted a decline in dwelling values through the month, led by Hobart (-1.7%) and Brisbane (-1.4%), while the smallest drops were recorded in Perth (-0.3%) and Darwin (-0.1%). Sydney’s median dwelling value dropped below $1 million for the first time since March 2021, falling -1.2% in January, an improvement on December’s -1.4% decline. The most noticeable easing in value falls can be seen across the premium end of the housing market, where the country’s most expensive properties have led both the recent upswing as well as the current downturn. Across the combined capitals, the rolling quarterly rate of decline in the upper quartile values has improved from a recent low of -6.1% over the September 2022 quarter to -4.0% over the three months to January. “While this trend towards improving conditions across premium markets is not evident in all cities, it is most apparent in Sydney’s detached house market. Quarterly declines in this market segment eased from -7.7% in the three months to August, to -3.9% in the three months to January. The improvement could be reflective of more buyers taking advantage of larger price drops across the premium sector, where house values are down -17.4% since peaking in January 2022,” Mr Lawless said. Through January, regional housing values continued to record a milder rate of decline than each of their capital city counterparts, a trend seen through most of the downturn to-date. The milder decline comes after a substantially stronger upswing. Across the combined non-capital city areas of Australia, housing values surged 41.6% higher through the upswing compared with a 25.5% rise in values across the combined capital cities. Since peaking in June, the combined regionals index is down -7.4%, while capital city values are now -9.6% below their April peak. “Despite easing rates of internal migration and a partial erosion of the pre-pandemic affordability advantage, regional housing values are holding up better than capital city markets,” Mr Lawless said. "This will be an interesting trend to watch over the longer term, but at the moment it seems regional housing markets have seen a structural shift in the underlying demand profile. With more Australians willing to base themselves outside of the capital cities and remote working remaining a viable option across some sectors of the labour force, it’s unlikely we’ll see a mass exodus from regional markets.” January marked a new record for how much and how fast dwelling values have fallen in Australia. Based on the monthly index, the national HVI is down -8.9% since peaking in April last year, making this the largest and fastest decline in values since at least 1980 when CoreLogic’s records began. So far, Brisbane (-10.8%*) and Hobart (-10.8%) have registered the largest declines on record for those cities. Sydney home values are down -13.8% and not far from surpassing the 2017-19drop of -14.9% to set a new decline record. However, Mr Lawless stressed the importance of understanding this downturn in context. “Record declines in home values follow a record upswing, both in magnitude and speed. The national HVI was up a stunning 28.6% in the space of just 19 months,” he said. “Despite the recent sharp drop in values, every capital city and rest-of- state region is still recording home values above pre-pandemic levels, although Melbourne’s index would only need to fall a further -0.4% before equaling the March 2020 reading.” CoreLogic Home Value Index Released 1 February 2023 1 February 2023 Index results as at 31 January, 2022 NATIONAL MEDIA RELEASE EMBARGOED UNTIL 00:01am AEDT * Brisbane's decline to date of 10.8% is calculated based on movements in the Daily HVI
- 2. Media enquiries: media@corelogic.com.au Housing values across most of the broad regions of Australia have moved through a peak, following a significant rise in dwelling values Change in dwelling values to end of January 2023 Past 12 months Past 3 months Past month Rolling three-month change in dwelling values State capitals Hedonic Home Value Index Rolling three-month change in dwelling values Combined capitals v Combined regionals Sydney, -3.9% Melbourne, -3.1% Brisbane, -4.8% Adelaide, -1.5% Perth, -0.1% -7% -5% -3% -1% 1% 3% 5% 7% 9% Jan 18 Jan 19 Jan 20 Jan 21 Jan 22 Jan 23 Combined capitals, -3.3% Combined regionals, -2.6% -6% -4% -2% 0% 2% 4% 6% 8% Jan 18 Jan 19 Jan 20 Jan 21 Jan 22 Jan 23 -1.2% -1.1% -1.4% -0.8% -0.3% -1.7% -0.1% -1.0% -1.0% -0.7% -0.8% 0.5% 0.4% -1.1% -1.1% -0.8% -1.0% Sydney Melbourne Brisbane Adelaide Perth Hobart Darwin Canberra Regional NSW Regional Vic Regional Qld Regional SA Regional WA Regional Tas Combined capitals Combined regionals Australia -13.8% -9.3% -4.7% 6.9% 2.7% -9.5% 3.7% -5.9% -5.2% -3.5% -0.8% 15.3% 4.9% -0.4% -8.7% -2.3% -7.2% -3.9% -3.1% -4.8% -1.5% -0.1% -5.5% -0.4% -3.4% -3.8% -2.2% -2.5% 2.3% 1.9% -1.6% -3.3% -2.6% -3.2% CoreLogic Home Value Index Released 1 February 2023 Region COVID trough to peak growth Decline from recent peak Month of recent peak Sydney 27.7% -13.8% Jan 22 Melbourne 17.3% -9.3% Feb 22 Brisbane 42.7% -10.7% Jun 22 Adelaide 44.7% -2.1% Jul 22 Perth 25.9% -0.9% Jul 22 Hobart 37.7% -10.8% May 22 Darwin 31.1% -1.3% Aug 22 ACT 38.3% -8.6% Jun 22 Regional NSW 47.6% -9.7% May 22 Regional Vic 35.0% -6.6% May 22 Regional Qld 42.7% -7.1% Jun 22 Regional SA 47.0% <at peak> Regional WA 32.1% <at peak> Regional Tas 51.0% -6.1% Jun 22 Combined capitals 25.5% -9.6% Apr 22 Combined regionals 41.6% -7.4% Jun 22 Australia 28.6% -8.9% Apr 22
- 3. Media enquiries: media@corelogic.com.au Low advertised supply remains a feature of the housing market through January, as the flow of new listings holds well below average for this time of the year. New capital city listings added to the market over the four weeks ending January 29 were -22.2% lower than over the same period last year and -24.5% below the previous five-year average. Every capital city recorded a below average number of new listings through January, reflecting an ongoing reluctance from prospective vendors to test the market. “Such a low number of new listings implies most home owners don’t need to sell, rather, they seem to be prepared to wait this downturn out,” Mr Lawless said. “This trend of lower than normal levels of new listings has been persistent through spring and early summer and looks to be continuing into 2023.” Housing demand has also fallen away. Capital city dwelling sales over the past three months were estimated to be -29.4% lower relative to the same period in 2022 and -11.5% below the previous five-year average. Sydney (-40.6%), Melbourne (-39.8%) and Brisbane (-36.5%) have had the largest quarterly drop in sales relative to the same period last year. At the same time, cities where home values have held firmer have also recorded much smaller falls in home sales. The rolling quarterly estimate of dwelling sales across Adelaide was only -2.8% lower than a year ago, Perth sales were -3.6% lower and in Darwin home sales were estimated to be 19.6% higher, albeit with some volatility. Mr Lawless said it’s unlikely listing and purchasing activity will return to average levels until consumer sentiment starts to improve. “There is a strong relationship between consumer attitudes and the number of homes sales. With sentiment remaining around recessionary lows, it’s harder for consumers to make high commitment decisions such as buying or selling a home,” he said. “Until Australianshave a higher level of confidence with regards to their household finances and the outlook for the economy, its likely they will continue to delay major financial decisions.” New listings, rolling 28-day count, combined capitals Total listings, rolling 28-day count, combined capitals Hedonic Home Value Index Rolling three month volume of sales, Combined capitals Note recent months are estimates and will revise CoreLogic Home Value Index Released 1 February 2023 0 5,000 10,000 15,000 20,000 25,000 30,000 35,000 Jan Feb Mar Apr May Jun Jul Aug Sep Oct Nov Dec 2022 2023 Previous 5yr average 16,770 new listings over the 4 weeks ending 29 Jan -22.2% below same time last year -24.5% below 5yr average 0 20,000 40,000 60,000 80,000 100,000 120,000 Jan Feb Mar Apr May Jun Jul Aug Sep Oct Nov Dec 2022 2023 Previous 5yr average 70,792 active listings over the 4 weeks ending 29 Jan -5.6% below same time last year -24.0% below 5yr average 0 10,000 20,000 30,000 40,000 50,000 60,000 70,000 80,000 Jan 13 Jan 14 Jan 15 Jan 16 Jan 17 Jan 18 Jan 19 Jan 20 Jan 21 Jan 22 Jan 23 Houses Units
- 4. Media enquiries: media@corelogic.com.au The monthly pace of rental growth picked up a little in January, with national rents up 0.7% compared with a 0.6% rise in December, but still well below the peak monthly rental growth rate from May 2022 (1.0%). The rise in the pace of rental growth was centered in the capital city markets, where monthly rental growth lifted from 0.6% in December to 0.8% in January. Growth in rents across the combined rest-of-state areas reduced from 0.6% in December to 0.4% in January. Over the rolling quarter, national rents rose 2.1% which was higher than Q4 last year (2.0%) but down from a recent high of 3.2% over the three months ending March 2021. “After recording substantially larger increases through the worst of the pandemic, the rate of growth in house rents is generally easing in most regions, reflecting a transition of demand towards more affordable, higher density types of rental stock,” Mr Lawless said. “In contrast, unit rents have seen a surge in rental growth over the past year. This can be attributed to a combination of affordability pressures driving more rental demand towards cheaper rental options, and a possible reversal in rental preferences as tenants once again seek out housing options closer to centres of amenity such as the CBD and transport hubs.” It’s likely a resurgence in overseas student numbers will add to rental demand over the coming months, especially in light of the recent policy announcement in China where academic degrees and diplomas awarded from online studies will no longer be recognised. With overseas student numbers surging, it is likely inner-city rental precincts and suburbs close to universities, especially those in Melbourne and Sydney, will see a further tightening in vacancy rates and upwards pressure on rents. Inner Melbourne rents are up almost 30% over the past 12 months and inner Sydney rents are more than 20% higher than this time last year. Gross rental yields have continued to trend higher, rising from an historic low of just 3.21% in February 2022 to 3.85% in January 2023. The 64-basis point recovery over the past 11 months, has seen gross yields rise above the levels recorded at the onset of COVID in March 2020 (3.76%). Annual change in rents, Houses Annual change in rents, Units Gross rental yields, dwellings Hedonic Home Value Index Sydney, 8.9% Melbourne, 6.7% Brisbane, 12.5% Adelaide, 12.4% Perth, 11.9% Hobart, 5.2% Darwin, 4.0% Canberra, 2.7% -10% -6% -2% 2% 6% 10% 14% 18% 22% Jan 18 Jan 19 Jan 20 Jan 21 Jan 22 Jan 23 Sydney, 15.9% Melbourne, 13.6% Brisbane, 15.3% Adelaide, 13.1% Perth, 11.6% Hobart, 8.1% Darwin, 6.0% Canberra, 4.7% -10% -6% -2% 2% 6% 10% 14% 18% 22% Jan 18 Jan 19 Jan 20 Jan 21 Jan 22 Jan 23 3.2% 3.3% 4.3% 4.0% 4.8% 4.2% 6.3% 4.1% 4.1% 3.8% 5.0% 5.1% 6.3% 4.6% 7.1% 3.6% 4.5% 3.9% Sydney Melbourne Brisbane Adelaide Perth Hobart Darwin Canberra Regional NSW Regional Vic Regional Qld Regional SA Regional WA Regional Tas Regional NT Combined capitals Combined regional National CoreLogic Home Value Index Released 1 February 2023
- 5. Media enquiries: media@corelogic.com.au Housing outlook The trajectory of housing values remains intrinsically linked with the path of interest rates. Mr Lawless said the good news is the cash rate may be approaching a ceiling as speculation mounts that inflation has moved through a peak at the end of last year. However, there is likely to be at least one more rate hike, potentially more, that will continue to erode borrowing capacity and exert additional downwards pressure on housing values. “A few clues that inflation may have peaked can be seen in the quarterly CPI numbers. While the trimmed mean remains extremely high, the quarterly growth rate reduced in Q4, due in part to a sharp drop in the housing component of CPI, which carries the largest weight within the CPI ‘basket,” Mr Lawless said. “The Cordell Construction Cost Index (CCCI), which measures new residential building costs, confirms a drop in cost pressures associated with new homes and major renovations in the December quarter last year. “We can also see the main driver of inflation has switched from non- discretionary price rises to discretionary. As the recent spate of rate hikes eventually dampens consumer demand we are likely to see a pull back on discretionary spending, helping to push inflation lower.” Once interest rates move through a peak, it’s likely that housing values will stabilise. Mr Lawless said there may be a few month’s lag before declines flatten out, and the market would need some form of stimulus before a new growth cycle commenced. “The most obvious stimulus would come from a drop in interest rates, but any cut to the cash rate probably won’t occur until late this year at the earliest. Other factors that could support housing activity would be a rise in consumer sentiment, an easing in credit policy, such as a reduction to APRA’s serviceability buffer, or fiscal incentives aimed at stimulating housing demand.” Some downside risk from the large number of fixed rate mortgages due to expire later this year remains. Around two thirds of fixed rate home loans, which comprise a substantially larger portion of the loan book than historically normal, will expire in 2023, with many moving from interest rates around 2% to a rate closer to 6%. “It’s likely mortgage arrears will rise from last year’s record lows, but the risk of a material increase in mortgage arrears or defaults should be minimised as long as labour markets remain tight. Although labour markets are expected to loosen throughout2023, it’s unlikely the unemployment rate will rise above long-term average levels,” Mr Lawless said. Advertised stock levels will be a key metric to keep an eye on. Inventory levels remain well below average, mostly due to persistently low levels of fresh stock coming on the market. Such low advertised supply has arguably helped to keep a lid on value declines, but a lift in supply without a commensurate rise in demand could prolong the downturn. With overseas migration accelerating, especially among foreign students, rental vacancies are likely to remain extremely tight in some markets, leading to further upwards pressure on rents. The rental market is already imbalanced, with vacancy rates holding around record lows. Demand-side pressures are increasing, especially across the largest capitals which have historically attracted the largest portion of overseas migration. At the same time there is little evidence of additional rental supply coming to market. The net outcome is likely to be a further lift in rents and a worsening in social issues associated with unaffordable accommodation costs. Hedonic Home Value Index CoreLogic Home Value Index tables Capitals Rest of state regions Aggregate indices Sydney Melbourne Brisbane Adelaide Perth Hobart Darwin Canberra Regional NSW Regional Vic Regional Qld Regional SA Regional WA Regional Tas Regional NT Combined capitals Combined regional National All Dwellings Month -1.2% -1.1% -1.4% -0.8% -0.3% -1.7% -0.1% -1.0% -1.0% -0.7% -0.8% 0.5% 0.4% -1.1% na -1.1% -0.8% -1.0% Quarter -3.9% -3.1% -4.8% -1.5% -0.1% -5.5% -0.4% -3.4% -3.8% -2.2% -2.5% 2.3% 1.9% -1.6% na -3.3% -2.6% -3.2% YTD -1.2% -1.1% -1.4% -0.8% -0.3% -1.7% -0.1% -1.0% -1.0% -0.7% -0.8% 0.5% 0.4% -1.1% na -1.1% -0.8% -1.0% Annual -13.8% -9.3% -4.7% 6.9% 2.7% -9.5% 3.7% -5.9% -5.2% -3.5% -0.8% 15.3% 4.9% -0.4% na -8.7% -2.3% -7.2% Total return -11.7% -6.3% -0.8% 10.6% 7.3% -5.9% 9.8% -2.4% -1.8% -0.1% 3.5% 21.4% 11.3% 2.5% n a -5.8% 1.7% -4.2% Gross yield 3.2% 3.3% 4.3% 4.0% 4.8% 4.2% 6.3% 4.1% 4.1% 3.8% 5.0% 5.1% 6.3% 4.6% na 3.6% 4.5% 3.9% Median value $999,278 $746,468 $698,204 $646,045 $559,971 $666,431 $500,228 $841,605 $684,246 $563,028 $549,562 $352,955 $424,210 $506,293 na $763,110 $574,835 $702,725 Houses Month -1.3% -1.1% -1.6% -0.9% -0.3% -1.6% 0.1% -1.2% -1.0% -0.7% -0.9% 0.6% 0.4% -1.0% 2.2% -1.1% -0.8% -1.0% Quarter -4.2% -3.5% -5.5% -1.8% 0.0% -5.6% -0.9% -3.9% -3.9% -2.2% -2.7% 2.1% 1.8% -1.7% 1.8% -3.6% -2.7% -3.4% YTD -1.3% -1.1% -1.6% -0.9% -0.3% -1.6% 0.1% -1.2% -1.0% -0.7% -0.9% 0.6% 0.4% -1.0% 2.2% -1.1% -0.8% -1.0% Annual -15.0% -10.8% -6.4% 6.2% 2.9% -9.4% 4.5% -7.7% -5.7% -3.5% -1.8% 15.7% 4.8% 0.0% 3.0% -9.5% -2.8% -7.8% Total return -13.6% -8.3% -2.9% 9.4% 7.4% -5.8% 10.3% -4.7% -2.5% -0.3% 2.1% 21.5% 11.0% 2.9% 11.2% -6.8% 0.9% -5.0% Gross yield 2.9% 2.9% 4.1% 3.8% 4.6% 4.1% 5.8% 3.8% 4.1% 3.7% 4.9% 5.1% 6.2% 4.5% 6.8% 3.4% 4.5% 3.7% Median value $1,205,618 $900,107 $773,509 $696,718 $585,326 $713,061 $588,623 $951,054 $710,925 $598,232 $555,108 $362,037 $439,219 $527,886 $458,262 $849,666 $595,407 $755,040 Units Month -1.2% -1.1% -0.2% -0.1% -0.4% -2.0% -0.5% -0.4% -0.7% -0.9% -0.6% 0.3% 1.9% -1.4% na -1.0% -0.7% -0.9% Quarter -3.2% -2.1% -1.2% 0.7% -1.2% -4.9% 0.5% -1.7% -2.6% -2.0% -2.1% 5.8% 4.0% -0.4% na -2.4% -2.1% -2.4% YTD -1.2% -1.1% -0.2% -0.1% -0.4% -2.0% -0.5% -0.4% -0.7% -0.9% -0.6% 0.3% 1.9% -1.4% na -1.0% -0.7% -0.9% Annual -10.4% -5.5% 5.0% 12.2% 0.8% -10.1% 2.1% 0.9% -2.0% -3.1% 2.5% 8.2% 7.5% -4.5% na -6.3% 0.3% -5.3% Total return -7.4% -2.0% 10.2% 17.8% 6.5% -6.2% 9.1% 5.9% 2.0% 1.8% 8.0% 20.0% 16.2% 0.5% na -2.8% 5.4% -1.5% Gross yield 4.0% 4.3% 5.3% 5.1% 6.1% 4.8% 7.2% 5.1% 4.5% 4.5% 5.3% 6.1% 8.9% 5.0% na 4.4% 5.0% 4.5% Median value $768,999 $584,038 $489,769 $438,046 $406,289 $521,001 $377,003 $600,970 $561,415 $405,084 $538,040 $261,250 $279,549 $384,459 na $608,121 $499,899 $587,360 CoreLogic Home Value Index Released 1 February 2023
- 6. Media enquiries: media@corelogic.com.au Hedonic Home Value Index Top 10 Capital city SA3’s with highest 12-month value growth - Dwellings Rank SA3 Name SA4 Name Median Value Annual change Greater Sydney 1 Fairfield Sydney - South West $912,324 -2.0% 2 Campbelltown Sydney - Outer South West $766,032 -5.6% 3 Wollondilly Sydney - Outer South West $931,234 -6.0% 4 Camden Sydney - Outer South West $940,762 -7.5% 5 Bringelly - Green Valley Sydney - South West $976,559 -7.9% 6 Mount Druitt Sydney - Blacktown $694,063 -8.1% 7 Liverpool Sydney - South West $891,460 -8.3% 8 Auburn Sydney - Parramatta $713,754 -8.5% 9 St Marys Sydney - Outer West and Blue Mountains $763,104 -8.5% 10 Blacktown - North Sydney - Blacktown $1,101,555 -9.3% Greater Melbourne 1 Melbourne City Melbourne - Inner $520,002 6.5% 2 Wyndham Melbourne - West $652,682 -2.1% 3 Melton - Bacchus Marsh Melbourne - West $617,255 -3.5% 4 Casey - South Melbourne - South East $717,339 -5.5% 5 Brimbank Melbourne - West $650,147 -6.0% 6 Casey - North Melbourne - South East $767,022 -6.0% 7 Cardinia Melbourne - South East $694,296 -6.1% 8 Dandenong Melbourne - South East $698,415 -6.3% 9 Tullamarine - Broadmeadows Melbourne - North West $619,982 -6.6% 10 Sunbury Melbourne - North West $622,264 -6.7% Greater Brisbane 1 Ipswich Hinterland Ipswich $540,518 9.5% 2 Beaudesert Logan - Beaudesert $511,243 8.7% 3 Jimboomba Logan - Beaudesert $823,615 6.9% 4 Springfield - Redbank Ipswich $559,228 4.7% 5 Caboolture Hinterland Moreton Bay - North $726,712 4.4% 6 Ipswich Inner Ipswich $489,818 3.7% 7 Caboolture Moreton Bay - North $579,856 3.7% 8 Beenleigh Logan - Beaudesert $538,004 3.2% 9 Forest Lake - Oxley Ipswich $578,688 1.7% 10 Browns Plains Logan - Beaudesert $583,387 0.7% Greater Adelaide 1 Playford Adelaide - North $411,532 19.6% 2 Gawler - Two Wells Adelaide - North $506,991 14.7% 3 Salisbury Adelaide - North $509,059 13.0% 4 Onkaparinga Adelaide - South $600,857 11.9% 5 Tea Tree Gully Adelaide - North $626,677 10.9% 6 Holdfast Bay Adelaide - South $743,426 10.6% 7 Port Adelaide - East Adelaide - North $669,643 10.4% 8 Port Adelaide - West Adelaide - West $616,134 8.6% 9 Adelaide Hills Adelaide - Central and Hills $748,941 7.7% 10 Campbelltown Adelaide - Central and Hills $785,593 5.9% Rank SA3 Name SA4 Name Median Value Annual change Greater Perth 1 Kwinana Perth - South West $425,326 11.7% 2 Rockingham Perth - South West $485,951 8.6% 3 Mandurah Mandurah $487,343 8.2% 4 Armadale Perth - South East $451,981 6.5% 5 Serpentine - Jarrahdale Perth - South East $516,711 6.1% 6 Gosnells Perth - South East $467,926 6.0% 7 Wanneroo Perth - North West $519,805 5.6% 8 Swan Perth - North East $503,250 4.3% 9 Mundaring Perth - North East $573,675 3.0% 10 Belmont - Victoria Park Perth - South East $548,245 2.7% Greater Hobart 1 Brighton Hobart $522,926 -4.1% 2 Hobart - North East Hobart $719,614 -5.2% 3 Sorell - Dodges Ferry Hobart $601,374 -7.3% 4 Hobart - South and West Hobart $777,122 -7.4% 5 Hobart - North West Hobart $562,770 -10.3% 6 Hobart Inner Hobart $829,300 -15.2% Greater Darwin 1 Darwin Suburbs Darwin $516,118 5.2% 2 Palmerston Darwin $475,581 4.8% 3 Darwin City Darwin $473,602 1.9% 4 Litchfield Darwin $648,962 1.0% ACT 1 Molonglo Australian Capital Territory $714,882 -0.5% 2 South Canberra Australian Capital Territory $830,429 -3.3% 3 Gungahlin Australian Capital Territory $903,393 -4.2% 4 Belconnen Australian Capital Territory $815,887 -4.9% 5 Tuggeranong Australian Capital Territory $804,816 -6.6% 6 Woden Valley Australian Capital Territory $1,067,905 -7.3% 7 Weston Creek Australian Capital Territory $911,805 -8.1% 8 North Canberra Australian Capital Territory $790,694 -9.0% Data source: CoreLogic About the data Median values refers to the middle of valuations observed in the region Growth rates are based on changes in the CoreLogic Home Value index, which take into account value changes across the market Only metrics with a minimum of 20 sales observations and a low standard error on the median valuation have been included Data is at January 2023 CoreLogic Home Value Index Released 1 February 2023
- 7. Media enquiries: media@corelogic.com.au Hedonic Home Value Index Top 10 regional SA3’s with highest 12-month value growth - Dwellings Rank SA3 Name SA4 Name Median Value Annual change Regional NSW 1 Upper Hunter Hunter Valley exc Newcastle $412,806 12.9% 2 Inverell - Tenterfield New England and North West $325,292 12.4% 3 Tamworth - Gunnedah New England and North West $414,638 12.2% 4 Armidale New England and North West $457,144 11.3% 5 Wagga Wagga Riverina $446,555 11.0% 6 Tumut - Tumbarumba Riverina $353,938 10.1% 7 Griffith - Murrumbidgee (West) Riverina $421,314 10.0% 8 Lower Murray Murray $278,984 10.0% 9 Lachlan Valley Central West $350,959 7.2% 10 Upper Murray exc. Albury Murray $394,549 6.7% Regional VIC 1 Moira Shepparton $440,019 7.0% 2 Wangaratta - Benalla Hume $471,002 6.8% 3 Heathcote - Castlemaine - Kyneton Bendigo $786,981 4.7% 4 Campaspe Shepparton $441,652 3.8% 5 Shepparton Shepparton $448,774 3.4% 6 Glenelg - Southern Grampians Warrnambool and South West $385,019 3.1% 7 Colac - Corangamite Warrnambool and South West $479,736 2.3% 8 Mildura North West $402,891 1.7% 9 Gippsland - East Latrobe - Gippsland $540,444 1.5% 10 Wellington Latrobe - Gippsland $416,564 1.1% Regional QLD 1 Burnett Wide Bay $322,858 15.2% 2 Granite Belt Darling Downs - Maranoa $379,454 13.7% 3 Darling Downs - East Darling Downs - Maranoa $320,818 11.1% 4 Bundaberg Wide Bay $451,289 10.5% 5 Toowoomba Toowoomba $522,885 8.4% 6 Bowen Basin - North Mackay - Isaac - Whitsunday $268,706 7.4% 7 Rockhampton Central Queensland $400,699 7.1% 8 Charters Towers - Ayr - Ingham Townsville $229,159 6.4% 9 Maryborough Wide Bay $409,671 5.9% 10 Tablelands (East) - Kuranda Cairns $433,018 5.5% Regional SA 1 Barossa Barossa - Yorke - Mid North $497,547 19.5% 2 Murray and Mallee South Australia - South East $330,549 17.6% 3 Limestone Coast South Australia - South East $349,700 15.7% 4 Fleurieu - Kangaroo Island South Australia - South East $580,445 14.5% 5 Yorke Peninsula Barossa - Yorke - Mid North $359,463 12.5% 6 Eyre Peninsula and South West South Australia - Outback $295,571 10.7% Data source: CoreLogic About the data Median values refers to the middle of valuations observed in the region Growth rates are based on changes in the CoreLogic Home Value index, which take into account value changes across the market Only metrics with a minimum of 20 sales observations and a low standard error on the median valuation have been included Data is at January 2023 Rank SA3 Name SA4 Name Median Value Annual change Regional WA 1 Wheat Belt - North Western Australia - Wheat Belt $316,607 10.5% 2 Bunbury Bunbury $437,940 8.4% 3 Gascoyne Western Australia - Outback (South) $344,972 6.9% 4 Mid West Western Australia - Outback (South) $327,513 6.0% 5 Albany Western Australia - Wheat Belt $452,834 5.6% 6 Manjimup Bunbury $393,067 5.6% 7 East Pilbara Western Australia - Outback (North) $366,512 4.7% 8 West Pilbara Western Australia - Outback (North) $505,818 3.0% 9 Augusta - Margaret River - Busselton Bunbury $677,998 1.6% 10 Goldfields Western Australia - Outback (South) $287,473 1.1% Regional TAS 1 Burnie - Ulverstone West and North West $449,041 4.7% 2 North East Launceston and North East $467,559 3.3% 3 South East Coast South East $623,489 2.5% 4 Devonport West and North West $471,206 1.3% 5 Launceston Launceston and North East $534,361 -5.3% CoreLogic Home Value Index Released 1 February 2023
- 8. Media enquiries: media@corelogic.com.au Hedonic Home Value Index In compiling this publication, RP Data Pty Ltd trading as CoreLogic has relied upon information supplied by a number of external sources. CoreLogic does not warrant its accuracy or completeness and to the full extent allowed by law excludes liability in contract, tort or otherwise, for any loss or damage sustained by subscribers, or by any other person or body corporate arising from or in connection with the supply or use of the whole or any part of the information in this publication through any cause whatsoever and limits any liability it may have to the amount paid to CoreLogic for the supply of such information. Queensland Data Based on or contains data provided by the State of Queensland (Department of Resources) 2023. In consideration of the State permitting use of this data you acknowledge and agree that the State gives no warranty in relation to the data (including accuracy, reliability, completeness, currency or suitability) and accepts no liability (including without limitation, liability in negligence) for any loss, damage or costs (including consequential damage) relating to any use of the data. Data must not be used for direct marketing or be used in breach of the privacy laws. South Australian Data This information is based on data supplied by the South Australian Government and is published by permission. © 2023 Copyright in the supplied data belongs to the South Australian Government and the South Australian Government does not accept any responsibility for the accuracy, completeness or suitability for any purpose of the published information or the underlying data. New South Wales Data Contains property sales information provided under licence from the Land and Property Information (“LPI”). RP Data Pty Ltd trading as CoreLogic is authorised as a Property Sales Information provider by the LPI. Victorian Data The State of Victoria owns the copyright in the property sales data and reproduction of that data in any way without the consent of the State of Victoria will constitute a breach of the Copyright Act 1968 (Cth). The State of Victoria does not warrant the accuracy or completeness of the licensed material and any person using or relying upon such information does so on the basis that the State of Victoria accepts no responsibility or liability whatsoever for any errors, faults, defects or omissions in the information supplied. Western Australian Data Based on information provided by and with the permission of the Western Australian Land Information Authority (2023) trading as Landgate. Australian Capital Territory Data The Territory Data is the property of the Australian Capital Territory. No part of it may in any form or by any means (electronic, mechanical, microcopying, photocopying, recording or otherwise) be reproduced, stored in a retrieval system or transmitted without prior written permission. Enquiries should be directed to: Director, Customer Services ACT Planning and Land Authority GPO Box 1908 Canberra ACT 2601. Tasmanian Data This product incorporates data that is copyright owned by the Crown in Right of Tasmania. The data has been used in the product with the permission of the Crown in Right of Tasmania. The Crown in Right of Tasmania and its employees and agents: a) give no warranty regarding the data's accuracy, completeness, currency or suitability for any particular purpose; and b) do not accept liability howsoever arising, including but not limited to negligence for any loss resulting from the use of or reliance upon the data. Base data from the LIST © State of Tasmania http://www.thelist.tas.gov.au Disclaimers CoreLogic Home Value Index Released 1 February 2023 © 2023 CoreLogic No unauthorized use or disclosure. All rights reserved. CORELOGIC and the CoreLogic logo are New Zealand and Australian trademarks of CoreLogic, Inc. and/or its subsidiaries.
- 9. Media enquiries: media@corelogic.com.au Methodology The CoreLogic Hedonic Home Value Index is calculated using a hedonic regression methodology that addresses the issue of compositional bias associated with median price and other measures. In simple terms, the index is calculated using recent sales data combined with information about the attributes of individual properties such as the number of bedrooms and bathrooms, land area and geographical context of the dwelling. By separating each property into its various formational and locational attributes, observed sales values for each property can be distinguished between those attributed to the property’s attributes and those resulting from changes in the underlying residential property market. Additionally, by understanding the value associated with each attribute of a given property, this methodology can be used to estimate the value of dwellings with known characteristics for which there is no recent sales price by observing the characteristics and sales prices of other dwellings which have recently transacted. It then follows that changes in the market value of the entire residential property stock can be accurately tracked through time. The detailed methodological information can be found at: www.corelogic.com.au/research/rp-data-corelogic-home-value- index-methodology/ CoreLogic is able to produce a consistently accurate and robust Hedonic Index due to its extensive property related database, which includes transaction data for every home sale within every state and territory. CoreLogic augments this data with recent sales advice from real estate industry professionals, listings information and attribute data collected from a variety of sources. CoreLogic is the largest independent provider of property information, analytics and property-related risk management services in Australia and New Zealand. * The median value is the middleestimated value of all residential propertiesderived through the hedonic regression methodologythat underlies the CoreLogicHedonic Home Value Index. Hedonic Home Value Index CoreLogic Home Value Index Released 1 February 2023