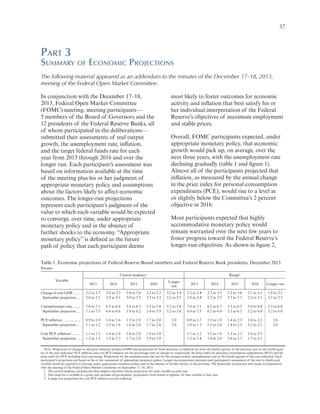
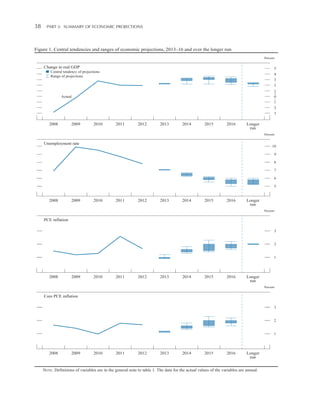
The document is the February 2014 Monetary Policy Report from the Federal Reserve. It discusses recent economic and financial developments. Key points:
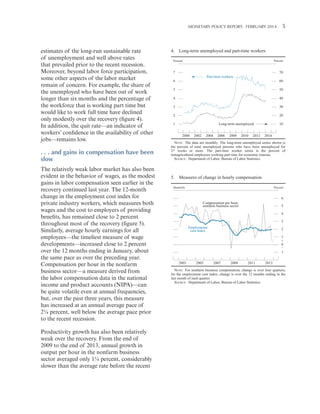
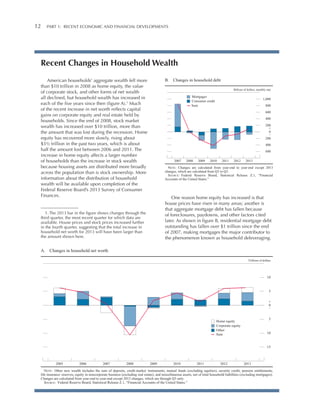
- The labor market continued improving in the second half of 2013 and early 2014, with employment gains averaging 175,000 per month and unemployment falling to 6.6%. However, unemployment remains above sustainable levels.
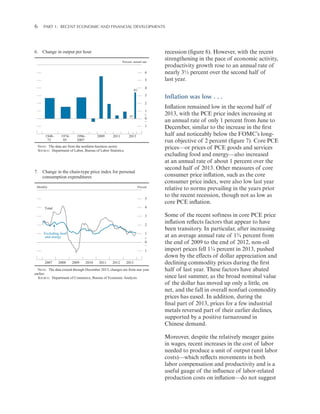
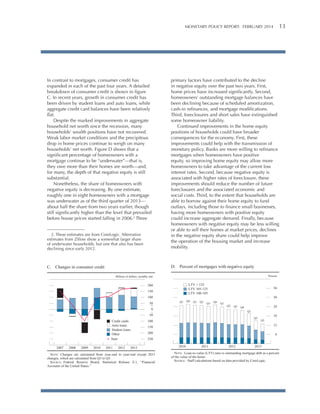
- Inflation remained low at 1% over the last half of 2013, below the Fed's 2% target, but some factors were transitory. Inflation expectations have remained steady.
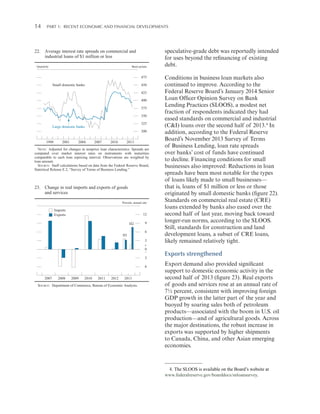
- Economic growth picked up in the second half of 2013 to an annual rate of 3.75%, as fiscal policy restraint lessened and financial conditions remained supportive.


![Awareness of digital currency[1] (1).pptx](https://cdn.slidesharecdn.com/ss_thumbnails/awarenessofdigitalcurrency11-260125155504-b1badee4-thumbnail.jpg?width=640&height=640&fit=bounds)


