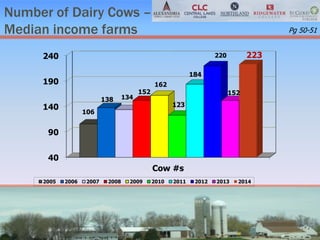
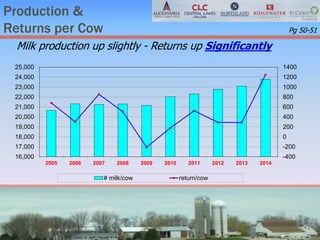
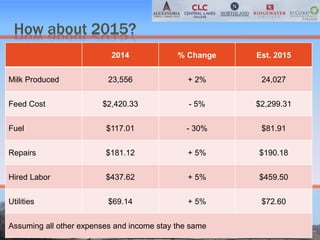
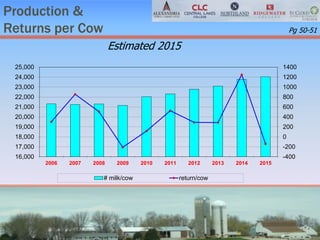
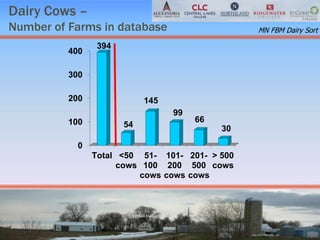
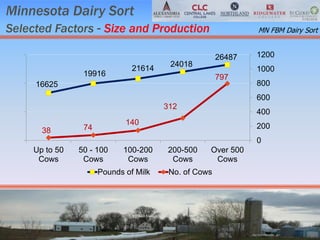
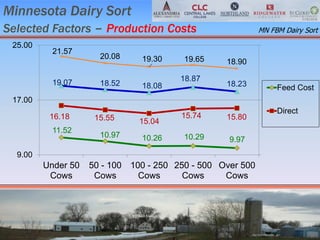
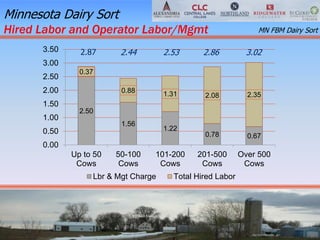
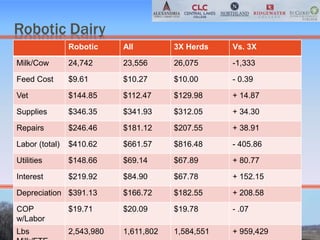
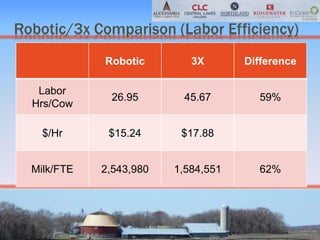
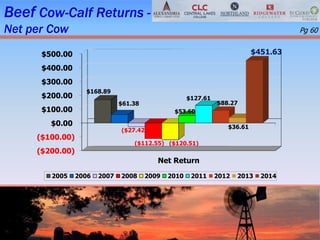
SlideShare a Scribd company logo
Livestock Enterprise Information
 Dairy
– By Profitability
– By Herd Size
 Beef
 Hogs
Statewide Data
Livestock Enterprise Information
 Dairy data on slides prior to
“Dairy by herd size” does
not include Organic Production
Number of Dairy Cows
Average Farm
20
70
120
170
220
Cow #s
117 122 128
140 134 140
160
170 179
184
2005 2006 2007 2008 2009 2010 2011 2012 2013 2014
The average number of dairy cows up again in 2014
Pg 50-51
Number of Dairy Cows –
Median income farms
40
90
140
190
240
Cow #s
106
138 134
152
162
123
184
220
152
223
2005 2006 2007 2008 2009 2010 2011 2012 2013 2014
Pg 50-51
Production &
Returns per Cow
-400
-200
0
200
400
600
800
1000
1200
1400
16,000
17,000
18,000
19,000
20,000
21,000
22,000
23,000
24,000
25,000
2005 2006 2007 2008 2009 2010 2011 2012 2013 2014
# milk/cow return/cow
Milk production up slightly - Returns up Significantly
Pg 50-51
Milk Price less Feed Cost
8.15
7.1
9.93 9.62
7.31
9.9
7.44 7.49
10.56 10.22
7.99
11.88
11.26
6.21
9.02
11.01
9.35
9.93
14.15
0
2
4
6
8
10
12
14
16
1996 1997 1998 1999 2000 2001 2002 2003 2004 2005 2006 2007 2008 2009 2010 2011 2012 2013 2014
DollarsperCWT
Returns UP!!!
Pg 50-51
Dairy Cows –
Costs and Gross Margin per CWT
Feed
Direct
Dir & Ovhd
Gross Margin
$0.00
$7.00
$14.00
$21.00
$28.00
Average Mid 40-60 High
$10.22 $10.34 $9.58
$15.57 $16.23
$13.67
$18.38 $18.44 $17.45
$23.64 $23.39
$24.61
Net Returns: $5.26 $4.95 $7.16
Pg 50
Dairy Cows – 3-yr view
Costs and Gross Margin per CWT
Feed
Direct
Dir & Ovhd
Gross Margin
$0.00
$7.00
$14.00
$21.00
$28.00
2012 2013 2014
$10.19 $10.37 $10.22
$14.86 $15.18 $15.57
$17.44 $17.81 $18.38
$18.72 $19.06
$23.64
Net Returns: $1.28 $1.25 $5.26
Pg 50
Dairy Cows –
Returns per Cow
Net: Dir, Ovhd, Lab & Mgt
Net: Dir & Ovhd
Net: Ovhd
Gross Margin
$0
$2,000
$4,000
$6,000
$8,000
Average Mid 40-60 High
$1,026 $1,051
$1,519
$1,249 $1,217
$1,800
$1,918 $1,761
$2,748
$5,618 $5,752 $6,187
Pg 51
Dairy Cows – 3-yr view
Returns per Cow
Net: Dir, Ovhd, Lab & Mgt
Net: Dir & Ovhd
Net: Ovhd
Gross Margin
$0
$2,000
$4,000
$6,000
2012 2013 2014$89
$90
$1,026
$290 $287
$1,249
$879 $895
$1,918
$4,263 $4,400
$5,618
Pg 65
How About
2015?
How about 2015?
2014 % Change Est. 2015
Milk Produced 23,556 + 2% 24,027
Feed Cost $2,420.33 - 5% $2,299.31
Fuel $117.01 - 30% $81.91
Repairs $181.12 + 5% $190.18
Hired Labor $437.62 + 5% $459.50
Utilities $69.14 + 5% $72.60
Assuming all other expenses and income stay the same
2015 Continued
2014 2015
Average Class III $22.34 $16.34*
Average Basis $2.14 $2.14
Average Pay Price $24.48 $18.48
Net Change - $6.00
Cost of Production $19.97 $19.17
Milk Price minus Feed Cost $14.14 $8.91
Net Return/Cow $1,026 - $141.74
* Based on April 2015 Dunn Dairy Outlook Report
Production &
Returns per Cow
-400
-200
0
200
400
600
800
1000
1200
1400
16,000
17,000
18,000
19,000
20,000
21,000
22,000
23,000
24,000
25,000
2006 2007 2008 2009 2010 2011 2012 2013 2014 2015
# milk/cow return/cow
Estimated 2015
Pg 50-51
Milk Price less Feed Cost
7.1
9.93 9.62
7.31
9.9
7.44 7.49
10.56 10.22
7.99
11.88
11.26
6.21
9.02
11.01
9.36
9.93
14.15
8.91
0
2
4
6
8
10
12
14
16
1997 1998 1999 2000 2001 2002 2003 2004 2005 2006 2007 2008 2009 2010 2011 2012 2013 2014 2015
DollarsperCWT
Estimated 2015
Pg 50-51
Dairy Cows - MN Dairy Sort
Data by Size of Herd
-- All Dairy Herds,
including Organic --
Dairy Cows –
Number of Farms in database
0
100
200
300
400
Total <50
cows
51-
100
cows
101-
200
cows
201-
500
cows
> 500
cows
394
54
145
99
66
30
MN FBM Dairy Sort
0%
10%
20%
30%
40%
50%
60%
70%
80%
90%
100%
Total <50
cows
51-100
cows
101-
200
cows
201-
500
cows
> 500
cows
396
14%
37%
25%
17%
8%
0%
5%
10%
15%
20%
25%
30%
35%
40%
45%
Total <50
cows
51-
100
cows
101-
200
cows
201-
500
cows
> 500
cows
12%
5%
10%
29% 31%
44%
Dairy Cows –
Number of Herds and Percent of MN Farms
Some herd data provided by the Minn Department of Ag.
MN FBM Dairy Sort
0%
10%
20%
30%
40%
50%
Total <50
cows
51-100
cows
101-200
cows
201-500
cows
> 500
cows
2012 10% 3% 10% 28% 33% 35%
2013 11% 4% 9% 31% 29% 35%
2013 12% 5% 10% 29% 31% 44%
12%
5%
10%
29% 31%
44%
2012
2013
2013
Dairy Cows –
Farms as percent of all MN herds MN FBM Dairy Sort
Minnesota Dairy Sort
Selected Factors - Size and Production
16625
19916
21614
24018
26487
38 74
140
312
797
0
200
400
600
800
1000
1200
Up to 50
Cows
50 - 100
Cows
100-200
Cows
200-500
Cows
Over 500
Cows
Pounds of Milk No. of Cows
MN FBM Dairy Sort
Minnesota Dairy Sort
Selected Factors - Cost and Price
Feed
Dir & Ovhd
Dir, Ovhd, & Lab
Gross Margin
0.00
7.00
14.00
21.00
28.00
<50 Cows 51-100 101-200 201-500 >500 Cows
11.52 10.97 10.26 10.29 9.97
19.07 18.52 18.08 18.87 18.23
21.57
20.08 19.30 19.65 18.90
23.04
23.87 23.65 23.86 23.57
Ave Price = $24.43 Ave Cost w Labor = $19.40
MN FBM Dairy Sort
11.52
10.97 10.26 10.29 9.97
16.18 15.55 15.04
15.74 15.80
19.07 18.52 18.08
18.87
18.23
21.57
20.08 19.30 19.65 18.90
9.00
17.00
25.00
Under 50
Cows
50 - 100
Cows
100 - 250
Cows
250 - 500
Cows
Over 500
Cows
Feed Cost
Direct
Minnesota Dairy Sort
Selected Factors – Production Costs MN FBM Dairy Sort
Minnesota Dairy Sort
Hired Labor and Operator Labor/Mgmt MN FBM Dairy Sort
2.50
1.56
1.22
0.78 0.67
0.37
0.88 1.31 2.08 2.35
0.00
0.50
1.00
1.50
2.00
2.50
3.00
3.50
Up to 50
Cows
50-100
Cows
101-200
Cows
201-500
Cows
Over 500
Cows
Lbr & Mgt Charge Total Hired Labor
3.022.44 2.862.532.87
Dairy Sorts Expanded…
Sort - Includes All Robotic Dairy
Non-Robotic
Traditional
Non-Robotic
3X Milking Organic
Dairy
Initiatives
Sort - Excludes NA
All non-
robotic herds
Organic, Org.
Transition, 3X
Milking, Rot.
Grazing,
Robotics
Organic, Org.
Transition,
Rot. Grazing,
Robotics, non-
3X milk herds
All non-
organic herds
All non-Dairy
Initiative
herds
Number of Farms 390 9 327 33 15 96
Number of Cows 180.4 179.6 151.0 558.5 87.7 158.6
Milk Produced per Cow 23,556 24,742 22,923 26,075 13,041 22,518
Product/Animals Sold $5,716.23 $5,871.18 $5,582.60 $6,229.11 $3,978.38 $5,488.87
Gross Margin $5,581.78 $5,749.94 $5,423.43 $6,159.86 $3,807.30 $5,368.08
Feed Cost per Cow $2,420.33 $2,378.86 $2,369.73 $2,607.94 $1,967.27 $2,308.10
Veterinary $112.47 $144.85 $107.21 $129.98 $35.24 $105.77
BST $48.82 $36.56 $40.73 $75.96 $0.00 $34.60
Repairs $181.12 $246.46 $162.05 $207.55 $161.25 $177.79
Hired Labor - direct $258.84 $106.78 $190.65 $471.20 $88.78 $300.13
Hired Labor - Ovhd $178.78 $97.24 $193.33 $152.10 $140.14 $71.50
Interest $84.90 $219.92 $87.43 $67.78 $76.46 $78.48
Depreciation $168.16 $391.13 $155.93 $182.55 $88.58 $155.29
Total Dir &Ovhd Cost $4,345.28 $4,506.81 $4,194.56 $4,850.70 $3,176.84 $4,098.57
Net Return $1,236.50 $1,243.13 $1,228.87 $1,309.16 $630.46 $1,269.51
Cost of Prod - O&D $18.45 $18.22 $18.30 $18.60 $24.36 $18.20
Culling Percentage 30.3 27.8 29.1 33.7 28.9 29.8
Turnover Rate 37.4 36.1 36.5 40.2 33.6 36.8
Feed Cost per CWT $10.27 $9.61 $10.34 $10.00 $15.09 $10.25
Dairy Cows - Additional Sorts
Robotic Dairy
Robotic All 3X Herds Vs. 3X
Milk/Cow 24,742 23,556 26,075 -1,333
Feed Cost $9.61 $10.27 $10.00 - 0.39
Vet $144.85 $112.47 $129.98 + 14.87
Supplies $346.35 $341.93 $312.05 + 34.30
Repairs $246.46 $181.12 $207.55 + 38.91
Labor (total) $410.62 $661.57 $816.48 - 405.86
Utilities $148.66 $69.14 $67.89 + 80.77
Interest $219.92 $84.90 $67.78 + 152.15
Depreciation $391.13 $166.72 $182.55 + 208.58
COP
w/Labor
$19.71 $20.09 $19.78 - .07
Lbs 2,543,980 1,611,802 1,584,551 + 959,429
Robotic/3x Comparison (2)
Robotic 3X Difference
Labor $410.62 $816.48 - 405.86
Supplies,
Repairs,
Utilities,
Interest,
Depreciation
$1,352.52 $837.82 + 514.70
Total $1,753.14 $1,654.30 + 108.84
Robotic/3x Comparison (Labor Efficiency)
Robotic 3X Difference
Labor
Hrs/Cow
26.95 45.67 59%
$/Hr $15.24 $17.88
Milk/FTE 2,543,980 1,584,551 62%
3X vs. Traditional
Traditional 3X Herds Difference
Milk/Cow 22,923 26,075 + 3,152
Hrs/Cow 39.23 45.87 + 6.64
Labor (total) $617.80 $816.48 + 198.68
Labor
Cost/CWT
Additional
Milk
$15.86
Lbs/FTE 1,627,611 1,584,511 - 43,100
Hrs/CWt .171 .176 - .005
Feed Cost $10.34 $10.00 - 0.34
COP $20.10 $19.78 - 0.32
Barn Style Comparisons
Tie-Stall Compost Free Stall Sand-Bedding
Milk/Cow 21,237 18,835 24,659 25,449
Hrs/Cow 44.13 33.18 42.76 45.78
Labor
(total)
$554.31 $524.56 $368.79 $740.03
Total
Costs/Co
w
$3,744.27 $3,961.58 $4,550.77 $4,578.25
Bedding $42.93 $187.03 $83.01 $89.56
Feed Cost 10.26 11.51 10.17 9.83
COP 19.67 $21.97 $19.88 $19.64
Net
Return
$1,039.88 $681.09 $1,083.16 $1,175.16
Bedding Comparisons (2)
0
5
10
15
20
25
Tie-Stall Compost FreeStall Sand
Bedding
Feed
Labor
Overhead
Direct
BST vs. Non-BST
BST Non-BST Difference
Milk Produced 25,581 23,280 + 2,301
Feed Costs $10.16 $10.26 - 0.10
Total Direct Costs $16.21 $15.42 + 0.79
Overhead Costs $2.71 $2.80 - 0.09
BST Cost $0.42 $0 + 0.42
BST
Cost/Additional
Milk
$4.65
Total COP $19.95 $20.03 - 0.08
Dairy Finishing –
Net Return & Price per Cwt up
82.40
100.04
110.26 113.17
130.69
8.98 12.39 7.05 3.07
48.66
2010 2011 2012 2013 2014
Price Recv'd/Cwt Net Return/Cwt
Pg 57
Beef Cow-Calf Returns -
Net per Cow
($200.00)
($100.00)
$0.00
$100.00
$200.00
$300.00
$400.00
$500.00
Net Return
$168.89
$61.38
($27.42)
($112.55) ($120.51)
$53.60
$127.61
$88.27
$36.61
$451.63
2005 2006 2007 2008 2009 2010 2011 2012 2013 2014
Pg 60
Beef Cow/Calf Cost of Production Trends
0
20
40
60
80
100
120
140
160
180
2009 2010 2011 2012 2013 2014
Cost of Production per CWT
Produced
COP
Beef Cow-Calf –
Costs and Returns of Production per Cow
Feed
Direct
Dir & Ovhd
Gross Margin
$0
$450
$900
$1,350
$1,800
Average Mid 40-60 High
$508
$470 $482
$685 $618 $639
$844
$737 $787
$1,295
$1,183
$1,591
Net Returns: $451 $447 $804
Pg 60
Beef Cow-Calf –
Costs and Returns of Production per Cow
Feed
Direct
Dir & Ovhd
Gross Margin
$0
$450
$900
$1,350
$1,800
Average Up to 50 50-100 100-200 200-500
$508 $497 $529 $548
$397
$685 $676 $700 $725
$581
$844 $882 $870 $866
$696
$1,295 $1,217 $1,301 $1,313 $1,340
Net Returns: $451 $335 $431 $447 $644
Pg 61
Beef Finishing Returns -
Net per CWT
($10.00)
$0.00
$10.00
$20.00
$30.00
$40.00
$50.00
$60.00
Net Return
$5.50
($1.63)
($0.36) ($3.54)
$0.23
$14.38
$22.10
$5.21
$15.35
$57.76
2005 2006 2007 2008 2009 2010 2011 2012 2013 2014
Pg 59
Farrow to Finish Hogs –
Net Return & Price per Cwt
54.03
71.61 69.43
70.52
104.32
2.90
7.62
2.28
8.42
32.42
2010 2011 2012 2013 2014
Price Recv'd/Cwt Net Return/Cwt
Not in Report
Finish Feeder Pigs –
Net Return & Price per Pig
85.74 85.82 89.60
98.79
63.84 63.89 66.84
73.61
15.07
2.86 3.13
15.03
2011 2012 2013 2014
Price Recv'd/Cwt Carcass Price/CWT live Wgt
Net Return/Cwt
Pg 62
Weaning to Finish Hogs–Grower
What makes up the Gross Margin?
8.08
8.46
12.07
11.23
5.66
2.38
7.08 4.26 3.68
Average Mid 40-60% High 20%
Net Return
Direct Exp
Overhead Exp
Pg 63
Note: Sort for returns is based on Return to Overhead
Gross Margin: $15.69 $18.39 $18.13
.
In closing…
.
In closing…
Diligence in the mother of good luck.
Thank you for listening to a review
of this year’s Farm Business
Management Annual Report
information.

More Related Content

What's hot

Shopping list yarns version 001
Shopping list yarns version 001Shopping list yarns version 001
Shopping list yarns version 001
Unifi Us
 
Financials for a Restaurant
Financials for a RestaurantFinancials for a Restaurant
Financials for a RestaurantBabar Malik
 
Elasticity
ElasticityElasticity
Elasticity
Gale Pooley
 
Final Team Analysis - Linkedin
Final Team Analysis - LinkedinFinal Team Analysis - Linkedin
Final Team Analysis - LinkedinEunice Fei Jin Shi
 
Coco Palm's Christmas Lunch Menu 2016
Coco Palm's Christmas Lunch Menu 2016Coco Palm's Christmas Lunch Menu 2016
Coco Palm's Christmas Lunch Menu 2016
Coco Palm Hotel
 
Student Managed Farm Final Sheep Presentation 2012
Student Managed Farm Final Sheep Presentation 2012 Student Managed Farm Final Sheep Presentation 2012
Student Managed Farm Final Sheep Presentation 2012 Lakeland College
 

What's hot (10)

Shopping list yarns version 001
Shopping list yarns version 001Shopping list yarns version 001
Shopping list yarns version 001
 
Financials for a Restaurant
Financials for a RestaurantFinancials for a Restaurant
Financials for a Restaurant
 
Elasticity
ElasticityElasticity
Elasticity
 
Elasticity
ElasticityElasticity
Elasticity
 
PORTOFOLIO
PORTOFOLIOPORTOFOLIO
PORTOFOLIO
 
meat_money
meat_moneymeat_money
meat_money
 
Chapter v
Chapter vChapter v
Chapter v
 
Final Team Analysis - Linkedin
Final Team Analysis - LinkedinFinal Team Analysis - Linkedin
Final Team Analysis - Linkedin
 
Coco Palm's Christmas Lunch Menu 2016
Coco Palm's Christmas Lunch Menu 2016Coco Palm's Christmas Lunch Menu 2016
Coco Palm's Christmas Lunch Menu 2016
 
Student Managed Farm Final Sheep Presentation 2012
Student Managed Farm Final Sheep Presentation 2012 Student Managed Farm Final Sheep Presentation 2012
Student Managed Farm Final Sheep Presentation 2012
 

Viewers also liked

Delivering Index-Based Livestock Insurance through ICT
Delivering Index-Based Livestock Insurance through ICTDelivering Index-Based Livestock Insurance through ICT
Delivering Index-Based Livestock Insurance through ICT
ILRI
 
Livestock and mobile technology
Livestock and mobile technologyLivestock and mobile technology
Livestock and mobile technology
ILRI
 
ICTs for better access to information/knowledge for Ethiopian livestock keepers
ICTs for better access to information/knowledge for Ethiopian livestock keepersICTs for better access to information/knowledge for Ethiopian livestock keepers
ICTs for better access to information/knowledge for Ethiopian livestock keepers
ILRI
 
Improving livestock market information flow and early warning systems for pas...
Improving livestock market information flow and early warning systems for pas...Improving livestock market information flow and early warning systems for pas...
Improving livestock market information flow and early warning systems for pas...
Technical Centre for Agricultural and Rural Cooperation ACP-EU (CTA)
 
Rapid livestock feed assessment tools to support intervention strategies: FE...
Rapid livestock feed assessment tools to support intervention strategies:  FE...Rapid livestock feed assessment tools to support intervention strategies:  FE...
Rapid livestock feed assessment tools to support intervention strategies: FE...
ILRI
 
mAgri Webinar: Exploring the Nokia Life Agriculture Service
mAgri Webinar: Exploring the Nokia Life Agriculture ServicemAgri Webinar: Exploring the Nokia Life Agriculture Service
mAgri Webinar: Exploring the Nokia Life Agriculture Service
GSMA Mobile for Development
 
Women and livestock: Why gender matters are big matters
Women and livestock: Why gender matters are big mattersWomen and livestock: Why gender matters are big matters
Women and livestock: Why gender matters are big matters
ILRI
 
Livestock Early Warning System: A Tool that Holds Promise for an Integrated N...
Livestock Early Warning System: A Tool that Holds Promise for an Integrated N...Livestock Early Warning System: A Tool that Holds Promise for an Integrated N...
Livestock Early Warning System: A Tool that Holds Promise for an Integrated N...
Global Livestock CRSP
 
Appropriate Farm Practices for Livestock and Poultry during Extended Dry Spell
Appropriate Farm Practices for Livestock and Poultry during Extended Dry SpellAppropriate Farm Practices for Livestock and Poultry during Extended Dry Spell
Appropriate Farm Practices for Livestock and Poultry during Extended Dry Spell
Perez Eric
 
Extensionstrategy livestockextension india final
Extensionstrategy livestockextension india finalExtensionstrategy livestockextension india final
Extensionstrategy livestockextension india final
Prakashkumar Rathod
 
Livestock market opportunities for the poor
Livestock market opportunities for the poorLivestock market opportunities for the poor
Livestock market opportunities for the poor
ILRI
 
Quality and safety of animal feed in india
Quality and safety of animal feed in indiaQuality and safety of animal feed in india
Quality and safety of animal feed in indiaVasu Chithiravelu
 
Role of livestock extension in the food security scenario of India- Dr.Subin ...
Role of livestock extension in the food security scenario of India- Dr.Subin ...Role of livestock extension in the food security scenario of India- Dr.Subin ...
Role of livestock extension in the food security scenario of India- Dr.Subin ...
KVASU
 
Ict as an important tool in rural development in context to Agriculture, e - ...
Ict as an important tool in rural development in context to Agriculture, e - ...Ict as an important tool in rural development in context to Agriculture, e - ...
Ict as an important tool in rural development in context to Agriculture, e - ...
Nischay Patel
 

Viewers also liked (14)

Delivering Index-Based Livestock Insurance through ICT
Delivering Index-Based Livestock Insurance through ICTDelivering Index-Based Livestock Insurance through ICT
Delivering Index-Based Livestock Insurance through ICT
 
Livestock and mobile technology
Livestock and mobile technologyLivestock and mobile technology
Livestock and mobile technology
 
ICTs for better access to information/knowledge for Ethiopian livestock keepers
ICTs for better access to information/knowledge for Ethiopian livestock keepersICTs for better access to information/knowledge for Ethiopian livestock keepers
ICTs for better access to information/knowledge for Ethiopian livestock keepers
 
Improving livestock market information flow and early warning systems for pas...
Improving livestock market information flow and early warning systems for pas...Improving livestock market information flow and early warning systems for pas...
Improving livestock market information flow and early warning systems for pas...
 
Rapid livestock feed assessment tools to support intervention strategies: FE...
Rapid livestock feed assessment tools to support intervention strategies:  FE...Rapid livestock feed assessment tools to support intervention strategies:  FE...
Rapid livestock feed assessment tools to support intervention strategies: FE...
 
mAgri Webinar: Exploring the Nokia Life Agriculture Service
mAgri Webinar: Exploring the Nokia Life Agriculture ServicemAgri Webinar: Exploring the Nokia Life Agriculture Service
mAgri Webinar: Exploring the Nokia Life Agriculture Service
 
Women and livestock: Why gender matters are big matters
Women and livestock: Why gender matters are big mattersWomen and livestock: Why gender matters are big matters
Women and livestock: Why gender matters are big matters
 
Livestock Early Warning System: A Tool that Holds Promise for an Integrated N...
Livestock Early Warning System: A Tool that Holds Promise for an Integrated N...Livestock Early Warning System: A Tool that Holds Promise for an Integrated N...
Livestock Early Warning System: A Tool that Holds Promise for an Integrated N...
 
Appropriate Farm Practices for Livestock and Poultry during Extended Dry Spell
Appropriate Farm Practices for Livestock and Poultry during Extended Dry SpellAppropriate Farm Practices for Livestock and Poultry during Extended Dry Spell
Appropriate Farm Practices for Livestock and Poultry during Extended Dry Spell
 
Extensionstrategy livestockextension india final
Extensionstrategy livestockextension india finalExtensionstrategy livestockextension india final
Extensionstrategy livestockextension india final
 
Livestock market opportunities for the poor
Livestock market opportunities for the poorLivestock market opportunities for the poor
Livestock market opportunities for the poor
 
Quality and safety of animal feed in india
Quality and safety of animal feed in indiaQuality and safety of animal feed in india
Quality and safety of animal feed in india
 
Role of livestock extension in the food security scenario of India- Dr.Subin ...
Role of livestock extension in the food security scenario of India- Dr.Subin ...Role of livestock extension in the food security scenario of India- Dr.Subin ...
Role of livestock extension in the food security scenario of India- Dr.Subin ...
 
Ict as an important tool in rural development in context to Agriculture, e - ...
Ict as an important tool in rural development in context to Agriculture, e - ...Ict as an important tool in rural development in context to Agriculture, e - ...
Ict as an important tool in rural development in context to Agriculture, e - ...
 

Similar to 2014 data show livestock data

Модель органической фермы. Роман Макухин
Модель органической фермы. Роман МакухинМодель органической фермы. Роман Макухин
Модель органической фермы. Роман Макухин
Зелена Школа
 
Student Managed Farm Crops Final Presentation 2012
Student Managed Farm Crops Final Presentation 2012Student Managed Farm Crops Final Presentation 2012
Student Managed Farm Crops Final Presentation 2012Lakeland College
 
Startup Financial Modeling
Startup Financial ModelingStartup Financial Modeling
Startup Financial Modeling
Bryan Hassin
 
10.3 2016 investor presentation pea
10.3 2016 investor presentation   pea10.3 2016 investor presentation   pea
10.3 2016 investor presentation pea
FalcoCorporate
 
Dr. Kyle Coble - Introduction: How Do We Define Wean Age
Dr. Kyle Coble - Introduction: How Do We Define Wean AgeDr. Kyle Coble - Introduction: How Do We Define Wean Age
Dr. Kyle Coble - Introduction: How Do We Define Wean Age
John Blue
 
Clinton Global Initiative Hult Prize Finalist Presentation - Harambee
Clinton Global Initiative Hult Prize Finalist Presentation - HarambeeClinton Global Initiative Hult Prize Finalist Presentation - Harambee
Clinton Global Initiative Hult Prize Finalist Presentation - Harambee
Big Fish Presentations
 
Make or Buy? Serving Great Products at an Affordable Price
Make or Buy? Serving Great Products at an Affordable PriceMake or Buy? Serving Great Products at an Affordable Price
Make or Buy? Serving Great Products at an Affordable Price
Profitable Hospitality
 
1. 2020 Commodity Outlook
1. 2020 Commodity Outlook1. 2020 Commodity Outlook
1. 2020 Commodity Outlook
EasternOntarioCropConference
 
360° Benchmarking for Pork Production
360° Benchmarking for Pork Production360° Benchmarking for Pork Production
360° Benchmarking for Pork Production
National Pork Board
 
AIA2019 - Rick Rasmussen - Startup Financials
AIA2019 - Rick Rasmussen - Startup FinancialsAIA2019 - Rick Rasmussen - Startup Financials
AIA2019 - Rick Rasmussen - Startup Financials
European Innovation Academy
 
Round 5Dec. 31, 2018 C58538AndrewsEugene EllisPhili.docx
Round 5Dec. 31, 2018 C58538AndrewsEugene EllisPhili.docxRound 5Dec. 31, 2018 C58538AndrewsEugene EllisPhili.docx
Round 5Dec. 31, 2018 C58538AndrewsEugene EllisPhili.docx
joellemurphey
 
Financial Forecasting
Financial ForecastingFinancial Forecasting
Financial Forecasting
JamariHodges1
 
January 2019 USPS® Rate Change Comparison Chart
January 2019 USPS® Rate Change Comparison ChartJanuary 2019 USPS® Rate Change Comparison Chart
January 2019 USPS® Rate Change Comparison Chart
Postal Advocate Inc.
 
Cost accounting brownies basket with cost sheet
Cost accounting brownies basket with cost sheetCost accounting brownies basket with cost sheet
Cost accounting brownies basket with cost sheet
Jasvinder Notra
 
Budget Variance Analysis PowerPoint Presentation Slides
Budget Variance Analysis PowerPoint Presentation SlidesBudget Variance Analysis PowerPoint Presentation Slides
Budget Variance Analysis PowerPoint Presentation Slides
SlideTeam
 
Trends in Global Food Market in Revenue Term..pptx
Trends in Global Food Market in Revenue Term..pptxTrends in Global Food Market in Revenue Term..pptx
Trends in Global Food Market in Revenue Term..pptx
Odisha University of Agriculture & Technology, Bhubaneswar.
 
T A X T A B L E A • T 1 - T 4T A X T A B L E B • T 5 - T 1.docx
T A X T A B L E A • T 1 - T 4T A X T A B L E B • T 5 - T 1.docxT A X T A B L E A • T 1 - T 4T A X T A B L E B • T 5 - T 1.docx
T A X T A B L E A • T 1 - T 4T A X T A B L E B • T 5 - T 1.docx
mattinsonjanel
 
Id intertech-preliminary-draft-public-land-mgmt-task-force-report-tables
Id intertech-preliminary-draft-public-land-mgmt-task-force-report-tablesId intertech-preliminary-draft-public-land-mgmt-task-force-report-tables
Id intertech-preliminary-draft-public-land-mgmt-task-force-report-tablesAmerican Lands Council
 

Similar to 2014 data show livestock data (20)

Модель органической фермы. Роман Макухин
Модель органической фермы. Роман МакухинМодель органической фермы. Роман Макухин
Модель органической фермы. Роман Макухин
 
Student Managed Farm Crops Final Presentation 2012
Student Managed Farm Crops Final Presentation 2012Student Managed Farm Crops Final Presentation 2012
Student Managed Farm Crops Final Presentation 2012
 
Startup Financial Modeling
Startup Financial ModelingStartup Financial Modeling
Startup Financial Modeling
 
10.3 2016 investor presentation pea
10.3 2016 investor presentation   pea10.3 2016 investor presentation   pea
10.3 2016 investor presentation pea
 
Dr. Kyle Coble - Introduction: How Do We Define Wean Age
Dr. Kyle Coble - Introduction: How Do We Define Wean AgeDr. Kyle Coble - Introduction: How Do We Define Wean Age
Dr. Kyle Coble - Introduction: How Do We Define Wean Age
 
Clinton Global Initiative Hult Prize Finalist Presentation - Harambee
Clinton Global Initiative Hult Prize Finalist Presentation - HarambeeClinton Global Initiative Hult Prize Finalist Presentation - Harambee
Clinton Global Initiative Hult Prize Finalist Presentation - Harambee
 
Exhibits - Copy
Exhibits - CopyExhibits - Copy
Exhibits - Copy
 
Make or Buy? Serving Great Products at an Affordable Price
Make or Buy? Serving Great Products at an Affordable PriceMake or Buy? Serving Great Products at an Affordable Price
Make or Buy? Serving Great Products at an Affordable Price
 
1. 2020 Commodity Outlook
1. 2020 Commodity Outlook1. 2020 Commodity Outlook
1. 2020 Commodity Outlook
 
360° Benchmarking for Pork Production
360° Benchmarking for Pork Production360° Benchmarking for Pork Production
360° Benchmarking for Pork Production
 
delaura 01 restaurant-projections 1
delaura 01 restaurant-projections 1delaura 01 restaurant-projections 1
delaura 01 restaurant-projections 1
 
AIA2019 - Rick Rasmussen - Startup Financials
AIA2019 - Rick Rasmussen - Startup FinancialsAIA2019 - Rick Rasmussen - Startup Financials
AIA2019 - Rick Rasmussen - Startup Financials
 
Round 5Dec. 31, 2018 C58538AndrewsEugene EllisPhili.docx
Round 5Dec. 31, 2018 C58538AndrewsEugene EllisPhili.docxRound 5Dec. 31, 2018 C58538AndrewsEugene EllisPhili.docx
Round 5Dec. 31, 2018 C58538AndrewsEugene EllisPhili.docx
 
Financial Forecasting
Financial ForecastingFinancial Forecasting
Financial Forecasting
 
January 2019 USPS® Rate Change Comparison Chart
January 2019 USPS® Rate Change Comparison ChartJanuary 2019 USPS® Rate Change Comparison Chart
January 2019 USPS® Rate Change Comparison Chart
 
Cost accounting brownies basket with cost sheet
Cost accounting brownies basket with cost sheetCost accounting brownies basket with cost sheet
Cost accounting brownies basket with cost sheet
 
Budget Variance Analysis PowerPoint Presentation Slides
Budget Variance Analysis PowerPoint Presentation SlidesBudget Variance Analysis PowerPoint Presentation Slides
Budget Variance Analysis PowerPoint Presentation Slides
 
Trends in Global Food Market in Revenue Term..pptx
Trends in Global Food Market in Revenue Term..pptxTrends in Global Food Market in Revenue Term..pptx
Trends in Global Food Market in Revenue Term..pptx
 
T A X T A B L E A • T 1 - T 4T A X T A B L E B • T 5 - T 1.docx
T A X T A B L E A • T 1 - T 4T A X T A B L E B • T 5 - T 1.docxT A X T A B L E A • T 1 - T 4T A X T A B L E B • T 5 - T 1.docx
T A X T A B L E A • T 1 - T 4T A X T A B L E B • T 5 - T 1.docx
 
Id intertech-preliminary-draft-public-land-mgmt-task-force-report-tables
Id intertech-preliminary-draft-public-land-mgmt-task-force-report-tablesId intertech-preliminary-draft-public-land-mgmt-task-force-report-tables
Id intertech-preliminary-draft-public-land-mgmt-task-force-report-tables
 

Recently uploaded

In the Adani-Hindenburg case, what is SEBI investigating.pptx
In the Adani-Hindenburg case, what is SEBI investigating.pptxIn the Adani-Hindenburg case, what is SEBI investigating.pptx
In the Adani-Hindenburg case, what is SEBI investigating.pptx
Adani case
 
Premium MEAN Stack Development Solutions for Modern Businesses
Premium MEAN Stack Development Solutions for Modern BusinessesPremium MEAN Stack Development Solutions for Modern Businesses
Premium MEAN Stack Development Solutions for Modern Businesses
SynapseIndia
 
ModelingMarketingStrategiesMKS.CollumbiaUniversitypdf
ModelingMarketingStrategiesMKS.CollumbiaUniversitypdfModelingMarketingStrategiesMKS.CollumbiaUniversitypdf
ModelingMarketingStrategiesMKS.CollumbiaUniversitypdf
fisherameliaisabella
 
Maksym Vyshnivetskyi: PMO Quality Management (UA)
Maksym Vyshnivetskyi: PMO Quality Management (UA)Maksym Vyshnivetskyi: PMO Quality Management (UA)
Maksym Vyshnivetskyi: PMO Quality Management (UA)
Lviv Startup Club
 
The Influence of Marketing Strategy and Market Competition on Business Perfor...
The Influence of Marketing Strategy and Market Competition on Business Perfor...The Influence of Marketing Strategy and Market Competition on Business Perfor...
The Influence of Marketing Strategy and Market Competition on Business Perfor...
Adam Smith
 
LA HUG - Video Testimonials with Chynna Morgan - June 2024
LA HUG - Video Testimonials with Chynna Morgan - June 2024LA HUG - Video Testimonials with Chynna Morgan - June 2024
LA HUG - Video Testimonials with Chynna Morgan - June 2024
Lital Barkan
 
Anny Serafina Love - Letter of Recommendation by Kellen Harkins, MS.
Anny Serafina Love - Letter of Recommendation by Kellen Harkins, MS.Anny Serafina Love - Letter of Recommendation by Kellen Harkins, MS.
Anny Serafina Love - Letter of Recommendation by Kellen Harkins, MS.
AnnySerafinaLove
 
Recruiting in the Digital Age: A Social Media Masterclass
Recruiting in the Digital Age: A Social Media MasterclassRecruiting in the Digital Age: A Social Media Masterclass
Recruiting in the Digital Age: A Social Media Masterclass
LuanWise
 
Authentically Social Presented by Corey Perlman
Authentically Social Presented by Corey PerlmanAuthentically Social Presented by Corey Perlman
Authentically Social Presented by Corey Perlman
Corey Perlman, Social Media Speaker and Consultant
 
Brand Analysis for an artist named Struan
Brand Analysis for an artist named StruanBrand Analysis for an artist named Struan
Brand Analysis for an artist named Struan
sarahvanessa51503
 
Meas_Dylan_DMBS_PB1_2024-05XX_Revised.pdf
Meas_Dylan_DMBS_PB1_2024-05XX_Revised.pdfMeas_Dylan_DMBS_PB1_2024-05XX_Revised.pdf
Meas_Dylan_DMBS_PB1_2024-05XX_Revised.pdf
dylandmeas
 
Company Valuation webinar series - Tuesday, 4 June 2024
Company Valuation webinar series - Tuesday, 4 June 2024Company Valuation webinar series - Tuesday, 4 June 2024
Company Valuation webinar series - Tuesday, 4 June 2024
FelixPerez547899
 
Authentically Social by Corey Perlman - EO Puerto Rico
Authentically Social by Corey Perlman - EO Puerto RicoAuthentically Social by Corey Perlman - EO Puerto Rico
Authentically Social by Corey Perlman - EO Puerto Rico
Corey Perlman, Social Media Speaker and Consultant
 
Understanding User Needs and Satisfying Them
Understanding User Needs and Satisfying ThemUnderstanding User Needs and Satisfying Them
Understanding User Needs and Satisfying Them
Aggregage
 
Chapter 7 Final business management sciences .ppt
Chapter 7 Final business management sciences .pptChapter 7 Final business management sciences .ppt
Chapter 7 Final business management sciences .ppt
ssuser567e2d
 
Hamster Kombat' Telegram Game Surpasses 100 Million Players—Token Release Sch...
Hamster Kombat' Telegram Game Surpasses 100 Million Players—Token Release Sch...Hamster Kombat' Telegram Game Surpasses 100 Million Players—Token Release Sch...
Hamster Kombat' Telegram Game Surpasses 100 Million Players—Token Release Sch...
SOFTTECHHUB
 
Tata Group Dials Taiwan for Its Chipmaking Ambition in Gujarat’s Dholera
Tata Group Dials Taiwan for Its Chipmaking Ambition in Gujarat’s DholeraTata Group Dials Taiwan for Its Chipmaking Ambition in Gujarat’s Dholera
Tata Group Dials Taiwan for Its Chipmaking Ambition in Gujarat’s Dholera
Avirahi City Dholera
 
ikea_woodgreen_petscharity_dog-alogue_digital.pdf
ikea_woodgreen_petscharity_dog-alogue_digital.pdfikea_woodgreen_petscharity_dog-alogue_digital.pdf
ikea_woodgreen_petscharity_dog-alogue_digital.pdf
agatadrynko
 
Call 8867766396 Satta Matka Dpboss Matka Guessing Satta batta Matka 420 Satta...
Call 8867766396 Satta Matka Dpboss Matka Guessing Satta batta Matka 420 Satta...Call 8867766396 Satta Matka Dpboss Matka Guessing Satta batta Matka 420 Satta...
Call 8867766396 Satta Matka Dpboss Matka Guessing Satta batta Matka 420 Satta...
bosssp10
 
Creative Web Design Company in Singapore
Creative Web Design Company in SingaporeCreative Web Design Company in Singapore
Creative Web Design Company in Singapore
techboxsqauremedia
 

Recently uploaded (20)

In the Adani-Hindenburg case, what is SEBI investigating.pptx
In the Adani-Hindenburg case, what is SEBI investigating.pptxIn the Adani-Hindenburg case, what is SEBI investigating.pptx
In the Adani-Hindenburg case, what is SEBI investigating.pptx
 
Premium MEAN Stack Development Solutions for Modern Businesses
Premium MEAN Stack Development Solutions for Modern BusinessesPremium MEAN Stack Development Solutions for Modern Businesses
Premium MEAN Stack Development Solutions for Modern Businesses
 
ModelingMarketingStrategiesMKS.CollumbiaUniversitypdf
ModelingMarketingStrategiesMKS.CollumbiaUniversitypdfModelingMarketingStrategiesMKS.CollumbiaUniversitypdf
ModelingMarketingStrategiesMKS.CollumbiaUniversitypdf
 
Maksym Vyshnivetskyi: PMO Quality Management (UA)
Maksym Vyshnivetskyi: PMO Quality Management (UA)Maksym Vyshnivetskyi: PMO Quality Management (UA)
Maksym Vyshnivetskyi: PMO Quality Management (UA)
 
The Influence of Marketing Strategy and Market Competition on Business Perfor...
The Influence of Marketing Strategy and Market Competition on Business Perfor...The Influence of Marketing Strategy and Market Competition on Business Perfor...
The Influence of Marketing Strategy and Market Competition on Business Perfor...
 
LA HUG - Video Testimonials with Chynna Morgan - June 2024
LA HUG - Video Testimonials with Chynna Morgan - June 2024LA HUG - Video Testimonials with Chynna Morgan - June 2024
LA HUG - Video Testimonials with Chynna Morgan - June 2024
 
Anny Serafina Love - Letter of Recommendation by Kellen Harkins, MS.
Anny Serafina Love - Letter of Recommendation by Kellen Harkins, MS.Anny Serafina Love - Letter of Recommendation by Kellen Harkins, MS.
Anny Serafina Love - Letter of Recommendation by Kellen Harkins, MS.
 
Recruiting in the Digital Age: A Social Media Masterclass
Recruiting in the Digital Age: A Social Media MasterclassRecruiting in the Digital Age: A Social Media Masterclass
Recruiting in the Digital Age: A Social Media Masterclass
 
Authentically Social Presented by Corey Perlman
Authentically Social Presented by Corey PerlmanAuthentically Social Presented by Corey Perlman
Authentically Social Presented by Corey Perlman
 
Brand Analysis for an artist named Struan
Brand Analysis for an artist named StruanBrand Analysis for an artist named Struan
Brand Analysis for an artist named Struan
 
Meas_Dylan_DMBS_PB1_2024-05XX_Revised.pdf
Meas_Dylan_DMBS_PB1_2024-05XX_Revised.pdfMeas_Dylan_DMBS_PB1_2024-05XX_Revised.pdf
Meas_Dylan_DMBS_PB1_2024-05XX_Revised.pdf
 
Company Valuation webinar series - Tuesday, 4 June 2024
Company Valuation webinar series - Tuesday, 4 June 2024Company Valuation webinar series - Tuesday, 4 June 2024
Company Valuation webinar series - Tuesday, 4 June 2024
 
Authentically Social by Corey Perlman - EO Puerto Rico
Authentically Social by Corey Perlman - EO Puerto RicoAuthentically Social by Corey Perlman - EO Puerto Rico
Authentically Social by Corey Perlman - EO Puerto Rico
 
Understanding User Needs and Satisfying Them
Understanding User Needs and Satisfying ThemUnderstanding User Needs and Satisfying Them
Understanding User Needs and Satisfying Them
 
Chapter 7 Final business management sciences .ppt
Chapter 7 Final business management sciences .pptChapter 7 Final business management sciences .ppt
Chapter 7 Final business management sciences .ppt
 
Hamster Kombat' Telegram Game Surpasses 100 Million Players—Token Release Sch...
Hamster Kombat' Telegram Game Surpasses 100 Million Players—Token Release Sch...Hamster Kombat' Telegram Game Surpasses 100 Million Players—Token Release Sch...
Hamster Kombat' Telegram Game Surpasses 100 Million Players—Token Release Sch...
 
Tata Group Dials Taiwan for Its Chipmaking Ambition in Gujarat’s Dholera
Tata Group Dials Taiwan for Its Chipmaking Ambition in Gujarat’s DholeraTata Group Dials Taiwan for Its Chipmaking Ambition in Gujarat’s Dholera
Tata Group Dials Taiwan for Its Chipmaking Ambition in Gujarat’s Dholera
 
ikea_woodgreen_petscharity_dog-alogue_digital.pdf
ikea_woodgreen_petscharity_dog-alogue_digital.pdfikea_woodgreen_petscharity_dog-alogue_digital.pdf
ikea_woodgreen_petscharity_dog-alogue_digital.pdf
 
Call 8867766396 Satta Matka Dpboss Matka Guessing Satta batta Matka 420 Satta...
Call 8867766396 Satta Matka Dpboss Matka Guessing Satta batta Matka 420 Satta...Call 8867766396 Satta Matka Dpboss Matka Guessing Satta batta Matka 420 Satta...
Call 8867766396 Satta Matka Dpboss Matka Guessing Satta batta Matka 420 Satta...
 
Creative Web Design Company in Singapore
Creative Web Design Company in SingaporeCreative Web Design Company in Singapore
Creative Web Design Company in Singapore
 

2014 data show livestock data

  • 1. Livestock Enterprise Information  Dairy – By Profitability – By Herd Size  Beef  Hogs Statewide Data
  • 2. Livestock Enterprise Information  Dairy data on slides prior to “Dairy by herd size” does not include Organic Production
  • 3. Number of Dairy Cows Average Farm 20 70 120 170 220 Cow #s 117 122 128 140 134 140 160 170 179 184 2005 2006 2007 2008 2009 2010 2011 2012 2013 2014 The average number of dairy cows up again in 2014 Pg 50-51
  • 4. Number of Dairy Cows – Median income farms 40 90 140 190 240 Cow #s 106 138 134 152 162 123 184 220 152 223 2005 2006 2007 2008 2009 2010 2011 2012 2013 2014 Pg 50-51
  • 5. Production & Returns per Cow -400 -200 0 200 400 600 800 1000 1200 1400 16,000 17,000 18,000 19,000 20,000 21,000 22,000 23,000 24,000 25,000 2005 2006 2007 2008 2009 2010 2011 2012 2013 2014 # milk/cow return/cow Milk production up slightly - Returns up Significantly Pg 50-51
  • 6. Milk Price less Feed Cost 8.15 7.1 9.93 9.62 7.31 9.9 7.44 7.49 10.56 10.22 7.99 11.88 11.26 6.21 9.02 11.01 9.35 9.93 14.15 0 2 4 6 8 10 12 14 16 1996 1997 1998 1999 2000 2001 2002 2003 2004 2005 2006 2007 2008 2009 2010 2011 2012 2013 2014 DollarsperCWT Returns UP!!! Pg 50-51
  • 7. Dairy Cows – Costs and Gross Margin per CWT Feed Direct Dir & Ovhd Gross Margin $0.00 $7.00 $14.00 $21.00 $28.00 Average Mid 40-60 High $10.22 $10.34 $9.58 $15.57 $16.23 $13.67 $18.38 $18.44 $17.45 $23.64 $23.39 $24.61 Net Returns: $5.26 $4.95 $7.16 Pg 50
  • 8. Dairy Cows – 3-yr view Costs and Gross Margin per CWT Feed Direct Dir & Ovhd Gross Margin $0.00 $7.00 $14.00 $21.00 $28.00 2012 2013 2014 $10.19 $10.37 $10.22 $14.86 $15.18 $15.57 $17.44 $17.81 $18.38 $18.72 $19.06 $23.64 Net Returns: $1.28 $1.25 $5.26 Pg 50
  • 9. Dairy Cows – Returns per Cow Net: Dir, Ovhd, Lab & Mgt Net: Dir & Ovhd Net: Ovhd Gross Margin $0 $2,000 $4,000 $6,000 $8,000 Average Mid 40-60 High $1,026 $1,051 $1,519 $1,249 $1,217 $1,800 $1,918 $1,761 $2,748 $5,618 $5,752 $6,187 Pg 51
  • 10. Dairy Cows – 3-yr view Returns per Cow Net: Dir, Ovhd, Lab & Mgt Net: Dir & Ovhd Net: Ovhd Gross Margin $0 $2,000 $4,000 $6,000 2012 2013 2014$89 $90 $1,026 $290 $287 $1,249 $879 $895 $1,918 $4,263 $4,400 $5,618 Pg 65
  • 12. How about 2015? 2014 % Change Est. 2015 Milk Produced 23,556 + 2% 24,027 Feed Cost $2,420.33 - 5% $2,299.31 Fuel $117.01 - 30% $81.91 Repairs $181.12 + 5% $190.18 Hired Labor $437.62 + 5% $459.50 Utilities $69.14 + 5% $72.60 Assuming all other expenses and income stay the same
  • 13. 2015 Continued 2014 2015 Average Class III $22.34 $16.34* Average Basis $2.14 $2.14 Average Pay Price $24.48 $18.48 Net Change - $6.00 Cost of Production $19.97 $19.17 Milk Price minus Feed Cost $14.14 $8.91 Net Return/Cow $1,026 - $141.74 * Based on April 2015 Dunn Dairy Outlook Report
  • 14. Production & Returns per Cow -400 -200 0 200 400 600 800 1000 1200 1400 16,000 17,000 18,000 19,000 20,000 21,000 22,000 23,000 24,000 25,000 2006 2007 2008 2009 2010 2011 2012 2013 2014 2015 # milk/cow return/cow Estimated 2015 Pg 50-51
  • 15. Milk Price less Feed Cost 7.1 9.93 9.62 7.31 9.9 7.44 7.49 10.56 10.22 7.99 11.88 11.26 6.21 9.02 11.01 9.36 9.93 14.15 8.91 0 2 4 6 8 10 12 14 16 1997 1998 1999 2000 2001 2002 2003 2004 2005 2006 2007 2008 2009 2010 2011 2012 2013 2014 2015 DollarsperCWT Estimated 2015 Pg 50-51
  • 16. Dairy Cows - MN Dairy Sort Data by Size of Herd -- All Dairy Herds, including Organic --
  • 17. Dairy Cows – Number of Farms in database 0 100 200 300 400 Total <50 cows 51- 100 cows 101- 200 cows 201- 500 cows > 500 cows 394 54 145 99 66 30 MN FBM Dairy Sort
  • 18. 0% 10% 20% 30% 40% 50% 60% 70% 80% 90% 100% Total <50 cows 51-100 cows 101- 200 cows 201- 500 cows > 500 cows 396 14% 37% 25% 17% 8% 0% 5% 10% 15% 20% 25% 30% 35% 40% 45% Total <50 cows 51- 100 cows 101- 200 cows 201- 500 cows > 500 cows 12% 5% 10% 29% 31% 44% Dairy Cows – Number of Herds and Percent of MN Farms Some herd data provided by the Minn Department of Ag. MN FBM Dairy Sort
  • 19. 0% 10% 20% 30% 40% 50% Total <50 cows 51-100 cows 101-200 cows 201-500 cows > 500 cows 2012 10% 3% 10% 28% 33% 35% 2013 11% 4% 9% 31% 29% 35% 2013 12% 5% 10% 29% 31% 44% 12% 5% 10% 29% 31% 44% 2012 2013 2013 Dairy Cows – Farms as percent of all MN herds MN FBM Dairy Sort
  • 20. Minnesota Dairy Sort Selected Factors - Size and Production 16625 19916 21614 24018 26487 38 74 140 312 797 0 200 400 600 800 1000 1200 Up to 50 Cows 50 - 100 Cows 100-200 Cows 200-500 Cows Over 500 Cows Pounds of Milk No. of Cows MN FBM Dairy Sort
  • 21. Minnesota Dairy Sort Selected Factors - Cost and Price Feed Dir & Ovhd Dir, Ovhd, & Lab Gross Margin 0.00 7.00 14.00 21.00 28.00 <50 Cows 51-100 101-200 201-500 >500 Cows 11.52 10.97 10.26 10.29 9.97 19.07 18.52 18.08 18.87 18.23 21.57 20.08 19.30 19.65 18.90 23.04 23.87 23.65 23.86 23.57 Ave Price = $24.43 Ave Cost w Labor = $19.40 MN FBM Dairy Sort
  • 22. 11.52 10.97 10.26 10.29 9.97 16.18 15.55 15.04 15.74 15.80 19.07 18.52 18.08 18.87 18.23 21.57 20.08 19.30 19.65 18.90 9.00 17.00 25.00 Under 50 Cows 50 - 100 Cows 100 - 250 Cows 250 - 500 Cows Over 500 Cows Feed Cost Direct Minnesota Dairy Sort Selected Factors – Production Costs MN FBM Dairy Sort
  • 23. Minnesota Dairy Sort Hired Labor and Operator Labor/Mgmt MN FBM Dairy Sort 2.50 1.56 1.22 0.78 0.67 0.37 0.88 1.31 2.08 2.35 0.00 0.50 1.00 1.50 2.00 2.50 3.00 3.50 Up to 50 Cows 50-100 Cows 101-200 Cows 201-500 Cows Over 500 Cows Lbr & Mgt Charge Total Hired Labor 3.022.44 2.862.532.87
  • 24. Dairy Sorts Expanded… Sort - Includes All Robotic Dairy Non-Robotic Traditional Non-Robotic 3X Milking Organic Dairy Initiatives Sort - Excludes NA All non- robotic herds Organic, Org. Transition, 3X Milking, Rot. Grazing, Robotics Organic, Org. Transition, Rot. Grazing, Robotics, non- 3X milk herds All non- organic herds All non-Dairy Initiative herds Number of Farms 390 9 327 33 15 96 Number of Cows 180.4 179.6 151.0 558.5 87.7 158.6 Milk Produced per Cow 23,556 24,742 22,923 26,075 13,041 22,518 Product/Animals Sold $5,716.23 $5,871.18 $5,582.60 $6,229.11 $3,978.38 $5,488.87 Gross Margin $5,581.78 $5,749.94 $5,423.43 $6,159.86 $3,807.30 $5,368.08 Feed Cost per Cow $2,420.33 $2,378.86 $2,369.73 $2,607.94 $1,967.27 $2,308.10 Veterinary $112.47 $144.85 $107.21 $129.98 $35.24 $105.77 BST $48.82 $36.56 $40.73 $75.96 $0.00 $34.60 Repairs $181.12 $246.46 $162.05 $207.55 $161.25 $177.79 Hired Labor - direct $258.84 $106.78 $190.65 $471.20 $88.78 $300.13 Hired Labor - Ovhd $178.78 $97.24 $193.33 $152.10 $140.14 $71.50 Interest $84.90 $219.92 $87.43 $67.78 $76.46 $78.48 Depreciation $168.16 $391.13 $155.93 $182.55 $88.58 $155.29 Total Dir &Ovhd Cost $4,345.28 $4,506.81 $4,194.56 $4,850.70 $3,176.84 $4,098.57 Net Return $1,236.50 $1,243.13 $1,228.87 $1,309.16 $630.46 $1,269.51 Cost of Prod - O&D $18.45 $18.22 $18.30 $18.60 $24.36 $18.20 Culling Percentage 30.3 27.8 29.1 33.7 28.9 29.8 Turnover Rate 37.4 36.1 36.5 40.2 33.6 36.8 Feed Cost per CWT $10.27 $9.61 $10.34 $10.00 $15.09 $10.25 Dairy Cows - Additional Sorts
  • 25. Robotic Dairy Robotic All 3X Herds Vs. 3X Milk/Cow 24,742 23,556 26,075 -1,333 Feed Cost $9.61 $10.27 $10.00 - 0.39 Vet $144.85 $112.47 $129.98 + 14.87 Supplies $346.35 $341.93 $312.05 + 34.30 Repairs $246.46 $181.12 $207.55 + 38.91 Labor (total) $410.62 $661.57 $816.48 - 405.86 Utilities $148.66 $69.14 $67.89 + 80.77 Interest $219.92 $84.90 $67.78 + 152.15 Depreciation $391.13 $166.72 $182.55 + 208.58 COP w/Labor $19.71 $20.09 $19.78 - .07 Lbs 2,543,980 1,611,802 1,584,551 + 959,429
  • 26. Robotic/3x Comparison (2) Robotic 3X Difference Labor $410.62 $816.48 - 405.86 Supplies, Repairs, Utilities, Interest, Depreciation $1,352.52 $837.82 + 514.70 Total $1,753.14 $1,654.30 + 108.84
  • 27. Robotic/3x Comparison (Labor Efficiency) Robotic 3X Difference Labor Hrs/Cow 26.95 45.67 59% $/Hr $15.24 $17.88 Milk/FTE 2,543,980 1,584,551 62%
  • 28. 3X vs. Traditional Traditional 3X Herds Difference Milk/Cow 22,923 26,075 + 3,152 Hrs/Cow 39.23 45.87 + 6.64 Labor (total) $617.80 $816.48 + 198.68 Labor Cost/CWT Additional Milk $15.86 Lbs/FTE 1,627,611 1,584,511 - 43,100 Hrs/CWt .171 .176 - .005 Feed Cost $10.34 $10.00 - 0.34 COP $20.10 $19.78 - 0.32
  • 29. Barn Style Comparisons Tie-Stall Compost Free Stall Sand-Bedding Milk/Cow 21,237 18,835 24,659 25,449 Hrs/Cow 44.13 33.18 42.76 45.78 Labor (total) $554.31 $524.56 $368.79 $740.03 Total Costs/Co w $3,744.27 $3,961.58 $4,550.77 $4,578.25 Bedding $42.93 $187.03 $83.01 $89.56 Feed Cost 10.26 11.51 10.17 9.83 COP 19.67 $21.97 $19.88 $19.64 Net Return $1,039.88 $681.09 $1,083.16 $1,175.16
  • 30. Bedding Comparisons (2) 0 5 10 15 20 25 Tie-Stall Compost FreeStall Sand Bedding Feed Labor Overhead Direct
  • 31. BST vs. Non-BST BST Non-BST Difference Milk Produced 25,581 23,280 + 2,301 Feed Costs $10.16 $10.26 - 0.10 Total Direct Costs $16.21 $15.42 + 0.79 Overhead Costs $2.71 $2.80 - 0.09 BST Cost $0.42 $0 + 0.42 BST Cost/Additional Milk $4.65 Total COP $19.95 $20.03 - 0.08
  • 32. Dairy Finishing – Net Return & Price per Cwt up 82.40 100.04 110.26 113.17 130.69 8.98 12.39 7.05 3.07 48.66 2010 2011 2012 2013 2014 Price Recv'd/Cwt Net Return/Cwt Pg 57
  • 33. Beef Cow-Calf Returns - Net per Cow ($200.00) ($100.00) $0.00 $100.00 $200.00 $300.00 $400.00 $500.00 Net Return $168.89 $61.38 ($27.42) ($112.55) ($120.51) $53.60 $127.61 $88.27 $36.61 $451.63 2005 2006 2007 2008 2009 2010 2011 2012 2013 2014 Pg 60
  • 34. Beef Cow/Calf Cost of Production Trends 0 20 40 60 80 100 120 140 160 180 2009 2010 2011 2012 2013 2014 Cost of Production per CWT Produced COP
  • 35. Beef Cow-Calf – Costs and Returns of Production per Cow Feed Direct Dir & Ovhd Gross Margin $0 $450 $900 $1,350 $1,800 Average Mid 40-60 High $508 $470 $482 $685 $618 $639 $844 $737 $787 $1,295 $1,183 $1,591 Net Returns: $451 $447 $804 Pg 60
  • 36. Beef Cow-Calf – Costs and Returns of Production per Cow Feed Direct Dir & Ovhd Gross Margin $0 $450 $900 $1,350 $1,800 Average Up to 50 50-100 100-200 200-500 $508 $497 $529 $548 $397 $685 $676 $700 $725 $581 $844 $882 $870 $866 $696 $1,295 $1,217 $1,301 $1,313 $1,340 Net Returns: $451 $335 $431 $447 $644 Pg 61
  • 37. Beef Finishing Returns - Net per CWT ($10.00) $0.00 $10.00 $20.00 $30.00 $40.00 $50.00 $60.00 Net Return $5.50 ($1.63) ($0.36) ($3.54) $0.23 $14.38 $22.10 $5.21 $15.35 $57.76 2005 2006 2007 2008 2009 2010 2011 2012 2013 2014 Pg 59
  • 38. Farrow to Finish Hogs – Net Return & Price per Cwt 54.03 71.61 69.43 70.52 104.32 2.90 7.62 2.28 8.42 32.42 2010 2011 2012 2013 2014 Price Recv'd/Cwt Net Return/Cwt Not in Report
  • 39. Finish Feeder Pigs – Net Return & Price per Pig 85.74 85.82 89.60 98.79 63.84 63.89 66.84 73.61 15.07 2.86 3.13 15.03 2011 2012 2013 2014 Price Recv'd/Cwt Carcass Price/CWT live Wgt Net Return/Cwt Pg 62
  • 40. Weaning to Finish Hogs–Grower What makes up the Gross Margin? 8.08 8.46 12.07 11.23 5.66 2.38 7.08 4.26 3.68 Average Mid 40-60% High 20% Net Return Direct Exp Overhead Exp Pg 63 Note: Sort for returns is based on Return to Overhead Gross Margin: $15.69 $18.39 $18.13
  • 42. . In closing… Diligence in the mother of good luck.
  • 43. Thank you for listening to a review of this year’s Farm Business Management Annual Report information.