Download to read offline

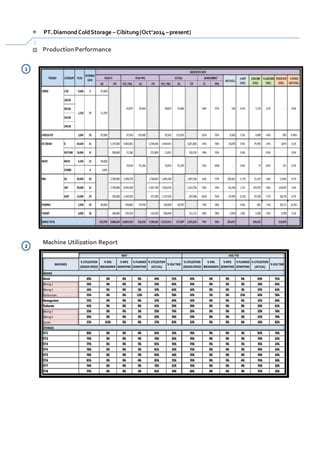
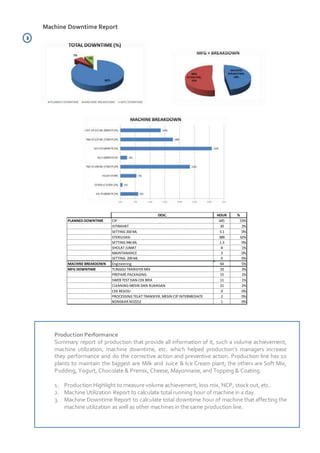
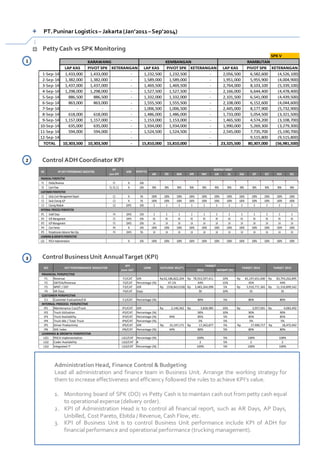

1. This document contains utilization data for various machines and storage areas used in a production process over the month of May. 2. It provides the percentage utilization based on design speed and actual speed for machines, as well as breakdown time, planned downtime, and idle time. 3. Similar data is shown for storage areas, including utilization and downtime percentages.


