Solar + storage deployment has grown exponentially over the course of the last 12 months. Our energy storage experts at Wood Mackenzie Power & Renewables will analyze key technology, economic and policy drivers at a global scale for the next three years, explaining why solar + storage is such a key step in enhancing the energy system of the future.
Presentation from the EPRI-Sandia Symposium on Secure and Resilient Microgrids: From Resiliency to Solvency: Building a Business Case for Public Purpose Microgirds, presented by Kenneth Horne, Navigant, Baltimore, MD, August 29-31, 2016.
Presentation from the EPRI-Sandia Symposium on Secure and Resilient Microgrids: Power Systems Engineering Research and Development, presented by Dan Ton, DOE OE, Baltimore, MD, August 29-31, 2016.
Presentation from the EPRI-Sandia Symposium on Secure and Resilient Microgrids: Adapting the Integrated Grid Economic Framework to Microgrids, presented by Jeffrey Roark, EPRI, Baltimore, MD, August 29-31, 2016.
Research Presentation: What’s Next for Customer Energy Management?Jill Kirkpatrick
With customer adopting smart technologies at an accelerating pace, utilities are making use of connected devices, such as smart thermostats, plug load solutions, solar + storage and grid-interactive water heaters.
This Wood Mackenzie Power & Renewables research presentation will explore what are the key benefits of these deployments, and which barriers to adoption persist.
Wood Mackenzie Power & Renewables Breakfast Briefing II: Battery and Non-Batt...Nicole Green
Storage system prices have declined by more than 60% since 2012 and are expected to decline by another 30% over the next five years. Historically battery prices drove the bulk of system price declines, but in the future both battery prices and non-battery components like inverters, software & controls, and design, engineering and construction services will drive system price reductions. Where will the market see most savings? How will the vendor landscape evolve over the course of the next five years, as the storage industry collectively targets bringing down system prices further.
2017 Strategic Directions: Electric Industry Survey Black & Veatch
The annual Black & Veatch Strategic Directions: Electric Industry Report explores progress made across the power generation and delivery sectors, with an eye toward their evolving landscapes. Over the last year, the sector has adapted to ongoing changes — the proliferation of renewable energy, a changing regulatory outlook and heightened focus on investment, infrastructure and regulation — all while navigating familiar but pressing challenges related to reliability and resilience.
The industry is charting its path forward by integrating advanced
technologies, accommodating growing amounts of distributed energy resources exploring the possibilities created by energy storage. To their benefit, electric utilities are increasingly embracing new technology, understanding that data is critical because it will allow them to prioritize efforts, commit funding and allocate resources in a strategic manner.
Reliance on coal-fired power generation continues to give way to inexpensive and abundant natural gas, as well as increasing amounts of renewable energy from solar and wind.
The 2017 Strategic Directions: Electric Industry Report examines how utility leaders are navigating these challenges — both old and new — and advancing for future growth. The report also addresses potential hurdles that may impede success.
Concerns persist over security, aging infrastructure, environmental regulation and the management of long-term
investments that will force utility leaders to innovate and meeting shifting customer demands.
We welcome your questions and comments regarding this
report and/or Black & Veatch services. You can reach us at MediaInfo@bv.com.
Presentation from the EPRI-Sandia Symposium on Secure and Resilient Microgrids: Rivermoor Energy, presented by John Tourtelotte, Baltimore, MD, August 29-31, 2016.
Utilities Global Market Report 2015 Released By The Business Research Company
http://www.thebusinessresearchcompany.com/our-research/utilities/utilities-global-market-briefing/
Utilities Global Market provides strategists, marketers and senior management with the critical information they need to assess the global Utilities sector.
The total value of the utilities sector globally in 2014 was $3,676 billion. Related to a world population of more than 7 billion in 2014 this equates to about $525 per person globally. Given that World Domestic Product was approximately $78 trillion in 2014, the market makes up about 4.7% of the global economy.
83% of households globally were supplied with electricity in 2013. Urban electrification was 95% whereas, rural electrification stood at 70%. The average annual rate of electrification in developing countries increased by 3.7% in 2014.
Global natural gas production was 3500 Bcm (Billion cubic meters) and grew by 1.6% in 2014. The highest level of natural gas consumption was by China (8.6%) followed by Iran (6.8%).
The utilities industry is one of the largest and fastest growing industries in the world. The term utilities refers to electricity, natural gas, water and sewerage services consumed by the public, hospitals, schools and other institutions, agriculture, factories and commercial establishments. In some countries these services are provided commercially by national, state or municipal governments or by cooperatives; in many, however, they are provided by the private sector.
Electric utility companies engage in the generation, transmission and distribution of electricity. They source coal from mining companies and heavy oil distillates from oil companies for power generation. Some also source power from sustainable energy sources and nuclear power stations for distribution. The power generated is transmitted over long distances to transformers in substations. The electricity from the substation is then delivered to commercial and residential customers, in some cases along a national or state grid. The market for electricity is often a regulated one. Natural gas businesses deal with the storage, transmission and distribution of gas. In this report we are dealing with the companies engaged in transmission and distribution of natural gas. Natural gas utility companies are either privately held or run by state/national governments. They source gas from oil and gas exploration companies for distribution. The gas is stored in storage tanks, then distributed through high capacity interstate and intrastate pipelines to households, commercial and business establishments and to power plants which use it for generating electricity. The market for gas is often a regulated one.
Key Drivers for Energy Storage
Technological advancements and decrease in costs
Evolution of utility needs (rise of variable renewable generation)
Increasing customer choice and engagement
Policy and regulatory shifts
Five market trends that are re-shaping C&I energy management and procurementOmar Saadeh
The market for building energy management and procurement solutions is vast and today’s large electricity customers are exposed to an increasingly complex array of opportunities. A growing number of new solutions and upgrades continue to promise enhanced energy consumption and awareness, streamlined day-to-day business processes, and improved operational efficiency. Apart from proven applications such as demand response or commercial solar, an emerging class of utility and wholesale programs further offer energy managers new options to optimize their investments and realize positive project cash flows.
As we build out our C&I Customer Network and coverage into energy procurement and management for large energy consumers, we expect to produce more content in these areas. We’re happy to include folks in this space and take briefing from solution providers including vendors, developers, ESCOs and utilities. Please do reach-out.
Presentation from the EPRI-Sandia Symposium on Secure and Resilient Microgrids: Microgrids Lessons Learned-So Far, presented by Merrill Smith and Microgrid Exchange Group, DOE, Baltimore, MD, August 29-31, 2016.
Presentation from the EPRI-Sandia Symposium on Secure and Resilient Microgrids: Philadelphia Navy Yard: An Innovative Mini-City Microgrid, presented by Jayant Kumar, GE Grid Solutions, Baltimore, MD, August 29-31, 2016.
A presentation on "Big Data in Smart Grid" by MSc students at the University of Bradford, submitted as a part of coursework. It addresses the challenges, opportunities and issues related to Big Data and Data Protection in Smart Grid.
Using human-centred design to improve energy efficiency programsLeonardo ENERGY
Human-centred design is being used to make the NSW energy savings scheme more effective. We started with research that identified six key insights for improved scheme operation. It found that the scheme is complex and its fragmented tools and systems create unnecessary barriers to entry. We then used workshops to develop six corresponding opportunities for improved service delivery. To scale up we need streamlined manual processes, more collaboration and improved digital systems. This is especially relevant given recent announcements that the scheme is being extended to 2050.
This talk will present the research, and will place it in the context of changes announced as part of the NSW Energy Strategy. It will explore small, medium and long term changes to scheme delivery identified through the HCD process and our proposed next steps.
The NSW Energy Savings Scheme started in 2009. It has so far delivered projects that will save 27,000 gigawatt hours of energy and $5.6 billion in bill savings over their lifetimes.
Future proofing energy storage - a greensmith white paper (EN)Finnish_Energy_Hub
Energy storage has reached a turning point as a mainstream grid-reliability resource. The United States achieved another year of record deployments in 2016, and forecasts show continued rapid expansion of the energy storage industry. At the same time, the investment case for storage is still difficult due to risks of limited technology track record and business cases that rely on uncertain revenues. Due to rapidly changing grid dynamics and the long life required of storage assets, energy storage owners must future-proof their investments today.
To future-proof energy storage, storage developers must employ technology and project engineering specifically designed for flexibility. Future-proofing also requires commercial agreements and analytical expertise to optimize the operational value of energy storage.
Presentation by Bushveld Energy from the March 2019 Power Electricity & World Africa conference in South Africa. The presentation covers four questions:
1) How does storage technology integrate with energy generation and then with renewables ?
2) What are the key critical success factors that relate to the development of an energy storage project ?
3) Is there a greenfield pipeline of bankable projects?
4) Who is likely to finance these assets?
Introduction
Sun is the main source of life and prosperous to mankind
and organism at all times from ancient era to modern age.
The solar energy emanating from the sun, by virtue of its
unlimited resources, always proves it can compete with
other conventional depleted resources. This is evident, as
the world has seen recently, the solar technology advanced
enough to unveil the scale of benefits; when utilizing full
potential. Generation from wind is complementing the
efforts from solar generation and competing favorably in
countries with sufficient wind blows. NREL-National
Renewable Energy Lab, US predicated that the cost of solar
and wind generation, to be the lowest cost in near future
compared to other generations and share 1000 GW
worldwide.
1. Challenges with Generation
Integration
PV and CSP maximum instantaneous generation depends
on how much sunlight is available at any given instant, which
makes their generation variable (VRE) and difficult to predict.
VRE can be installed in bulk at utility level or at commercial
and industrial buildings or at homes. Utility solar generations
can be located in areas with less loads and their energy needs
to be transmitted to load centers. Operation of variable solar
Presentation to the annual UCLA Smart Grid research collaborative discussing the operational considerations of an increasing hybrid electric system involving millions of customers participating.
Energy storage has been in use in our society and daily life for decades. Although energy storage has not grown to be a significant part of the electric energy system, recent advancement of energy storage technologies and growing needs for energy storage in both power and transportation sectors make it possible and imperative to accelerate energy storage development, deployment, and adoption. Power systems have to balance electricity generation and consumption in real-time, gasoline and diesel fuel are still the primary sources of energy for transportation, and we generally do not have good ways to conveniently and cost-effectively store a large amount of electrical energy and use it in an on-demand manner. While we need to continue decarbonizing electric power generation through increases in renewable generation, we also need to address transportation as the main source of carbon emissions. Energy storage is an important solution to address both electrification of transportation and other industries and the variability in renewable energy such as wind and solar generation.
Bulk of the existing grid energy storage capacity is provided by pumped hydro energy storage plants that were built to support large baseload power plants such as nuclear generating stations. Battery energy systems are beginning to be deployed at a rapid pace. The requirements of energy storage in the electric grid are still evolving and may differ from those of electrical transportation. Needs for research and development to enhance energy storage performance and knowledge is summarized in the following areas:
1) Energy storage engineering and integration: Effective system integration is a challenging problem for energy storage due to the great diversity of potential applications ranging from behind-the-meter storage to large grid-connected energy storage plants. Each of these applications has its own set of constraints and performance requirements. Over the next decade, the diversity of energy storage installations will expand in the range of applications, in size and scale, and in system complexity. Effective integration is also important to achieve desired cost reduction needed to support large scale deployment. Research gaps in this area include: energy storage installations with higher power capacities and higher working voltages; streamlining engineering to hybridize and co-optimize energy storage with the rest of the system; more effective controls, sensors, and energy management systems; designing modular power converter architecture to minimize system complexity, improve reliability, and reduce integration costs; and industry standards for secure communication and interoperability.
Formulation of Net Metering Policy for Odisha to boost rooftop Solar ProjectsBikash Kumar Mallick
Formulation of Net Metering Policy for Odisha to boost Rooftop Solar Projects
Original Link: http://www.iroaf.indianrailways.gov.in/iroaf/uploads/files/1456814619659-Odisha%20Draft%20Net%20Metering%20Policy.pdf
Welocme to ViralQR, your best QR code generator.ViralQR
Welcome to ViralQR, your best QR code generator available on the market!
At ViralQR, we design static and dynamic QR codes. Our mission is to make business operations easier and customer engagement more powerful through the use of QR technology. Be it a small-scale business or a huge enterprise, our easy-to-use platform provides multiple choices that can be tailored according to your company's branding and marketing strategies.
Our Vision
We are here to make the process of creating QR codes easy and smooth, thus enhancing customer interaction and making business more fluid. We very strongly believe in the ability of QR codes to change the world for businesses in their interaction with customers and are set on making that technology accessible and usable far and wide.
Our Achievements
Ever since its inception, we have successfully served many clients by offering QR codes in their marketing, service delivery, and collection of feedback across various industries. Our platform has been recognized for its ease of use and amazing features, which helped a business to make QR codes.
Our Services
At ViralQR, here is a comprehensive suite of services that caters to your very needs:
Static QR Codes: Create free static QR codes. These QR codes are able to store significant information such as URLs, vCards, plain text, emails and SMS, Wi-Fi credentials, and Bitcoin addresses.
Dynamic QR codes: These also have all the advanced features but are subscription-based. They can directly link to PDF files, images, micro-landing pages, social accounts, review forms, business pages, and applications. In addition, they can be branded with CTAs, frames, patterns, colors, and logos to enhance your branding.
Pricing and Packages
Additionally, there is a 14-day free offer to ViralQR, which is an exceptional opportunity for new users to take a feel of this platform. One can easily subscribe from there and experience the full dynamic of using QR codes. The subscription plans are not only meant for business; they are priced very flexibly so that literally every business could afford to benefit from our service.
Why choose us?
ViralQR will provide services for marketing, advertising, catering, retail, and the like. The QR codes can be posted on fliers, packaging, merchandise, and banners, as well as to substitute for cash and cards in a restaurant or coffee shop. With QR codes integrated into your business, improve customer engagement and streamline operations.
Comprehensive Analytics
Subscribers of ViralQR receive detailed analytics and tracking tools in light of having a view of the core values of QR code performance. Our analytics dashboard shows aggregate views and unique views, as well as detailed information about each impression, including time, device, browser, and estimated location by city and country.
So, thank you for choosing ViralQR; we have an offer of nothing but the best in terms of QR code services to meet business diversity!
The Art of the Pitch: WordPress Relationships and SalesLaura Byrne
Clients don’t know what they don’t know. What web solutions are right for them? How does WordPress come into the picture? How do you make sure you understand scope and timeline? What do you do if sometime changes?
All these questions and more will be explored as we talk about matching clients’ needs with what your agency offers without pulling teeth or pulling your hair out. Practical tips, and strategies for successful relationship building that leads to closing the deal.
UiPath Test Automation using UiPath Test Suite series, part 3DianaGray10
Welcome to UiPath Test Automation using UiPath Test Suite series part 3. In this session, we will cover desktop automation along with UI automation.
Topics covered:
UI automation Introduction,
UI automation Sample
Desktop automation flow
Pradeep Chinnala, Senior Consultant Automation Developer @WonderBotz and UiPath MVP
Deepak Rai, Automation Practice Lead, Boundaryless Group and UiPath MVP
Generative AI Deep Dive: Advancing from Proof of Concept to ProductionAggregage
Join Maher Hanafi, VP of Engineering at Betterworks, in this new session where he'll share a practical framework to transform Gen AI prototypes into impactful products! He'll delve into the complexities of data collection and management, model selection and optimization, and ensuring security, scalability, and responsible use.
Encryption in Microsoft 365 - ExpertsLive Netherlands 2024Albert Hoitingh
In this session I delve into the encryption technology used in Microsoft 365 and Microsoft Purview. Including the concepts of Customer Key and Double Key Encryption.
A tale of scale & speed: How the US Navy is enabling software delivery from l...sonjaschweigert1
Rapid and secure feature delivery is a goal across every application team and every branch of the DoD. The Navy’s DevSecOps platform, Party Barge, has achieved:
- Reduction in onboarding time from 5 weeks to 1 day
- Improved developer experience and productivity through actionable findings and reduction of false positives
- Maintenance of superior security standards and inherent policy enforcement with Authorization to Operate (ATO)
Development teams can ship efficiently and ensure applications are cyber ready for Navy Authorizing Officials (AOs). In this webinar, Sigma Defense and Anchore will give attendees a look behind the scenes and demo secure pipeline automation and security artifacts that speed up application ATO and time to production.
We will cover:
- How to remove silos in DevSecOps
- How to build efficient development pipeline roles and component templates
- How to deliver security artifacts that matter for ATO’s (SBOMs, vulnerability reports, and policy evidence)
- How to streamline operations with automated policy checks on container images
GraphRAG is All You need? LLM & Knowledge GraphGuy Korland
Guy Korland, CEO and Co-founder of FalkorDB, will review two articles on the integration of language models with knowledge graphs.
1. Unifying Large Language Models and Knowledge Graphs: A Roadmap.
https://arxiv.org/abs/2306.08302
2. Microsoft Research's GraphRAG paper and a review paper on various uses of knowledge graphs:
https://www.microsoft.com/en-us/research/blog/graphrag-unlocking-llm-discovery-on-narrative-private-data/
Smart TV Buyer Insights Survey 2024 by 91mobiles.pdf91mobiles
91mobiles recently conducted a Smart TV Buyer Insights Survey in which we asked over 3,000 respondents about the TV they own, aspects they look at on a new TV, and their TV buying preferences.
LF Energy Webinar: Electrical Grid Modelling and Simulation Through PowSyBl -...DanBrown980551
Do you want to learn how to model and simulate an electrical network from scratch in under an hour?
Then welcome to this PowSyBl workshop, hosted by Rte, the French Transmission System Operator (TSO)!
During the webinar, you will discover the PowSyBl ecosystem as well as handle and study an electrical network through an interactive Python notebook.
PowSyBl is an open source project hosted by LF Energy, which offers a comprehensive set of features for electrical grid modelling and simulation. Among other advanced features, PowSyBl provides:
- A fully editable and extendable library for grid component modelling;
- Visualization tools to display your network;
- Grid simulation tools, such as power flows, security analyses (with or without remedial actions) and sensitivity analyses;
The framework is mostly written in Java, with a Python binding so that Python developers can access PowSyBl functionalities as well.
What you will learn during the webinar:
- For beginners: discover PowSyBl's functionalities through a quick general presentation and the notebook, without needing any expert coding skills;
- For advanced developers: master the skills to efficiently apply PowSyBl functionalities to your real-world scenarios.
Elevating Tactical DDD Patterns Through Object CalisthenicsDorra BARTAGUIZ
After immersing yourself in the blue book and its red counterpart, attending DDD-focused conferences, and applying tactical patterns, you're left with a crucial question: How do I ensure my design is effective? Tactical patterns within Domain-Driven Design (DDD) serve as guiding principles for creating clear and manageable domain models. However, achieving success with these patterns requires additional guidance. Interestingly, we've observed that a set of constraints initially designed for training purposes remarkably aligns with effective pattern implementation, offering a more ‘mechanical’ approach. Let's explore together how Object Calisthenics can elevate the design of your tactical DDD patterns, offering concrete help for those venturing into DDD for the first time!
3. Why This Report?
The emergence of grid storage is expected to facilitate greater renewable energy generation and
promote the evolution of a smarter electrical grid. While some studies have reported on the feasibility
and economics behind the variousgrid storage technologies such as lithium ion or compressed air energy
storage, critical questions concerning suitability, installation costs, and opportunities remain
unanswered. In this report, ClearSky Advisors provides not only a comprehensive analysis of key grid
storage technologies and applications but also a detailed forecast for their growth.
Executive Summary
As jurisdictions around the world set ambitious goals for the proportion of electricity that will be
generatedbyvariablerenewablesourcessuchaswindandsolar,utilitiesandgridoperatorsarebecoming
increasingly aware of the challenges that this new generation will pose to existing grid infrastructure.
One of the primary ways to mitigate these challenges is to incorporate more storage capability on the
grid to:
a) dispatch renewable generation during times of high demand
b) provide a more steady and smooth source of electricity that does not tax existing grid
infrastructure
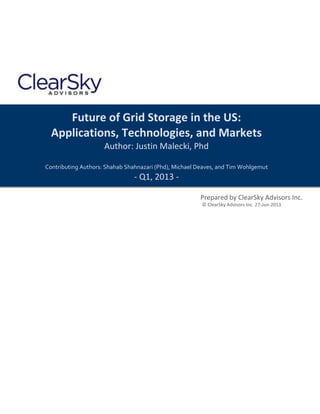
As of Q1, 2013 there is 20,738MW of grid storage power capacity servicing the US grid. Currently the
majority of this storage power capacity (99%) is comprised of pumped hydro storage. While pumped
hydro willcontinue to playa large role in energy storage,ClearSkyAdvisorsexpects that the next 10years
will see three-fold higher installations of non-traditional mechanical and battery-based storage
technology than traditional pumped storage.
Grid Storage Technologies:
1. Pumped Hydro Storage
2. Non-traditional Mechanical Storage
a. Flywheel
b. Compressed Air Energy Storage
3. Battery Storage
a. Advanced Lead Acid
b. Lithium Ion
c. Zinc Bromine
d. Sodium Sulfur
Grid Storage Applications:
1. Distributed Energy Storage Systems
2. Commercial and Industrial Applications
3. Transmission and Distribution Support
4. Frequency Regulation
5. Bulk Storage Applications
Applications can be combined in order to form systems
capable of performing multiple tasks (e.g., wholesale
energy arbitrage with regulation, local capacity, and
transmission benefits)
Pumped
99%
Battery and
Non-
traditional
Mechanical
1%
Current US Grid Storage Power Capacity
(MW)
Pumped
73%
Battery and
Non-
traditional
Mechanical
27%
2022 US Grid Storage Power Capacity
(MW)
4. The forecast data presented in this report is based on analysis using ClearSky Advisors’ Dynamic
Forecasting Tool (DFT). The DFT is a proprietary model designed to calculate the economic viability of
electricity generation or storage technology in a given region, and based on that economic calculation,
determine the volume of adoption of that technology within the region. The DFT is informed by more
than 140 inputs describing average current local conditions for a particular technology and grid
application, policy rules that influence the economic attractiveness of facilities, and assumptions for how
these factors will change over the course of the forecast period.
Using the DFT, ClearSky Advisors has modeled 189 different scenarios across:
13 different grid storage applications
9 different technologies
3 different scenario classes (High, Expected, and Low)
Combining these modeling scenarios into three broad categories and incorporating the schedule of
known planned projects results in a 10-year forecast of 28.2 – 47.0 GW of grid storage power capacity by
2022. The 10-year compound annual growth rates (CAGR) for each scenario are:
9.3% - High Case
6.3% - Expected Case
3.4% - Low Case
Excluding the pumped hydro market, the growth rates (CAGR) for each scenario will result in an increase
to between 37.9%-45.3%. The following graph shows the annual installations for the expected case
scenario. Complete segmentation of this data by technology and application can be found in the full
report.
Due to their flexibility, we anticipate that over the 10-year forecast period, market opportunities for
battery technologies (i.e., advanced lead acid, lithium ion, and zinc bromine) will be greater than those
for mechanicaltechnologies(i.e.,pumpedhydro, and compressedair energystorage). ClearSky Advisors
expects that overall growth in this sector will continue to accelerate beyond 2022.
Segmentation:
1. Advanced lead acid
2. Lithium ion
3. Zinc bromine
4. Sodium sulfur
5. Vanadium redox
6. Flywheel
7. Compressed air
energy storage
(above ground)
8. Compressed air
energy storage
(below ground)
9. Pumped Hydro
0
1,000
2,000
3,000
4,000
5,000
2013 2014 2015 2016 2017 2018 2019 2020 2021 2022
(MW)
Annual US Grid Storage Installations - Expected
5. The modeling scenarios also consider the market opportunities for grid storage facilities with individual
grid applications as well as facilities comprised of multiple/combination applications. The following two
graphs show the modeled expected case annual installations for each. Complete segmentation by
combination application and individual application can be found in the full report.
With greater revenue opportunities,
combination applications are more
economically viable but have greater local
requirements (i.e., there are fewer locations
requiring such combinations of grid storage
services). As a result, markets for combination
applications are expected to take off early but
will become saturated more quickly compared
with individual applications.
There are numerous factors that will determine
precisely how US grid storage markets will
evolve over the next 10 years. The following
table summarizes the primary factors currently
driving and restraining grid storage markets.
0
500
1,000
1,500
2,000
2013 2014 2015 2016 2017 2018 2019 2020 2021 2022
(MW)
Combination Storage Applications - Expected
0
1,000
2,000
3,000
4,000
2013 2014 2015 2016 2017 2018 2019 2020 2021 2022
(MW)
Individual Storage Applications - Expected
Grid Storage Markets: Drivers and Restraints
Drivers Impact
Increasing Renewable Generation High
Government Funding High
Deregulation of Electricity Markets Moderate
Location Flexibility Low
Restraints
High Capital Cost High
Unproven Technology High
Decreasing Cost of Gas Generation Moderate
Lack of Storage Specific Permitting/Regulation Low
Segmentation:
1.Distributed energy storage system
commercial and industrial customers
with local capacity benefits
2.Stationary transmission and distribution
support with regulation, local capacity
and deferral benefits
3.Transportable transmission and
distribution support with regulation, local
capacity and deferral benefits
4.Wholesale arbitrage with regulation, local
capacity and transmission benefits
5.Commercial and industrial energy
management with distribution benefits
Segmentation:
1. Distributed energy storage system
commercial and industrial customers
2. Commercial industrial energy
management
3. Transportable transmission and
distribution support
4. Stationary transmission and
distribution support
5. Wholesale arbitrage
6. Commercial and industrial 4-hour
reliability
7. Wholesale frequency regulation
8. Remote wind
6. Table of Contents
ABOUT THIS REPORT..........................................................................................................................1
WHY THIS REPORT?............................................................................................................................2
EXECUTIVE SUMMARY .......................................................................................................................2
LIST OF FIGURES.................................................................................................................................7
LIST OF TABLES ..................................................................................................................................8
LIST OF COMPANIES MENTIONED IN THIS REPORT..............................................................................9
1. INTRODUCTION ........................................................................................................................10
KEY FINDINGS ...........................................................................................................................................12
2. GRID STORAGE MARKET DRIVERS AND RESTRAINTS..................................................................13
DRIVERS....................................................................................................................................................13
RESTRAINTS ..............................................................................................................................................14
3. GRID STORAGE APPLICATIONS ..................................................................................................16
MAXIMUM MARKET POTENTIAL..................................................................................................................20
4. GRID STORAGE TECHNOLOGIES.................................................................................................22
MARKET PENETRATION..............................................................................................................................24
Pumped Hydro Storage Projects .........................................................................................................24
Demonstration Projects Funded by the Department of Energy..........................................................26
CHARACTERISTICS OF GRID STORAGE TECHNOLOGIES .................................................................................27
Distributed Energy Storage Systems for Commercial & Industrial Customers....................................28
Commercial & Industrial Electricity Reliability & Management..........................................................28
Transmission & Distribution Support ..................................................................................................28
Frequency Regulation..........................................................................................................................29
Bulk Storage........................................................................................................................................29
5. GRID STORAGE MARKET FORECAST...........................................................................................30
FORECAST SUMMARY ................................................................................................................................30
MODEL ANALYSIS: APPLICATION & TECHNOLOGY SEGMENTATION ..............................................................33
Combination Applications...................................................................................................................34
Individual Applications........................................................................................................................38
DISCUSSION ..............................................................................................................................................43
The interplay of combination and individual applications..................................................................43
The role of technological innovation...................................................................................................43
The dominance of battery technology ................................................................................................44
6. MARKET VALUE ........................................................................................................................45
7. CONCLUSIONS AND RECOMMENDATIONS.................................................................................47
APPENDIX A – FORECAST METHODOLOGY ........................................................................................49
APPENDIX B – DETAILED MODEL SEGMENTATION.............................................................................51
DISTRIBUTED ENERGY STORAGE SYSTEMS FOR COMMERCIAL & INDUSTRIAL CUSTOMERS .............................51
Distributed Energy Storage System Supporting Commercial/Industrial Customers with Local Capacity
Support................................................................................................................................................53
Distributed Energy Storage System Supporting Commercial/Industrial Customers ...........................54
Safety Concerns Low
7. COMMERCIAL & INDUSTRIAL ELECTRICITY RELIABILITY & MANAGEMENT.......................................................56
Commercial/Industrial Energy Management with Distribution Benefits............................................58
Commercial & Industrial Energy Management...................................................................................59
TRANSMISSION & DISTRIBUTION SUPPORT..................................................................................................62
Stationary Transmission & Distribution Support with Regulation, Local Capacity, and Deferral
Benefits ...............................................................................................................................................64
Transportable Transmission & Distribution Support with Regulation, Local Capacity, and Deferral
Benefits ...............................................................................................................................................65
FREQUENCY REGULATION..........................................................................................................................68
Wholesale Frequency Regulation........................................................................................................70
BULK STORAGE .........................................................................................................................................72
Wholesale Energy Arbitrage with Regulation, Local Capacity, and Transmission Benefits................74
Wholesale Arbitrage ...........................................................................................................................75
APPENDIX C – COMPANY PROFILES ..................................................................................................78
Disclaimer
The materials ClearSky Advisors Inc. (ClearSky Advisors) provides to the client will reflect ClearSky Advisors’ judgment based upon the information
available to ClearSky Advisors. ClearSky Advisors disclaims any other representations or warranties, express or implied, including without
limitation any implied warranties of merchantability, fitness for a particular purpose or non-infringement. This report is based on sources believed to
be reliable, but no independent verification has been made nor is its accuracy or completeness guaranteed.
8. List of Figures
Figure 1 - 10-Year US grid storage maximum market potential, individual applications. Source: EPRI,
Sandia National Laboratory, ClearSky Advisors ............................................................................20
Figure 2 - 10-year US grid storage maximum market potential, combination applications. Source: EPRI,
Sandia National Laboratory, ClearSky Advisors ............................................................................20
Figure 3 - Current US grid storage power capacity. Source: EPRI, Sandia National Laboratory, ClearSky
Advisors ........................................................................................................................................24
Figure 4 - Cumulative US grid storage installations............................................................................... 31
Figure 5 - Annual US grid storage installations...................................................................................... 33
Figure 6 - Cumulative installations: combination applications............................................................... 34
Figure 7 - Forecast of modeled combination applications, application segmentation ........................... 36
Figure 8 - Forecast of modeled combination applications, technology segmentation........................... 38
Figure 9 - Cumulative installations: individual applications ...................................................................39
Figure 10 - Forecast of individual applications, application segmentation.............................................40
Figure 11 - Forecast of individual applications, technology segmentation.............................................42
Figure 12 - Annual market value, overall forecast..................................................................................46
Figure 13 - Installation cost assumptions for distributed energy storage systems ................................. 51
Figure 14 - Installation forecast: distributed energy storage systems for commercial/industrial
customers with local capacity applications.................................................................................... 53
Figure 15 - Installation forecast: distributed energy storage systems for commercial/industrial
customers .....................................................................................................................................54
Figure 16 - Installation cost assumptions for commercial/industrial applications ..................................56
Figure 17 - Installation forecast: commercial/industrial energy management with distribution benefits58
Figure 18 - Installation forecast: commercial/industrial energy management .......................................59
Figure 19 - Installation cost assumptions for transmission & distribution support applications .............62
Figure 20 - Installation forecast: stationary transmission & distribution support with regulation, local
capacity, and deferral benefits ......................................................................................................64
Figure 21 - Installation forecast: transportable transmission & distribution support with regulation, local
capacity, and deferral benefits ......................................................................................................65
Figure 22 - Installation cost assumptions for frequency regulation applications....................................68
Figure 23 - Installation forecast: wholesale frequency regulation.......................................................... 70
Figure 24 - Installation cost assumptions for bulk storage applications................................................. 72
Figure 25 - Installation forecast: wholesale energy arbitrage with regulation, local capacity, and
transmission benefits .................................................................................................................... 74
Figure 26 - Installation forecast: wholesale energy arbitrage ................................................................ 75
9. List of Tables
Table 1 - Grid Storage Markets: Drivers and Restraints ............................................................................13
Table 2 - Most valuable grid storage applications .....................................................................................17
Table 3 - Other grid storage applications...................................................................................................17
Table 4 - Multiple grid storage applications...............................................................................................18
Table 5 - Present value of grid storage benefits. Source: EPRI.................................................................19
Table 6 - Most feasible grid storage technologies.....................................................................................23
Table 7 - Pumped hydro storage projects in the US. Source: FERC .........................................................25
Table 8 - Demonstration projects funded by the US DOE.........................................................................27
Table 9 - Technology characteristics for distributed energy storage systems. Source: EPRI, ClearSky
Advisors. .............................................................................................................................................28
Table 10 - Technology characteristics for commercial & industrial electricity reliability & management.
Source: EPRI, ClearSky Advisors........................................................................................................28
Table 11 - Technology characteristics for transmission and distribution support. Source: EPRI, ClearSky
Advisors. .............................................................................................................................................29
Table 12 - Technology characteristics for frequency regulation. Source: EPRI, ClearSky Advisors........29
Table 13 - Technology characteristics for bulk storage. Source: EPRI, ClearSky Advisors. .....................29
Table 14 - Financial parameters assumed in model...................................................................................49
Table 15 - DESS - Installation Cost Assumptions.......................................................................................52
Table 16 - Distributed Energy Storage System Supporting Commercial/Industrial Customers with Local
Capacity Support - Annual Installations.............................................................................................55
Table 17 - Distributed Energy Storage System Supporting Commercial/Industrial Customers - Annual
Installations.........................................................................................................................................55
Table 18 - Commercial/Industrial - Installations Cost Assumptions..........................................................57
Table 19 - Commercial/Industrial Energy Management with Distribution Benefits - Annual Installations
............................................................................................................................................................60
Table 20 - Commercial and Industrial Energy Management - Annual Installations..................................61
Table 21 - Transmission and Distribution Support - Installation Cost Assumptions.................................63
Table 22 - Stationary Transmission and Distribution Support with Regulation, Local Capacity, and
Deferral Benefits - Annual Installations .............................................................................................66
Table 23 - Transportable Transmission and Distribution Support with Regulation, Local Capacity, and
Deferral Benefits - Annual Installations .............................................................................................67
Table 24 - Frequency Regulation - Installation Cost Assumptions............................................................69
Table 25 - Wholesale Frequency Regulation - Annual Installations ..........................................................71
Table 26 - Bulk Storage - Installation Cost Assumptions ..........................................................................73
Table 27 - Wholesale Energy Arbitrage with Regulation, Local Capacity, and Transmission Benefits -
Annual Installations............................................................................................................................76
Table 28 - Wholesale Arbitrage - Annual Installations ..............................................................................77
10. List of Companies mentioned in this Report
List of Companies mentioned in this Report
1. A123 26.Energy Storage & Power LLC
50. Nippon Chemi-Con
Corporation
2. Active Power 27. Enersys 51. Nrstor
3. AES Energy Storage 28.EnerVault 52. Panasonic Corporation
4. Alstom 29.Eos Energy Storage 53. Plug Power
5. Altairnano Technologies 30. Exide Technologies 54. Powerthru
6. Amber Kinetics 31. FireFly International Energy Co.
55. Premium Power
Corporation
7. Andritz 32. General Compression Inc. 56.Primus Power
8. Aquion Energy 33. General Electric Company 57. Prudent Energy
9. Ashlawn Energy 34. Gravity Power 58. RedFlow Ltd.
10. Axion Power International 35. GS Yuasa Corporation 59.Saft Batteries
11. Beacon Power Corporation
(bankrupt)
36. Heart Transverter 60.Samsung SDI
12. Black & Veatch 37. Highview Power Storage 61. Seeo
13. Bright Energy Storage
Technologies
38. Hitachi Ltd. 62.Siemens Energy
14. BYD Company Ltd. 39. Hydrogenics 63. Sony Corporation
15. C&D Technologies 40.Hydrostor
64.Sumitomo Electric
Industries Ltd.
16. Celestica 41. Isentropic Ltd. 65.SustainX
17. CellStrom GmbH 42.Johnson Controls 66.Temporal Power
18. China National Electric
Equipment Corporation
43. LG Chem Ltd. 67. Ultralife Corporation
19. Deeya Energy 44.LightSail Energy 68.Valence Technology
20.Dow Kokam
45. Lithium Technology
Corporation
69.Verdant (VRDT
Corporation)
21. Dresser-Rand Group 46.Maxwell Technologies 70. Voith Hydro
22. East Penn Manufacturing
Company
47. MWH Global 71. Vycon
23. Electrovaya 48.Nesscap Energy 72. Xtreme Power
24.Ener1 49.NGK Insulators 73. ZBB Energy Corporation
25. EnerDel
11. 2013 US Grid Storage Report
ORDER FORM
License $2,495 USD
Name: ___________________________________________
Position: __________________________________________
Email: ____________________________________________
Address: __________________________________________
Company: _________________________________________
Phone: ___________________________________________
City: _____________________________________________
State/Province: ____________________________________
Postal Code/Zip: ___________________________________
Date: ____________________________________________
Signature: ________________________________________
Payment: Visa Master Card
Card Number: ____________________________________________
Expiry Date: __________/___________
Security Code: _______________
* By signing this order form and accepting delivery of this Report, you are agreeing to the accompanying
General Provisions and understand that payment is by credit card. When the payment transaction is
completed and the enclosed order form is returned, the report will be sent out.
12. TERMS AND CONDITIONS
The Reports will be provided in accordance with the General Provisions included herein. By signing this order form
and accepting delivery of the Reports, you are agreeing to the accompanying General Provisions and understand
that payment is due within acceptance of this agreement.
General Provisions: This agreement provides ad non-exclusive license, subject to the restrictions below, is non-
assignable, and does not grant you any right to permit third parties (including, without limitation consultants,
independent contractors, investors, partners, subsidiaries, affiliates, or parent companies) to use the Reports.
ClearSky Advisors Inc. will retain all ownership rights, including but not limited to rights in intangibles and
copyrights, in all Reports and other materials we provide you.
You acknowledge that the Reports and our responses to your inquiries will contain non-public, proprietary
information (including, without limitation, our study data and methodology), and you agree that such information
will be held and maintained in confidence not disclosed to parties outside your organization or Authorized Location
(s) (if applicable) and will be used only for the purposes set forth above. Without limiting the foregoing, you agree
that you will not disclose the Reports or any other material you receive from us with your partners or outside
consultants. You further agree you will use reasonable care to maintain the confidentiality of such information,
provided that such care shall be at least as great as the precautions you take to protect your own confidential
information. In addition you agree that you will a) use the same degree of care for maintaining the confidentiality
of passwords that govern electronic access to the Reports as you do for your confidential information, b) only
permit access to the Reports by employees at the Authorized Location (s) if this is a Corporate License, and c) not
permit unauthorized users to access the Reports. Neither the Reports, nor the information contained therein, nor
the ClearSky Advisors name or any ClearSky Advisors trademark, may be used in whole or in part for advertising,
for reference or inclusion in investor materials, or any other purpose without our prior permission in writing.
We shall only be liable to you under this Agreement for direct damages and we shall have no liability for you for
indirect, consequential, special, or punitive damages. Our aggregate liability to you for all matters and claims
arising out of or relating to this Agreement or the Reports or other materials or services provided by ClearSky
Advisors to you shall not exceed the amount that you paid to us under this Agreement in the 6-month period prior
to the occurrence of the claim.
The material we provide and responses to the inquiries will reflect our judgment based upon the information
available to us. We disclaim any other representations or warranties, express or implied or statutory, including
without limitation any implied warranties of merchantability, or fitness for a particular purpose.
This agreement shall be interpreted according to the laws of the Province of Ontario, exclusive of its principles of
conflicts of law. All lawsuits and other proceedings relating to this Agreement or ClearSky Advisors’ services shall
be brought in the courts in the Province of Ontario. If you are using a purchase order to acquire ClearSky Advisors’
research, both parties agree that the terms of these General Provisions shall govern and that any terms in the
Purchase Order shall not apply. This Agreement represents the entire agreement between you and us related to
the subject matter hereof and superseded and prior or contemporaneous communications.
Contact:
Jon Winberg Account Manager – jwinberg@clearskyadvisors.com
Office (877) 333-5821
Cell (647) 909-4930