Recommended
PPTX
2014 оны МУ-ын нийгэм, эдийн засгийн байдал
PPTX
2012 оны МУ-ын нийгэм, эдийн засгийн байдал
PPTX
2012 оны МУ-ын нийгэм, эдийн засгийн байдал
PPTX
Орхон аймгийн эдийн засаг, нийгмийн хөгжлийн танилцуулга 2015 оны 3-р сарын б...
PDF
2015 оны Монгол улсын нийгэм, эдийн засгийн байдал
PPTX
PDF
PDF
PDF
Ediin zasgiin hychin zyil
PPTX
PDF
В.Энхболд /ОУ-ын эдийн засгийн ухааны доктор /
PPTX
PPTX
Hevlel baga hural_2015.06.15-last
PPTX
PPTX
PPTX
Hevlel baga hural_2015.07.7-last
PDF
PPTX
PPTX
PPTX
Hevlel baga hural_2015.06.15
PPTX
Hevlel baga hural_2015.06.15-2-last
PPTX
Hevlel baga hural_2015.06.15 Orkhon
PPTX
Hevlel baga hural_2015.01.16
PDF
2014, REPORT, Annual Risk Management Forum Report , Mandal
PDF
Монгол улсын 2013 оны төсвийн төсөл, www.gelegjamts.blogspot.com, http://www....
PDF
PDF
ХҮИ тооцох аргачлал жишээ
PDF
Статистикийн үндсэн аргууд түүний хэрэглээ
PDF
PPT
More Related Content
PPTX
2014 оны МУ-ын нийгэм, эдийн засгийн байдал
PPTX
2012 оны МУ-ын нийгэм, эдийн засгийн байдал
PPTX
2012 оны МУ-ын нийгэм, эдийн засгийн байдал
PPTX
Орхон аймгийн эдийн засаг, нийгмийн хөгжлийн танилцуулга 2015 оны 3-р сарын б...
PDF
2015 оны Монгол улсын нийгэм, эдийн засгийн байдал
PPTX
PDF
PDF
What's hot
PDF
Ediin zasgiin hychin zyil
PPTX
PDF
В.Энхболд /ОУ-ын эдийн засгийн ухааны доктор /
PPTX
PPTX
Hevlel baga hural_2015.06.15-last
PPTX
PPTX
PPTX
Hevlel baga hural_2015.07.7-last
PDF
PPTX
PPTX
PPTX
Hevlel baga hural_2015.06.15
PPTX
Hevlel baga hural_2015.06.15-2-last
PPTX
Hevlel baga hural_2015.06.15 Orkhon
PPTX
Hevlel baga hural_2015.01.16
PDF
2014, REPORT, Annual Risk Management Forum Report , Mandal
PDF
Монгол улсын 2013 оны төсвийн төсөл, www.gelegjamts.blogspot.com, http://www....
PDF
Viewers also liked
PDF
ХҮИ тооцох аргачлал жишээ
PDF
Статистикийн үндсэн аргууд түүний хэрэглээ
PDF
PPT
PPT
DOCX
PPT
PPSX
PPTX
PPT
DOCX
PDF
статистик түүхэн хөгжлөөс
PPT
DOCX
DOCX
PDF
PDF
DOCX
DOC
Similar to 2013 оны МУ-ын нийгэм, эдийн засгийн байдал
PPTX
Aj ahui negj baiguullagiin sariin dundaj
PPTX
Орхон аймгийн эдийн засаг, нийгмийн хөгжлийн танилцуулга 1-р улирлын байдлаар
PDF
PDF
Эдийн засаг, санхүүгийн салбарын тойм
PDF
Б.Цэрэнчунт - Монгол улсын ЖДҮ-ийн хөгжлийн индекс
PDF
PPTX
PPTX
2 р хорооны засаг даргын ү.а-ны мэдээлэл
PDF
PPT
PPTX
PPTX
PPTX
Hevlel baga hural_2015.05.11-last
PDF
PPT
PDF
PDF
Statistical comparison of mongolian gobi region
PPTX
PDF
Sukhbaatar taniltsuulga 6
PPTX
More from Tuul Tuul
PDF
PDF
PDF
PDF
PPT
Income Inequality and Poverty
PDF
PDF
PDF
PDF
PDF
PDF
PDF
PPT
The Theory of Consumer Choice
PDF
PDF
PDF
PDF
PDF
PPT
Earnings and Discrimination
PDF
2013 оны МУ-ын нийгэм, эдийн засгийн байдал 1. 2. МУ-ЫН НИЙГЭМ, ЭДИЙН ЗАСГИЙН БАЙДАЛ - Үндсэн үзүүлэлт
2012 2013
2012
2011
2013
2012
I. Нийгмийн статистикийн үзүүлэлт
% %
Төрсөн хүүхдийн тоо (амьд төрөлт) 74 778 79 780 106.0 106.7
1000 хүн амд ногдох төрөлт 26.0 28.2 108.0 108.5
1000 хүн амд ногдох нас баралт 6.3 5.7 88.4 90.5
Бүртгэлтэй ажилгүйчүүдийн тоо,
12 дугаар сарын эцэст
35 776 42 772 62.6 119.6
Халдварт өвчнөөр өвчлөгчдийн тоо 43 305 37 320 101.5 86.2
Бүртгэгдсэн гэмт хэргийн тоо 22 089 25 362 115.1 114.8
3. МУ-ЫН НИЙГЭМ, ЭДИЙН ЗАСГИЙН БАЙДАЛ - Үндсэн үзүүлэлт
2012 2013
2012
2011
2013
2012
II. Макро эдийн засгийн статистикийн үзүүлэлтүүд
Хэрэглээний үнийн улсын индексийн өөрчлөлт, жилийн эцэст, хувиар 14.0 12.5 - -
Мөнгө М2* 12 дугаар сарын эцэст, тэрбум төг 7 617.2 9 451.0 118.8 124.1
Валютын зах зээлийн нэрлэсэн ханш, 12 дугаар сарын дундаж, 1
ам.доллар=төгрөг*
1 396.1 1 674.6 101.6 119.9
Улсын нэгдсэн төсвийн тэнцвэржүүлсэн нийт тэнцэл ,тэрбум төг -1 130.7 -297.3 146.9
26.3
Улсын нэгдсэн төсвийн урсгал орлого, тэрбум төг 4 828.0 5 879.0 114.6 121.8
Улсын нэгдсэн төсвийн урсгал зарлага, тэрбум төг 4 404.1 4 559.3 136.1 103.5
Улсын нэгдсэн төсвийн тэнцвэржүүлсэн урсгал тэнцэл, тэрбум төг 423.9 1 319.7 43.4 311.3
Экспорт, сая ам.долл 4 384.7 4 272.7 91.0 97.4
Импорт, сая ам.долл 6 738.4 6.354.7 102.1 94.3
Гадаад худалдааны тэнцэл, сая ам.долл -2 353.7 -2 082.0 132.2 88.5
* Тайлбар: Урьдчилсан гүйцэтгэлээр
% %
4. МУ-ЫН НИЙГЭМ, ЭДИЙН ЗАСГИЙН БАЙДАЛ - Үндсэн үзүүлэлт
* Тайлбар: Урьдчилсан гүйцэтгэлээр
2012 2013
2012
2011
2013
2012
III. Эдийн засгийн статистикийн үзүүлэлтүүд
% %
Нийт малын тоо, оны эцэст, сая толгой 40.9 45.1 112.7 110.3
Бойжуулсан төл, мян.толгой 13 379.0 15 215.5 106.7 113.7
Хорогдсон том мал, мян.толгой 428.9 792.5 65.9 184.8
Тариалсан талбай, га
-Үр тариа 306 234.8 293 261.8 102.1 95.8
-Төмс 16 820.7 15 503.2 109.4 92.2
-Хүнсний ногоо 7 854.2 8 311.3 100.8 105.8
Хураасан ургац, мян.тонн
-Үр тариа 479.3 387.0 107.4 80.8
-Төмс 245.9 191.6 122.0 77.9
-Хүнсний ногоо 98.9 101.8 99.9 102.9
5. МУ-ЫН НИЙГЭМ, ЭДИЙН ЗАСГИЙН БАЙДАЛ - Үндсэн үзүүлэлт
* Тайлбар: Урьдчилсан гүйцэтгэлээр
2012 2013
2012
2011
2013
2012
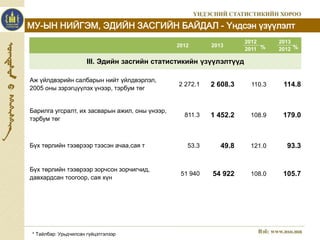
III. Эдийн засгийн статистикийн үзүүлэлтүүд
Аж үйлдвэрийн салбарын нийт үйлдвэрлэл,
2005 оны зэрэгцүүлэх үнээр, тэрбум төг
% %
2 272.1 2 608.3 110.3 114.8
Барилга угсралт, их засварын ажил, оны үнээр,
тэрбум төг
811.3 1 452.2 108.9 179.0
Бүх төрлийн тээврээр тээсэн ачаа,сая т 53.3 49.8 121.0 93.3
Бүх төрлийн тээврээр зорчсон зорчигчид,
давхардсан тоогоор, сая хүн
51 940 54 922 108.0 105.7
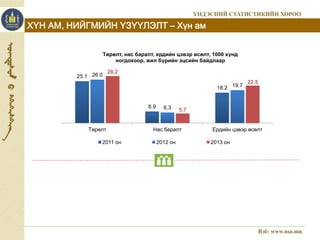
6. ХҮН АМ, НИЙГМИЙН ҮЗҮҮЛЭЛТ – Хүн ам
25.1
Төрөлт, нас баралт, ердийн цэвэр өсөлт, 1000 хүнд
ногдохоор, жил бүрийн эцсийн байдлаар
6.9
18.2
26.0
6.3
19.7
28.2
5.7
22.5
Төрөлт Нас баралт Ердийн цэвэр өсөлт
2011 он 2012 он 2013 он
7. ХҮН АМ, НИЙГМИЙН ҮЗҮҮЛЭЛТ – Боловсрол
841.1
Бүх шатны сургуульд суралцагчид
хичээлийн жилийн эхэнд, мян.хүн
850.5
890.6
897.9
907.6
2009/2010 2010/2011 2011/2012 2012/2013 2013/2014
Бүх шатны сургуулийг төгсөгчид,
89.0
107.0
86.7
90.2
11.2
15.1
23.1
23.4
35.8
34.2
37.7
37.2
2011/2012
2010/2011
2009/2010
мян.хүн
ЕБС МСҮТ Их, дээд сургууль, коллеж
34
Нэг багшид ногдох сурагчдын тоо
19
23 24
33
19 20
24
33
18 17
24
Цэцэрлэг ЕБС МСҮТ Их, дээд сургууль, коллеж
2011/2012 2012/2013 2013/2014
8. ХҮН АМ, НИЙГМИЙН ҮЗҮҮЛЭЛТ - Хөдөлмөр
Хөдөлмөрийн хэлтэст шинээр бүртгүүлсэн болон
ажилд зуучлагдан орсон иргэд, жил бүрийн
эцсийн байдлаар
Бүртгэлтэй ажилгүй иргэд, боловсролын түвшнээр,
2013 оны 12 дугаар сарын эцэст
66704 61504
110052
50446
35257
65874
2011 I-XII 2012 I-XII 2013 I-XII
Шинээр бүртгүүлсэн иргэдийн тоо
Ажилд зуучлагдан орсон иргэдийн тоо
Магистр,
доктор
0.6%
Дипломын
болон
бакалаврын
27.4%
Тусгай
мэргэжлийн
дунд
8.7%
Техникийн
болон
мэргэжлийн
6.6%
Бага
2.8%
Суурь
10.2%
Бүрэн дунд
42.9%
Боловсролгүй
0.8%
54 042
Бүртгэлтэй ажилгүй иргэдийн тоо, жил бүрийн 12 дугаар сарын
71 912 74 881
45 107
55 405
63 690
49 837
39 767 38 570 40 344
эцэст
30 877 33 335 35 571 32 928 32 928 29 945 29813
38 077 38 250
57 171
35 776
42 772
1992 1993 1994 1995 1996 1997 1998 1999 2000 2001 2002 2003 2004 2005 2006 2007 2008 2009 2010 2011 2012 2013
9. ХҮН АМ, НИЙГМИЙН ҮЗҮҮЛЭЛТ – Эрүүл мэнд
Амаржсан эх, амьд төрсөн хүүхдийн тоо жил
70 328
бүрийн эцсийн байдлаар
74 474
79 371
70 576
74 778
79 780
2011 2012 2013
Амаржсан эх Амьд төрсөн хүүхэд
Эндсэн хүүхдийн тоо, жил бүрийн эцсийн байдлаар
1410 1396 1438
1152 1143 1166
2011 2012 2013
Нялхсын эндэгдэл 5 хүртэлх насандаа эндсэн хүүхэд
26 884
31 324 32 332
Халдварт өвчнөөр өвчлөгчид, жил бүрийн эцсийн байдлаар
36 221
41 082
43 739
38 859
41 373 42 839 43 305
37 320
2003 2004 2005 2006 2007 2008 2009 2010 2011 2012 2013
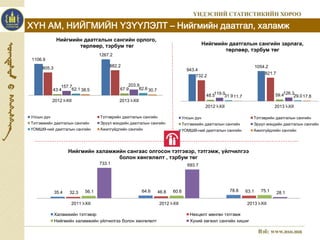
10. ХҮН АМ, НИЙГМИЙН ҮЗҮҮЛЭЛТ – Нийгмийн даатгал, халамж
1106.9
Нийгмийн даатгалын сангийн орлого,
төрлөөр, тэрбум төг
1267.2
805.3
882.2
157.7 203.9
62.1 38.5 82.6 30.7
43.4 67.9
2012 I-XII 2013 I-XII
Улсын дүн Тэтгэврийн даатгалын сангийн
Тэтгэмжийн даатгалын сангийн Эрүүл мэндийн даатгалын сангийн
ҮОМШӨ-ний даатгалын сангийн Ажилгүйдлийн сангийн
943.4
Нийгмийн даатгалын сангийн зарлага,
төрлөөр, тэрбум төг
1054.2
732.2
821.7
48.5119.0 59.4126.3
31.911.7 29.017.8
2012 I-XII 2013 I-XII
Улсын дүн Тэтгэврийн даатгалын сангийн
Тэтгэмжийн даатгалын сангийн Эрүүл мэндийн даатгалын сангийн
ҮОМШӨ-ний даатгалын сангийн Ажилгүйдлийн сангийн
Нийгмийн халамжийн сангаас олгосон тэтгэвэр, тэтгэмж, үйлчилгээ
болон хөнгөлөлт , тэрбум төг
733.1 693.7
35.4 32.3 56.1 64.6 46.8 60.6 78.8 63.1 75.1
28.1
2011 I-XII 2012 I-XII 2013 I-XII
Халамжийн тэтгэвэр Нөхцөлт мөнгөн тэтгэмж
Нийгмийн халамжийн үйлчилгээ болон хөнгөлөлт Хүний хөгжил сангийн хишиг
11. ХҮН АМ, НИЙГМИЙН ҮЗҮҮЛЭЛТ – Нийгмийн зарим үзүүлэлтүүд
Бүтэн, хагас өнчин хүүхдийн тоо,
жил бүрийн эцсийн байдлаар
36 545 36 143 35 461
4 311 4 288 4 096
2011 2012 2013
Бүтэн өнчин Хагас өнчин
Өрх толгойлсон эхийн тоо, гишүүдийн
тоогоор, жилийн эцсийн байдлаар
47 479
26 903
7 359
3 хүртэлх
гишүүнтэй
3-5 гишүүнтэй 6, түүнээс дээш
гишүүнтэй
82 865
Хөгжлийн бэрхшээлтэй хүний тоо,
жил бүрийн эцсийн байдлаар
92 263
96 325
2011 2012 2013
12. ХҮН АМ, НИЙГМИЙН ҮЗҮҮЛЭЛТ – Хилээр нэвтэрсэн зорчигчид
Монгол Улсын хилийн боомтуудаар
нэвтэрсэн нийт зорчигчид, жил бүрийн
2169. 7
эцсийн байдлаар, мян.хүн
2253.8
2257.4
2169. 9 2167.6
2176.2
2011 2012 2013
орсон гарсан
Монгол Улсын хилээр 2013 онд нэвтэрсэн
Ачааны
вагон,
28.8%
Ачааны
машин,
39.6%
Суудлын
машин,
28.8%
Суудлын
вагон,
0.8%
Бусад,
1.6%
Онгоц,
0.4%
тээврийн хэрэгсэл, хувиар
Улсын хилээр орсон жуулчдын тоо,
улсаар, жил бүрийн эцсийн байдлаар
УЛС 2011 2012 2013
2013
2012
БҮГД 460 360 475 892 417 815 87.8
АНУ 15 423 15 587 14 701 94.3
Австрали 7 093 7 480 6 765 90.4
БНАСАУ 1 072 1 012 627 62.0
БНСУ 43 994 44 360 45 178 101.8
БНХАУ 200 010 228 547 178 326 78.0
Итали 2 737 2 769 2 682 96.9
Их Британи 7 120 6 804 6 391 93.9
Казакстан 7 973 10 523 11 422 108.5
Канад 3 173 2 828 2 603 92.0
Нидерланд 3 239 2 999 2 594 86.5
Польш 1 172 1 292 1 489 115.2
ОХУ 102 738 83 707 74 468 89.0
Сингапур 1 798 1 982 1 772 89.4
Тайвань 1 864 2 288 2 005 87.6
Турк 851 1 676 2 720 162.3
Франц 7 570 7 553 7 407 98.1
ХБНГУ 8 545 8 909 9 499 106.6
Хонгконг 1 878 1 888 1 729 91.6
Швейцарь 2 564 2 730 2 648 97.0
Энэтхэг 1 478 1 340 1 519 113.4
Япон 14 988 17 119 18 178 106.2
Бусад 23 080 22 499 23 092 102.6
•Эх үүсвэр: Хил хамгаалах ерөнхий газрын мэдээ
%
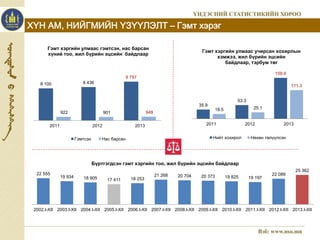
13. ХҮН АМ, НИЙГМИЙН ҮЗҮҮЛЭЛТ – Гэмт хэрэг
Гэмт хэргийн улмаас гэмтсэн, нас барсан
хүний тоо, жил бүрийн эцсийн байдлаар
8 100 8 436
2011 2012 2013
22 555
9 797
922 901 949
Гэмтсэн Нас барсан
Гэмт хэргийн улмаас учирсан хохирлын
35.9
хэмжээ, жил бүрийн эцсийн
байдлаар, тэрбум төг
53.3
18.5 25.1
2011 2012 2013
Нийт хохирол Нөхөн төлүүлсэн
Бүртгэгдсэн гэмт хэргийн тоо, жил бүрийн эцсийн байдлаар
19 934 18 905 17 411 18 253
21 268 20 704 20 373 19 825 19 197
159.0
22 089
111.3
25 362
2002.I-XII 2003.I-XII 2004.I-XII 2005.I-XII 2006.I-XII 2007.I-XII 2008.I-XII 2009.I-XII 2010.I-XII 2011.I-XII 2012.I-XII 2013.I-XII
14. МАКРО ЭДИЙН ЗАСГИЙН ҮЗҮҮЛЭЛТ – Хэрэглээний үнийн индекс
õóâü
103.0
103.5
102.7 102.5
104.3 104.7
105.6 105.2
105.9
106.7
108.1
110.2
102.7
105.4
107.6
108.2
109.2
109.7
110.4
111.1
112.2
112.9 113.1
114.0
101.8
102.8
103.6
104.8 105.1 104.7 104.9
106.6
108.1
109.7
111.1
112.5
115
112
109
106
103
100
I II III IV V VI VII VIII IX X XI XII
ñàð
Хэрэглээний үнийн улсын индекс
(өмнөх оны 12 сар =100)
2011
2012
2013
-0.2
0.1
0.2
0.3
0.4
0.5
0.7
0.7
0.8
0.8
0.9
1.0
1.0
1.0
1.2
1.2
1.2
1.3
1.5
2.7
2.8
3.0
2.0
1.0
0.0
-1.0
ХО
ДА
ЗА
ӨМ
ХӨ
СҮ
ОР
ТӨ
БУ
АР
УВ
СЭ
ӨВ
ХЭ
ДД
ГО
ДУ
ГС
ДО
БХ
БӨ
хувь
Хэрэглээний бараа, үйлчилгээний үнийн өөрчлөлтийн хувь, аймгаар, 2013
оны 12 дугаар сард (өмнөх сар = 100%)
15. МАКРО ЭДИЙН ЗАСГИЙН ҮЗҮҮЛЭЛТ - Мөнгө, зээл, үнэт цаас
Мөнгөний зарим үндсэн үзүүлэлт, оны эцэст, тэрбум төг
Үзүүлэлт 2012 XII 2013 XI 2013 XII
Мөнгөний нийлүүлэлт М2 7 617.3 9 108.7 9 451.0
Банкнаас гадуурхи мөнгө 603.9 557.7 582.1
Төгрөгийн харилцах 1 231.6 1 268.4 1 501.3
Валютын харилцах 859.1 1 233.0 974.2
Нийт хадгаламж 4 922.7 6 049.6 6 393.4
Төгрөгийн хадгаламж 3 488.0 4 639.1 4 917.2
Валютын хадгаламж 1 434.7 1 410.5 1 476.2
Зээлийн өрийн үлдэгдэл 6 990.5 10 822.4 10 769.3
Хугацаа хэтэрсэн зээл 110.6 161.1 118.2
Чанаргүй зээл 295.1 572.5 566.0
Зээлийн өрийн үлдэгдэлд хугацаа хэтэрсэн зээлийн
1.6 1.5 1.1
эзлэх хувь
Зээлийн өрийн үлдэгдэлд чанаргүй зээлийн эзлэх
хувь
4.2 5.3 5.3
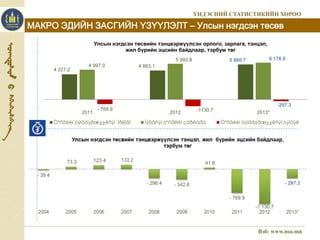
16. МАКРО ЭДИЙН ЗАСГИЙН ҮЗҮҮЛЭЛТ – Улсын нэгдсэн төсөв
4 227.2
Улсын нэгдсэн төсвийн тэнцвэржүүлсэн орлого, зарлага, тэнцэл,
жил бүрийн эцсийн байдлаар, тэрбум төг
4 863.1
5 880.7
4 997.0
5 993.8 6 178.0
- 769.9 -1130.7
-297.3
2011 2012 2013*
Òºñâèéí òýíöâýðæ¿¿ëñýí îðëîãî Íýãäñýí òºñâèéí çàðëàãà Òºñâèéí òýíöâýðæ¿¿ëñýí òýíöýë
17. МАКРО ЭДИЙН ЗАСГИЙН ҮЗҮҮЛЭЛТ – Гадаад худалдаа
Тэнцэл, голлох орнуудаар, сая ам.долл
- 2 082.0
1 887.2
154.3
- 1 499.5
- 433.6
- 494.2
- 508.8
Япон
БНСУ
АНУ
ОХУ
Их Британи
БНХАУ
Нийт тэнцэл
Экспортолсон зарим эрдэс бүтээгдэхүүн, жил бүрийн эцсийн байдлаар, мян.т
2011 2012 2013*
Нүүрс 21 296.0 20 915.5 18 367.5
Зэсийн баяжмал 575.9 574.3 649.8
Төмрийн хүдэр 5 802.0 6 415.9 6 724.5
Боловсруулаагүй газрын тос (мян.баррел) 2 553.7 3 568.0 5 243.8
Цайрын хүдэр, баяжмал 121.2 140.9 130.9
Боловсруулаагүй болон хагас боловсруулсан алт (т) 2.6 2.8 7.6
18. МАКРО ЭДИЙН ЗАСГИЙН ҮЗҮҮЛЭЛТ – Бизнес регистрийн сан
Бизнес регистрийн санд бүртгэлтэй, үйл ажиллагаа явуулж байгаа аж ахуйн нэгж, байгууллагын тоо,
эдийн засгийн үйл ажиллагааны салбарын ангилал, ажиллагчдын тооны бүлгээр, жил бүрийн эцэст
Салбар 2011* 2012 2013
Ажиллагчдын тооны бүлэг
1-9 10-19 20-49 50+
Бүгд 48 086 51 940 54 922 46 344 3 788 2 988 1 802
Хөдөө аж ахуй, ан агнуур, ойн аж ахуй,
2 507 2 878 3 148 2 754 287 90 17
загас барилт
Уул уурхай, олборлох үйлдвэр 383 430 413 234 64 54 61
Боловсруулах аж үйлдвэр 4 143 4 492 4 295 3 542 370 224 159
Цахилгаан, хий, үйлдвэрлэл, ус
219 242 234 87 60 30 57
хангамж
Барилга 2 831 3 136 3 560 2 662 377 351 170
Бөөний болон жижиглэн худалдаа, гэр
ахуйн барааны засварлах үйл
15 897 19 765 20 902 19 882 553 300 167
ажиллагаа
Зочид буудал, зоогийн газар 1 899 1 965 1 998 1 729 161 69 39
Тээвэр, агуулахын аж ахуй, холбоо 1 895 1 812 1 975 1 647 141 95 92
Санхүүгийн гүйлгээ хийх үйл ажиллагаа 1 564 1 561 1 587 1 503 33 22 29
Үл хөдлөх, хөрөнгө, түрээс, бизнесийн
бусад үйл ажиллагаа
5 092 4 956 6 228 5 424 386 238 180
Төрийн удирдлага, батлан хамгаалах,
албан журмын нийгмийн даатгалын үйл
ажиллагаа
1 407 2 043 1 572 615 302 433 222
Боловсролын салбарын үйл ажиллагаа 2 790 2 528 2 558 995 480 618 465
Эрүүл мэнд, нийгмийн халамжийн үйл
2 569 2 525 2 667 1 958 310 325 74
ажиллагаа
Нийгэм, бие хүнд үзүүлэх бусад
үйлчилгээ
4 873 3 594 3 769 3 300 264 138 67
Олон улсын байгууллагын үйл
ажиллагаа
17 13 16 12 - 1 3
19. МАКРО ЭДИЙН ЗАСГИЙН ҮЗҮҮЛЭЛТ – Хөдөө аж ахуй
Малын тоо, 2013 онд, аймаг, нийслэлээр,
329.1
279.1
272.8
179.0
3 772.3
3 609.2
3 573.0
2 987.1
2 875.3
2 539.0
2 491.4
2 241.3
2 225.1
2 223.2
1 653.3
1 586.9
1 516.4
1 314.2
1 220.1
1 996.3
2 757.2
3 486.0
Архангай
Хөвсгөл
Төв
Өвөрхангай
Баянхонгор
Хэнтий
Булан
Завхан
Сүхбаатар
Ховд
Увс
Говь-Алтай
Дундговь
Өмнөговь
Баян-Өлгий
Дорноговь
Сэлэнгэ
Дорнод
Уланбаатар
Дархан-Уул
Говьсүмбэр
Орхон
мян.тол
Малын тоо, төрлөөр, улсын дүнгээр, 2009-
2013 оны байдлаар, мян.тол
2009 2010 2011 2012 2013
Бүгд 44 023.9 32 729.5 36 335.8 40 920.9 45 127.2
Тэмээ 277 269.6 280.1 305.8 321.5
Адуу 2 221.3 1 920.3 2 112.9 2 330.4 2 618.5
Үхэр 2 599.3 2 176.0 2 339.7 2 584.6 2908.5
Хонь 19 274.7 14 480.4 15 668.5 18 141.4 20 060.3
Ямаа 19 651.5 13 883.2 15 934.6 17 558.7 19 218.5
20. МАКРО ЭДИЙН ЗАСГИЙН ҮЗҮҮЛЭЛТ – Хөдөө аж ахуй
Тариалсан талбай, 2011-2013 оны байдлаар мян.га
201.6
245.9
191.6
446.1
479.3
99.0 98.9 101.8
387.0
600.0
500.0
400.0
300.0
200.0
100.0
0.0
2011 2012 2013
Төмс Хүнсний ногоо Үр тариа
Хураасан ургац, 2011-2013 оны байдлаар мян.т
299.9 306.2 293.3
15.4 7.8 16.8 7.9 15.5 8.3
2011 2012 2013
Төмс Хүнсний ногоо Үр тариа
21. МАКРО ЭДИЙН ЗАСГИЙН ҮЗҮҮЛЭЛТ – Аж үйлдвэр
Аж үйлдвэрийн салбарын нийт үйлдвэрлэл,
2005 оны зэрэгцүүлэх үнээр, тэрбум төг
Аж үйлдвэрийн салбар 2011 2012 2013
Аж үйлдвэрийн салбарын нийт бүтээгдэхүүний үйлдвэрлэлийн индекс, өмнөх оны
105.7
107.7 108.9
110.6
109.1 108.7
мөн үе=100 сараар, хувиар
109.0
116.1
111.1
107.1
103.0 101.9
105.7
108.6 108.8
111.5 112.2 112.4
114.8
125.0
120.0
115.0
110.0
105.0
100.0
95.0
2012 I II III IV V VI VII 2013 I II III IV V VI VII VIII IX X XI XII
Нийт дүн Уул уурхай, олборлох аж үйлдвэр
2013
2012
Нийт дүн 2 059.0 2 272.1 2 608.3 114.8
Уул уурхай, олборлох аж үйлдвэр 1 203.9 1 291.2 1 566.0 121.3
Боловсруулах аж үйлдвэр 628.1 744.1 794.4 106.8
Цахилгаан, дулааны эрчим хүч үйлдвэрлэл, усан
хангамж
227.0 236.8 247.9 104.7
%
22. МАКРО ЭДИЙН ЗАСГИЙН ҮЗҮҮЛЭЛТ – Барилга
Барилга угсралт, их засварын ажлын хэмжээ, оны үнээр,
жил бүрийн эцэст, тэрбум төг
Гүйцэтгэгчийн төрөл 2011 2012 2013 2013
2012
Барилга угсралт, их засварын ажил, бүгд 745.0 811.3 1 452.2 179.0
Дотоодын барилгын байгууллагын гүйцэтгэсэн 657.2 748.1 1 326.3 177.3
Гадаадын барилгын байгууллагын гүйцэтгэсэн 87.8 63.2 125.9 199.2
%
Барилга угсралт, их засварын ажил,
745.0
тэрбум.төг
811.3
1452.2
657.2
748.1
1326.3
87.8 63.2 125.9
1500
1000
500
0
2011 2012 2013
Барилга угсралт, их засварын ажил, бүгд
Дотоодын барилгын байгууллагын гүйцэтгэсэн
Гадаадын барилгын байгууллагын гүйцэтгэсэн
23.0
97.5
258.1
745.0
23.1
140.6
340.9
811.3
27.4
355.2
1132.6
1452.2
1600
1400
1200
1000
800
600
400
200
0
I II III IV
òýðáóì òºã
Барилга угсралт, их засварын ажил,
улирлаар
2011 2012 2013
23. Агаарын тээврээр тээсэн ачаа тоо, жил
23
МАКРО ЭДИЙН ЗАСГИЙН ҮЗҮҮЛЭЛТ - Тээвэр
Төмөр замын тээврээр зорчигчдын тоо, жил
бүрийн эцсийн байдлаар, мян.хүн
3 832.1 4 000.0 3 781.4
2011 2012 2013
Төмөр замын тээврээр тээсэн ачаа, жил
18 447.7
бүрийн эцсийн байдлаар, мян.т
20 445.2
21 002.9
2011 2012 2013
Агаарын тээврээр зорчигчдын тоо, жил
бүрийн эцсийн байдлаар, мян.хүн
574.0
770.2 767.4
2011 2012 2013
2 928.5
бүрийн эцсийн байдлаар, т
4011.1
4 063.6
2011 2012 2013
24. 24
МАКРО ЭДИЙН ЗАСГИЙН ҮЗҮҮЛЭЛТ - Холбоо
Харилцаа холбооны үйлчилгээний орлого, тэрбум төг
380.1 401.6
459.0
569.1
631.0
309.2 315.0 343.9
436.1
468.3
2009 2010 2011 2012 2013
Нийт орлого Хүн амаас орсон орлого
25.