Submit Search
Upload
2012 world data map
•
1 like
•
270 views
C
Carlos Maculan
Follow
2012 world data map
Read less
Read more
Report
Share
Report
Share
1 of 2
Download now
Download to read offline
Recommended
Which countries are best in the world in A- national team football by Siggi E...
Siggi Eyjolfsson
Legatum prosperity index_2017_rankings_table
Taras Sidorzhevsky
Silver Summit Master Plan Final
Summer Young
Censo
Censo
JonatanTd
Insure school information series of the insurance industry trends cgiaai 25...
Jaswanth Singh G
PI2015Brochure_WEB
PI2015Brochure_WEB
Solène Dengler
2015 legatum-prosperity-index-pdf
Daniel Alouidor
2016 12 31 - Annual Market Returns - Colour Coded
Richard Philbin
Full report best european countries for business 2018
mResearcher
Nigeria-population-and-political-participation
statisense
Criando micro multinacionais disruptivas
Leo Uchoa
Indices 18 oct2013052548
Investors Empowered
Weltweite demographische Zahlen von Facebook per 31.03.2010
Thomas Hutter eConsulting & Coaching
Nickelodeon report
Nickelodeon report
Madré Wilson
Visualising elections
Gramener
Konversi toefl ac_ept
qwlasting
Bigcedar v2
Bigcedar v2
bigcedargolf
Hong Kong's Profile in The Global Innovation Index 2013
Asia Pacific Intellectual Capital Centre Ltd
Derivative Margin Report 24 DEC
Mansukh Investment & Trading Solutions
Tabla de comparacion pago de pmg 2020 completa
marcosroa2
World cup Round 1
World cup Round 1
Cardiff City FC
Steel statistical-yearbook-2014
Aditya Kansal
NYC Foreign Population by Decade, Country - Seventh Revision
Zach Sanders
Structural indicators 2014
ΟΤΟΕ
Global Innovation Index 2019
tsnua
US Department of Commerce Export
NC Military Business Center
RMG Export (Knit of Bangladesh)
Faisal Ahmed Bappi
healthcare healthcare statistics.pdf
sdfghj21
Free Market Road Show 2013 | Razeen Sally
Conservative Institute / Konzervatívny inštitút M. R. Štefánika
Vendas por Marca
Vendas por Marca
Eduardo Abbas
More Related Content
What's hot
Full report best european countries for business 2018
mResearcher
Nigeria-population-and-political-participation
statisense
Criando micro multinacionais disruptivas
Leo Uchoa
Indices 18 oct2013052548
Investors Empowered
Weltweite demographische Zahlen von Facebook per 31.03.2010
Thomas Hutter eConsulting & Coaching
Nickelodeon report
Nickelodeon report
Madré Wilson
Visualising elections
Gramener
Konversi toefl ac_ept
qwlasting
Bigcedar v2
Bigcedar v2
bigcedargolf
Hong Kong's Profile in The Global Innovation Index 2013
Asia Pacific Intellectual Capital Centre Ltd
Derivative Margin Report 24 DEC
Mansukh Investment & Trading Solutions
Tabla de comparacion pago de pmg 2020 completa
marcosroa2
World cup Round 1
World cup Round 1
Cardiff City FC
What's hot
(13)
Full report best european countries for business 2018
Nigeria-population-and-political-participation
Criando micro multinacionais disruptivas
Indices 18 oct2013052548
Weltweite demographische Zahlen von Facebook per 31.03.2010
Nickelodeon report
Nickelodeon report
Visualising elections
Konversi toefl ac_ept
Bigcedar v2
Bigcedar v2
Hong Kong's Profile in The Global Innovation Index 2013
Derivative Margin Report 24 DEC
Tabla de comparacion pago de pmg 2020 completa
World cup Round 1
World cup Round 1
Similar to 2012 world data map
Steel statistical-yearbook-2014
Aditya Kansal
NYC Foreign Population by Decade, Country - Seventh Revision
Zach Sanders
Structural indicators 2014
ΟΤΟΕ
Global Innovation Index 2019
tsnua
US Department of Commerce Export
NC Military Business Center
RMG Export (Knit of Bangladesh)
Faisal Ahmed Bappi
healthcare healthcare statistics.pdf
sdfghj21
Free Market Road Show 2013 | Razeen Sally
Conservative Institute / Konzervatívny inštitút M. R. Štefánika
Vendas por Marca
Vendas por Marca
Eduardo Abbas
Resultats annuels au 1632017
www.bourse-maroc.org
2013 statistics tables (1)
Ochä MegaSukma
Dance4life Int
Dance4life Int
Tania Evlampieva
Dance4life Int
Dance4life Int
guestebbec752
Cambodia tourism statistics - May 2012
Chau Duong
all page likes
all page likes
David Guibord
ISO Survey 2021: ISO 27001.pdf
Andrey Prozorov, CISM, CIPP/E, CDPSE. LA 27001
ISO_Survey_ISO_27001_1664888513.pdf
Tactika inc.
Рейтинг національних брендів-2016 (Nation Brands 2016)
tsnua
Perú en la IMO hasta el 2020, Internacionales de Matemáticas
Jim Andrew Uni - Cultural
Global innovation index 2017 rankings
Seth Madhusudan Rathi
Similar to 2012 world data map
(20)
Steel statistical-yearbook-2014
NYC Foreign Population by Decade, Country - Seventh Revision
Structural indicators 2014
Global Innovation Index 2019
US Department of Commerce Export
RMG Export (Knit of Bangladesh)
healthcare healthcare statistics.pdf
Free Market Road Show 2013 | Razeen Sally
Vendas por Marca
Vendas por Marca
Resultats annuels au 1632017
2013 statistics tables (1)
Dance4life Int
Dance4life Int
Dance4life Int
Dance4life Int
Cambodia tourism statistics - May 2012
all page likes
all page likes
ISO Survey 2021: ISO 27001.pdf
ISO_Survey_ISO_27001_1664888513.pdf
Рейтинг національних брендів-2016 (Nation Brands 2016)
Perú en la IMO hasta el 2020, Internacionales de Matemáticas
Global innovation index 2017 rankings
More from Carlos Maculan
Il calzaturiero di san mauro pascoli 2011
Carlos Maculan
Monitor dei distretti italiani 2012
Carlos Maculan
2012 world footwear year book
Carlos Maculan
Manuale calzaturiero
Carlos Maculan
2011 worldfootwearyearbook
Carlos Maculan
Il Polo Fiorentino della Pelle
Carlos Maculan
Competitors Leathergoods
Carlos Maculan
Competitors Shoes
Competitors Shoes
Carlos Maculan
Outsourcing India
Outsourcing India
Carlos Maculan
Outsourcing Brazil
Outsourcing Brazil
Carlos Maculan
More from Carlos Maculan
(10)
Il calzaturiero di san mauro pascoli 2011
Monitor dei distretti italiani 2012
2012 world footwear year book
Manuale calzaturiero
2011 worldfootwearyearbook
Il Polo Fiorentino della Pelle
Competitors Leathergoods
Competitors Shoes
Competitors Shoes
Outsourcing India
Outsourcing India
Outsourcing Brazil
Outsourcing Brazil
2012 world data map
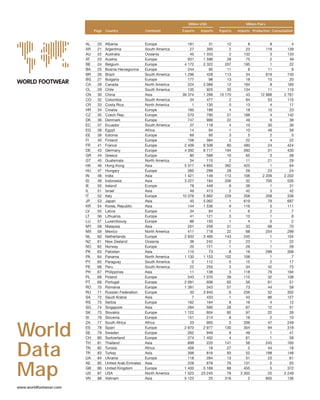
1.
www.worldfootwear.com AL 20 Albania
Europe 181 31 12 8 8 4 AR 21 Argentina South America 27 395 2 23 118 139 AU 22 Australia Oceania 45 1 333 2 132 3 133 AT 23 Austria Europe 931 1 596 28 75 2 49 BE 24 Belgium Europe 4 172 2 322 207 195 1 22 BA 25 Bosnia Herzegovina Europe 244 95 11 6 11 6 BR 26 Brazil South America 1 296 428 113 34 819 740 BG 27 Bulgaria Europe 177 98 13 18 15 20 CA 28 Canada North America 224 2.089 12 164 8 160 CL 29 Chile South America 135 925 35 134 11 110 CN 30 China Asia 39 374 1 289 10 170 43 12 888 2 761 CO 32 Colombia South America 34 477 2 64 53 115 CR 33 Costa Rica North America 1 130 0 13 4 17 HR 34 Croatia Europe 160 189 4 18 10 23 CZ 35 Czech Rep. Europe 570 790 51 188 4 142 DK 36 Denmark Europe 747 989 22 49 9 36 EC 37 Ecuador South America 37 118 4 10 30 36 EG 38 Egypt Africa 14 94 1 10 49 58 EE 39 Estonia Europe 69 95 3 5 2 5 FI 40 Finland Europe 156 384 3 22 4 22 FR 41 France Europe 2 409 6 506 80 480 24 424 DE 43 Germany Europe 4 392 8 717 194 593 31 430 GR 44 Greece Europe 80 588 10 65 3 58 GT 45 Guatemala North America 34 115 2 11 21 29 HK 46 Hong Kong Asia 5 317 4 850 362 425 1 64 HU 47 Hungary Europe 385 299 28 29 23 24 IN 48 India Asia 1 421 149 113 106 2 209 2 202 ID 49 Indonesia Asia 3 227 184 206 32 700 526 IE 50 Ireland Europe 78 448 8 38 1 31 IL 51 Israel Asia 49 413 2 42 3 42 IT 52 Italy Europe 10 376 5 662 229 358 208 336 JP 53 Japan Asia 45 5 062 1 619 79 697 KR 54 Korea, Republic Asia 144 1 536 9 116 5 111 LV 55 Latvia Europe 34 94 1 6 2 7 LT 56 Lithuania Europe 41 121 3 10 1 8 LU 57 Luxembourg Europe 86 150 1 4 0 2 MY 58 Malaysia Asia 201 259 31 33 68 70 MX 59 Mexico North America 411 718 22 68 254 299 NL 60 Netherlands Europe 2 933 3 465 143 245 1 104 NZ 61 New Zealand Oceania 38 242 2 23 1 22 NO 62 Norway Europe 20 721 1 26 1 26 PK 63 Pakistan Asia 110 73 8 16 299 308 PA 64 Panama North America 1 130 1 153 102 108 1 7 PY 65 Paraguay South America 0 112 0 15 2 17 PE 66 Peru South America 22 255 3 34 42 73 PH 67 Philippines Asia 11 138 3 118 79 194 PL 68 Poland Europe 543 1 070 39 115 32 108 PT 69 Portugal Europe 2 091 606 65 56 61 51 RO 70 Romania Europe 1 391 343 57 73 44 59 RU 71 Russian Federation Europe 30 3 940 6 256 52 302 SA 72 Saudi Arabia Asia 7 433 1 43 86 127 RS 73 Serbia Europe 162 164 8 16 4 12 SG 74 Singapore Asia 284 560 28 67 12 51 SK 75 Slovakia Europe 1 122 604 92 97 22 26 SI 76 Slovenia Europe 151 214 8 16 2 10 ZA 77 South Africa Africa 33 905 3 206 47 249 ES 78 Spain Europe 2 870 2 977 130 354 94 318 SE 79 Sweden Europe 262 949 9 49 1 41 CH 80 Switzerland Europe 274 1 402 4 61 1 58 TH 81 Thailand Asia 899 220 141 56 245 160 TN 82 Tunisia Africa 409 18 27 2 44 18 TR 83 Turkey Asia 398 816 93 52 188 148 UA 84 Ukraine Europe 118 284 13 51 23 61 AE 85 United Arab Emirates Asia 228 678 76 131 0 55 GB 86 United Kingdom Europe 1 400 5 169 88 455 5 372 US 87 USA North America 1 023 23 245 78 2 302 25 2 249 VN 88 Vietnam Asia 5 123 25 316 2 805 136 Country Continent Exports Million USD Million Pairs Exports ProductionImports Imports ConsumptionPage World Data Map
2.
8% 3% 3% 5% 6% 47% 87% 1% 2% 17% 21% ©APICCAPS 2012 Detailed
terms at www.worldfootwear.com Copyright 21 billion pairs produced +5% 2011 growth Italy $0 $0$20$10 $20$10 $40$30 $23.83 $45.32 $32.00 $30.18 $16.20 $14.70 $3.87 $7.70 $6.13 $4.79 $3.71 $30 $50 Portugal France Vietnam Hong Kong China AVERAGE EXPORT PRICES 2011 CONTINENTAL SHARES 2011 by Product Type by Country of Origin Leather Waterproof Textile Rubber & Plastic Other For each country production and consumption are represented by concentric circles. The area of each circle is roughly to be proportional to each variable value. The smaller value is always represented above the greater one. The visible area of the background circle can be interpreted as the trade balance (positive if the background circle is Production e.g.: China; or negative if the back- ground circle is consumption e.g.: USA and almost all European countries). The numbers above the country names correspond to production and numbers bel- low are related to consumption. The chart representing the average export price by country only shows the big- gest three exporters and the three exporters with the highest price from the top 15 exporter list. PRODUCTION www.worldfootwear.com CONSUMPTION 430 31 WORLD FOOTWEARPRODUCTION AND CONSUMPTION 2011 million pairs www.worldfootwear.com USA 2 249 25 Mexico 299 254 CA 160 8 Brazil 819 740 AR 118 139 CO 53 115 CL 11 110 PE GT DO EC China 87% Other Sources 13% Indonesia 526 700 Vietnam 136 805 12 888 India 2 202 2 209 Pakistan 308 299 Bangladesh 268 276 TH 160 245 Turkey 148 188 Iran 173 185 79 PH 194 127 86 SA MY Italy 336 208 France 424 24 Spain 335 94 PT United Kingdom 372 5 CZ 142 4 NL 104 1 RO UA RU 302 52 697 79 Japan FI SE NO HU SK HR BG BY BEIE Nigeria 114 213 ZA 47 249 1 Algeria 139 Angola 123 TN EG IL AE PL 32 108 GR China Domestic Consumption 21% Other Export Markets 38% North America 21% Imports 1,6% Europe 18% Japan 5% 2 761 3 NZ AU 133 HK 111 5 KR SG AT CH DK CRPA Portugal is the only European country with production greater than consumption and one of the few outside Asia. Panama, trading imported footwear register the highest openness indicator worldwide. Hong Kong is the most relevant player in triangular footwear trade. Without any relevant production, Hong Kong exports 362 million pairs of imported footwear. India and Pakistan are relevant producers but strictly focused on their internal markets. They have the lowest openness indicators recorded. Germany
Download now